Two Kuwaits: A Young Citizen Population and a Migrant Workforce


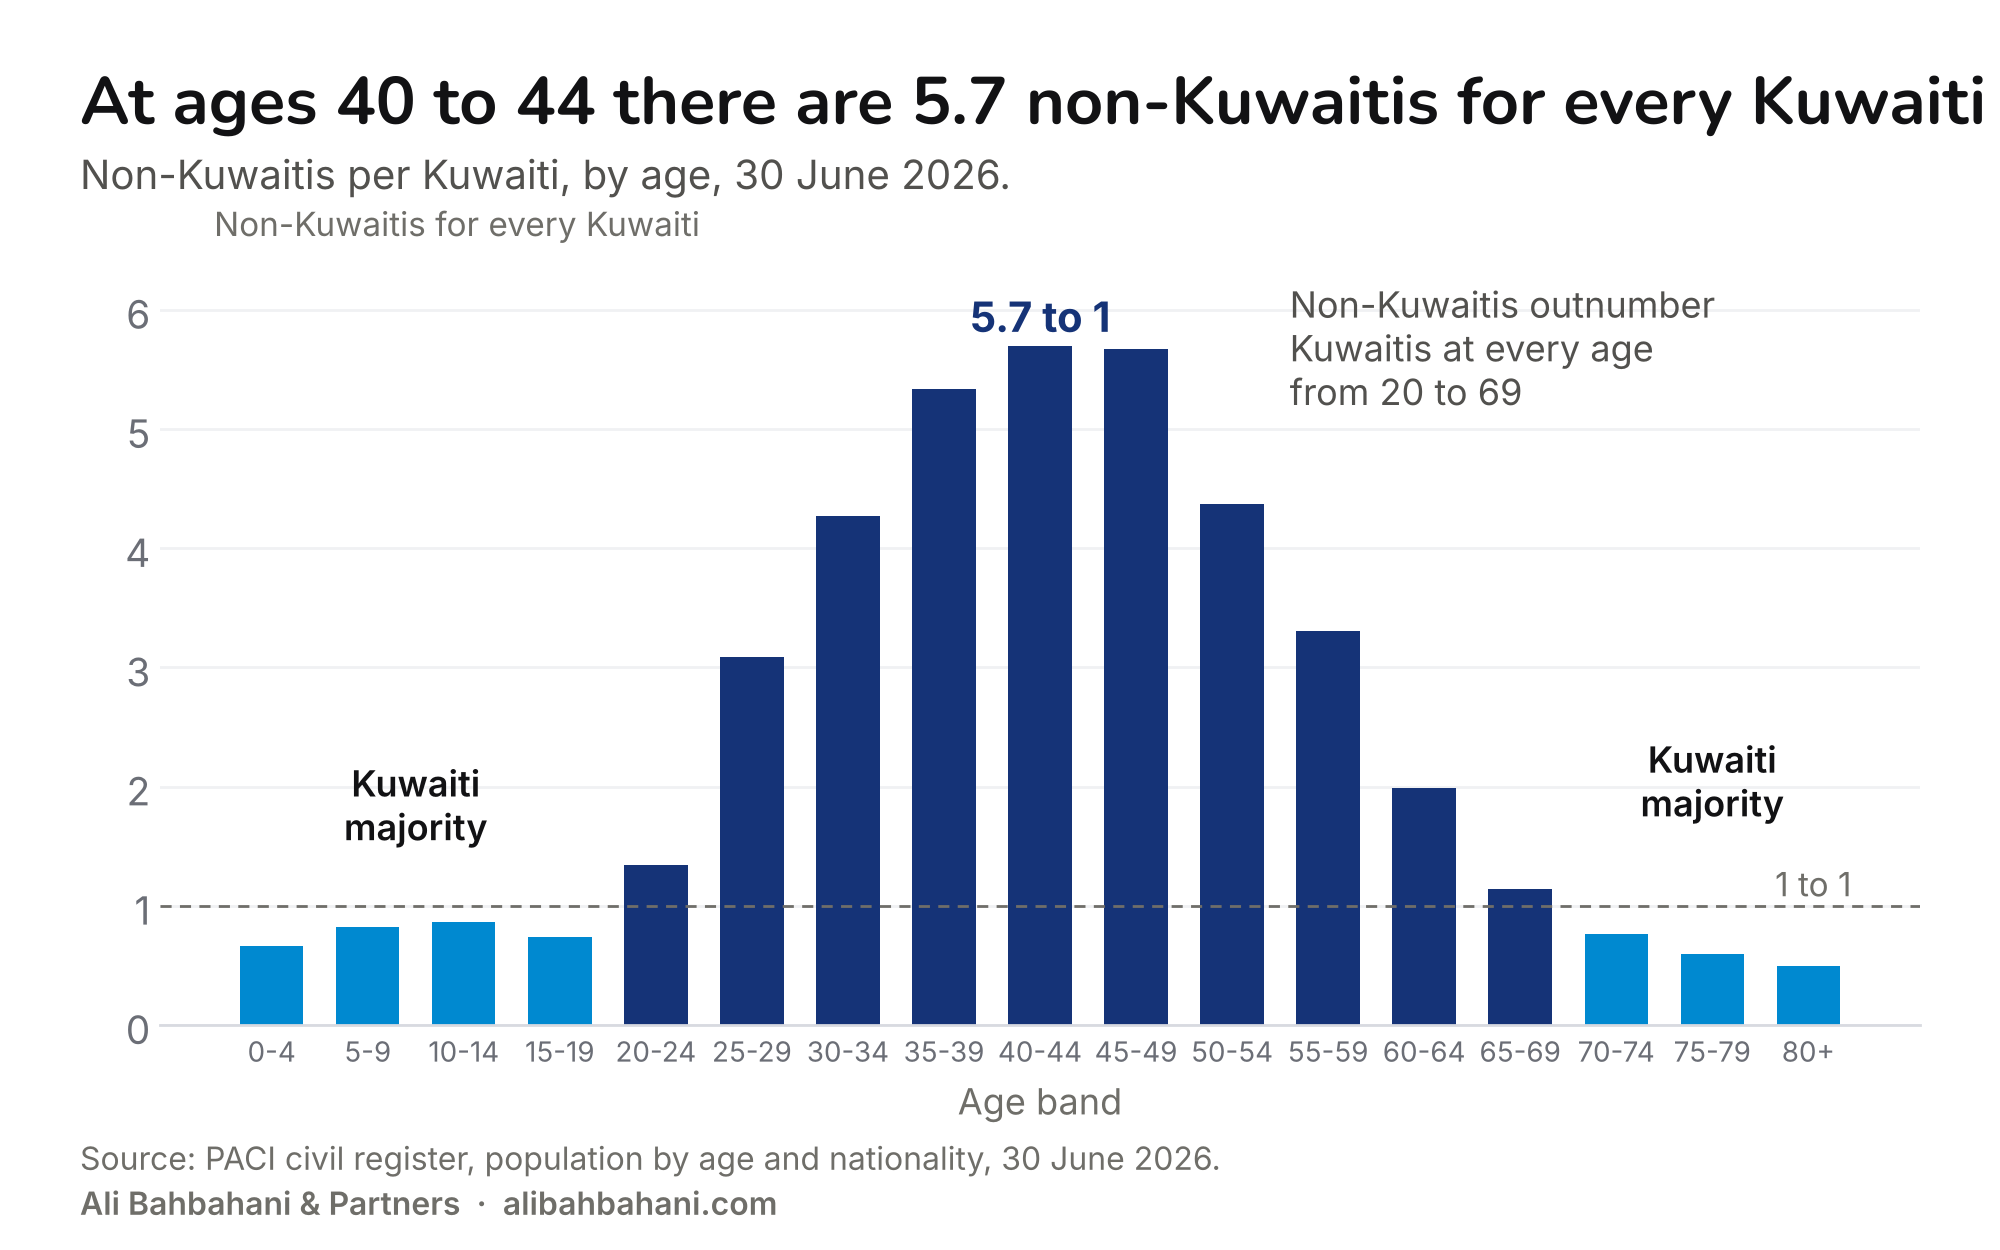
Pick any 40-year-old in Kuwait. The odds are nearly six to one that they are not Kuwaiti. Pick a child under five instead and the odds flip: three Kuwaiti children for every two who are not.
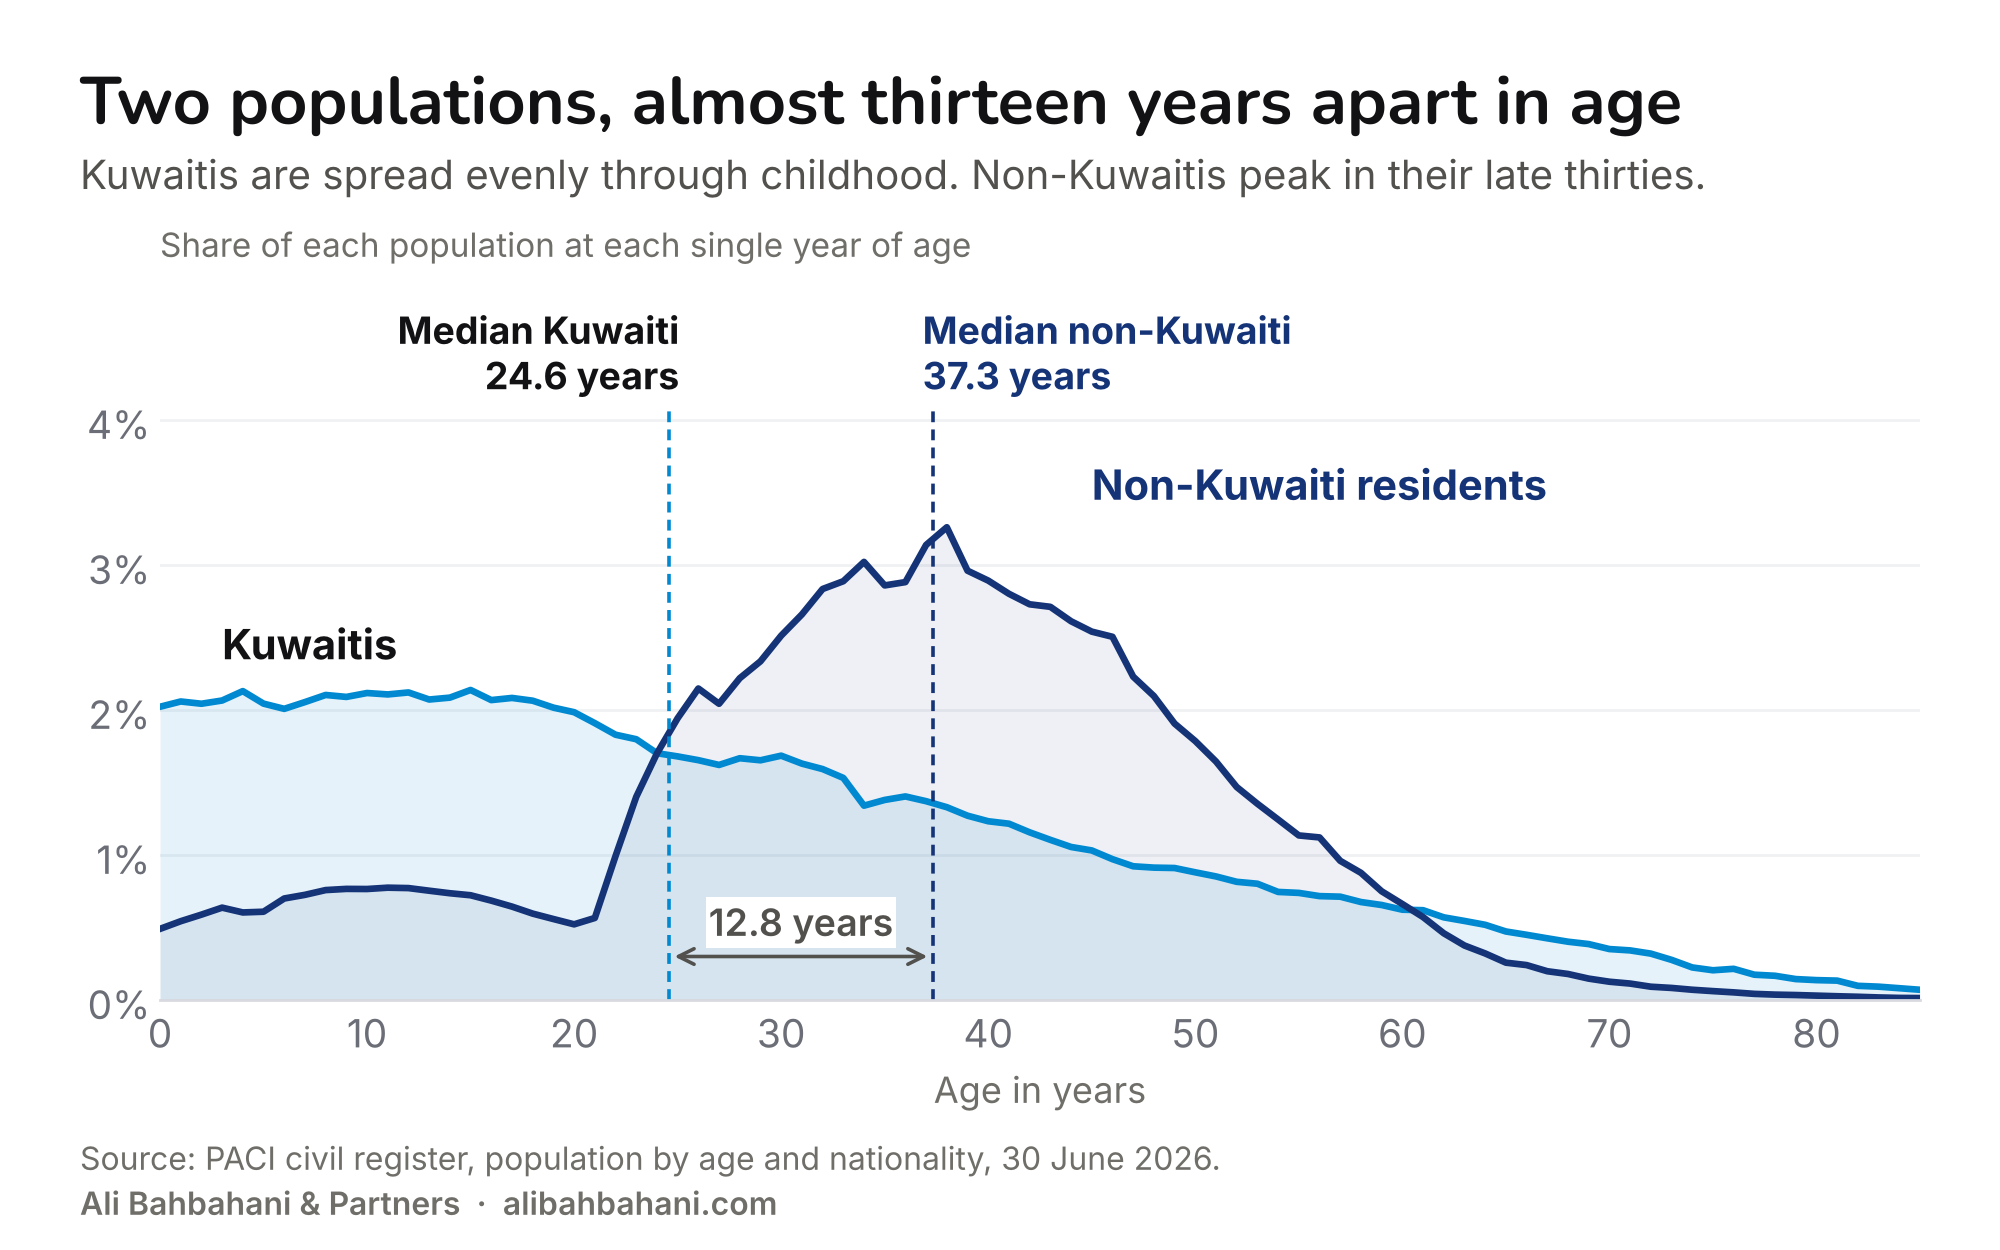
Kuwait counts two populations that share the same streets and the same traffic, yet barely overlap in age. At the end of June 2026 the civil register held 1.57M Kuwaitis and 3.74M non-Kuwaitis. The median Kuwaiti is 24.6 years old. The median non-Kuwaiti is 37.3.
A gap of almost thirteen years does not happen by chance. It is what a residence system tied to the job produces when it runs for decades. Most non-Kuwaitis arrive as adults; family permits are a small share; fewer children are born to them here each year; and few are counted past 65.
I followed that gap through five sets of official numbers: the age profile, the permits that bring people in, the work people do, the births that happen here, and the money that leaves. The population counts come from the civil register of the Public Authority for Civil Information (PACI) at 30 June 2026, which records everyone by single year of age and by work status. Permits, births and marriages come from the Central Statistical Bureau (CSB), and transfers abroad from the Central Bank of Kuwait (CBK).
Why one growth rate misleads
Most market plans in Kuwait start from one number: the population, and how fast it grows. That number blends two groups that grow for different reasons.
Take a school operator and a recruiter. The school's market is Kuwaiti children and the non-Kuwaiti families who settle with them. Kuwaiti births have been flat since 2010, which gives it a far better starting point than headline population growth: the children who will start school over the next five years are already born. The recruiter's market is non-Kuwaiti adults of working age, and that moves with permit rules and hiring, sometimes within a single year. If both plan off the same national growth rate, at least one of them is using the wrong number.
The rest of this piece shows where the two populations split, and by how much.
Two countries, one map
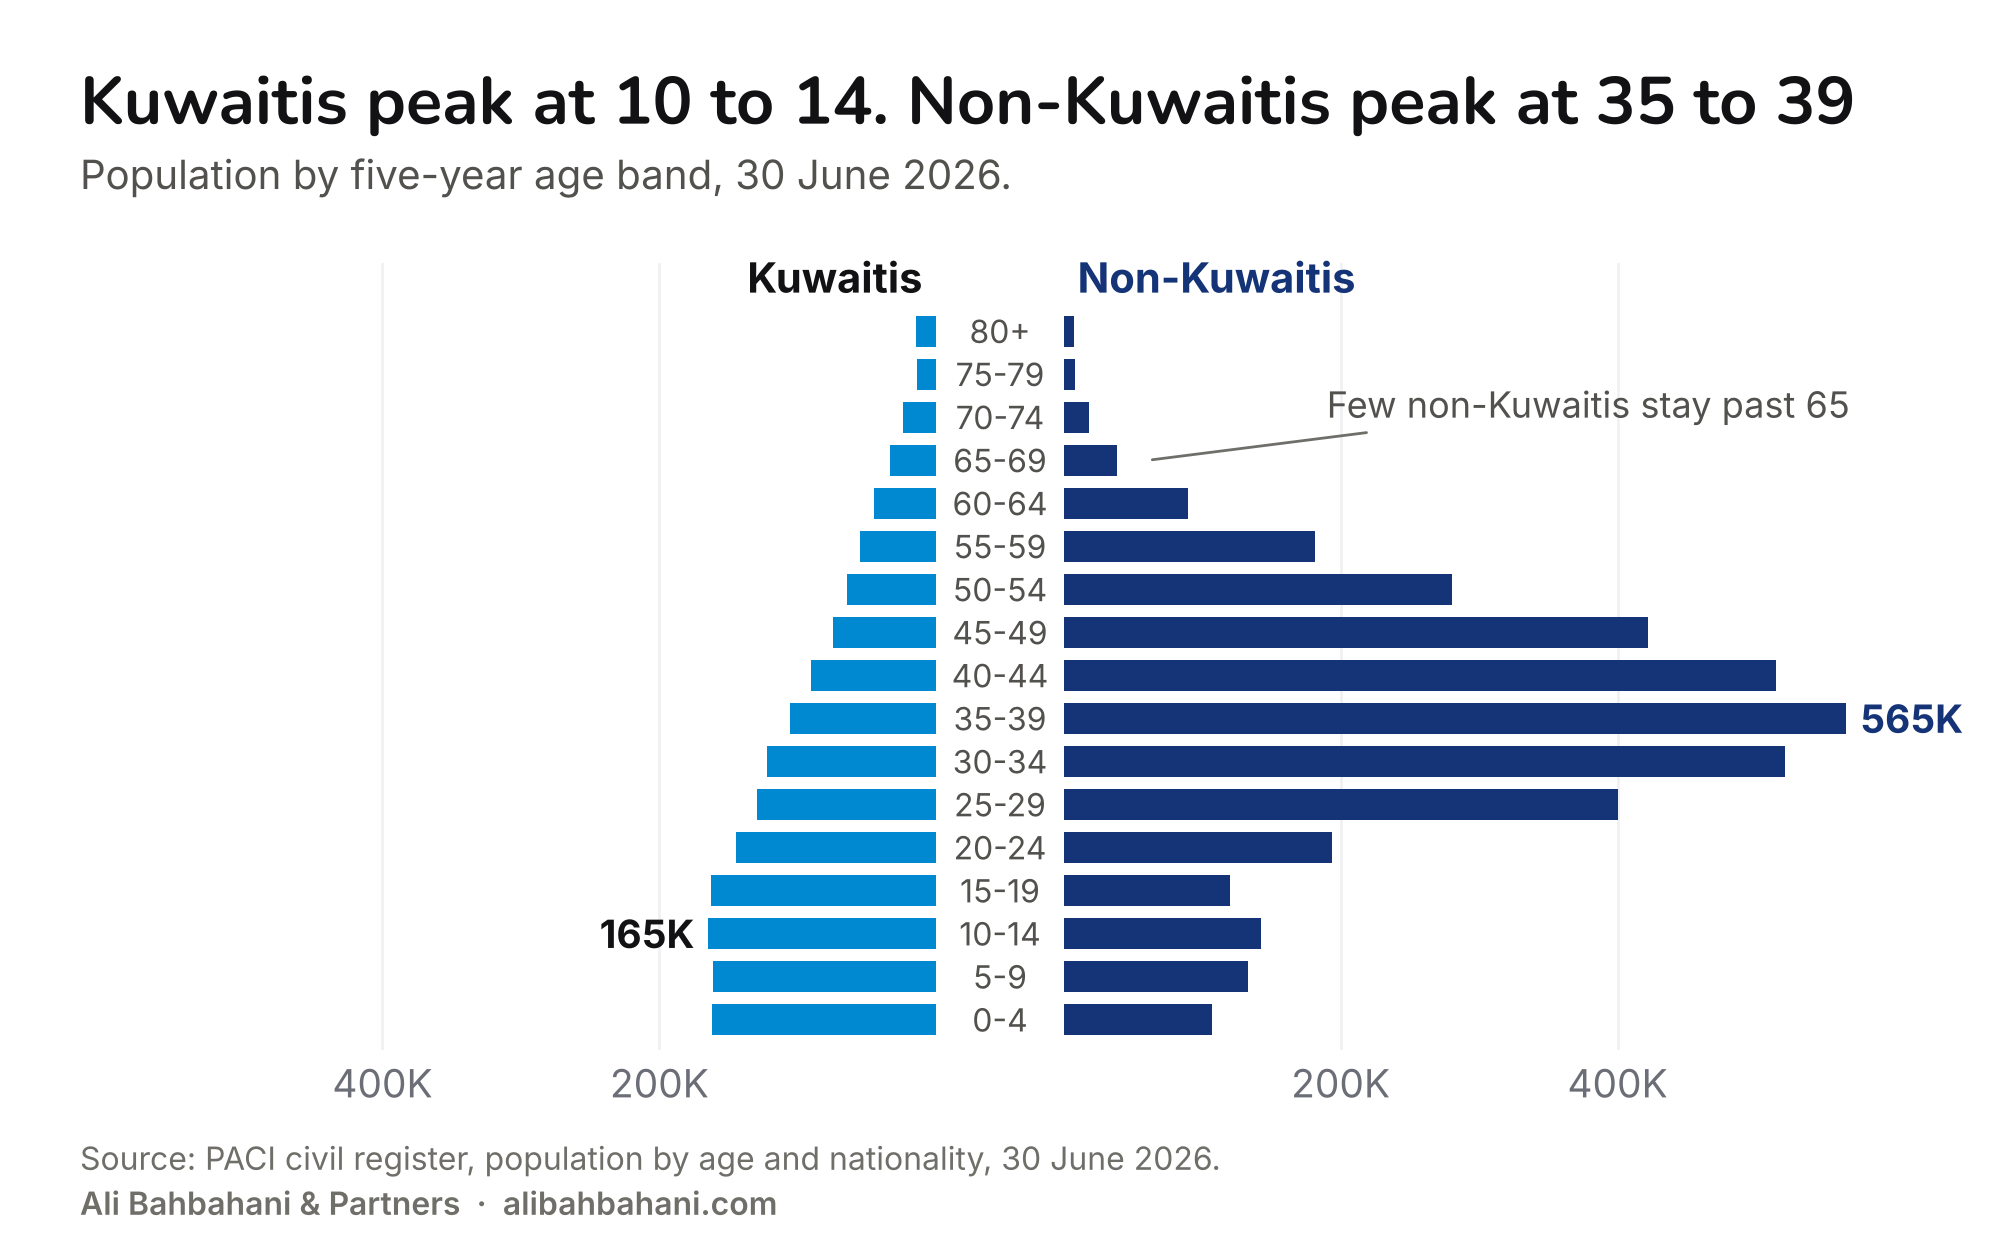
Put the two curves on one chart and they barely touch. Kuwaitis are spread evenly across childhood: about 2% of all Kuwaitis sit at each single age from birth to 19. Non-Kuwaitis are thin at those ages, then climb steeply after 20 and peak in their late thirties.
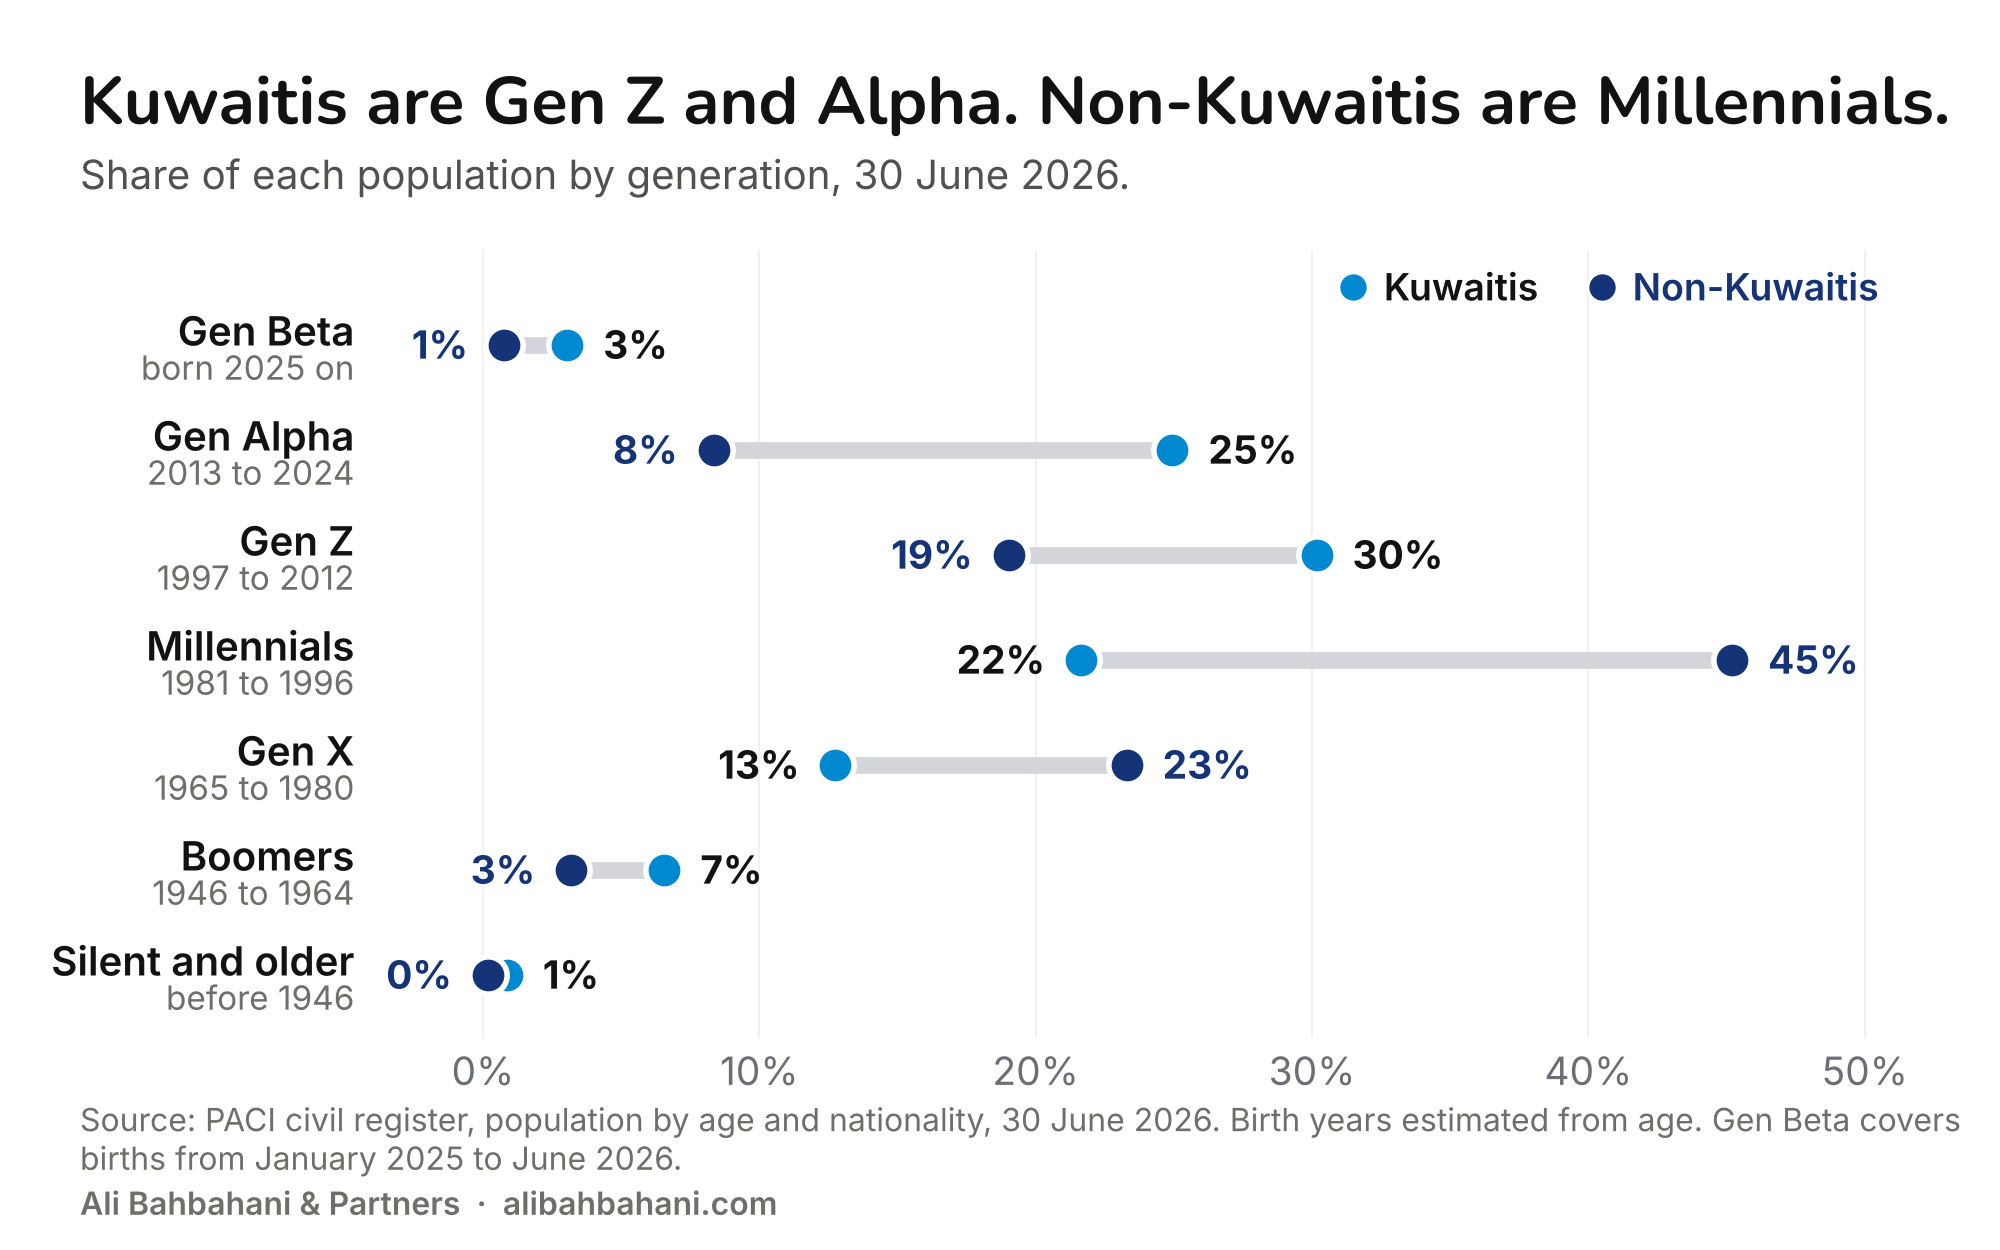
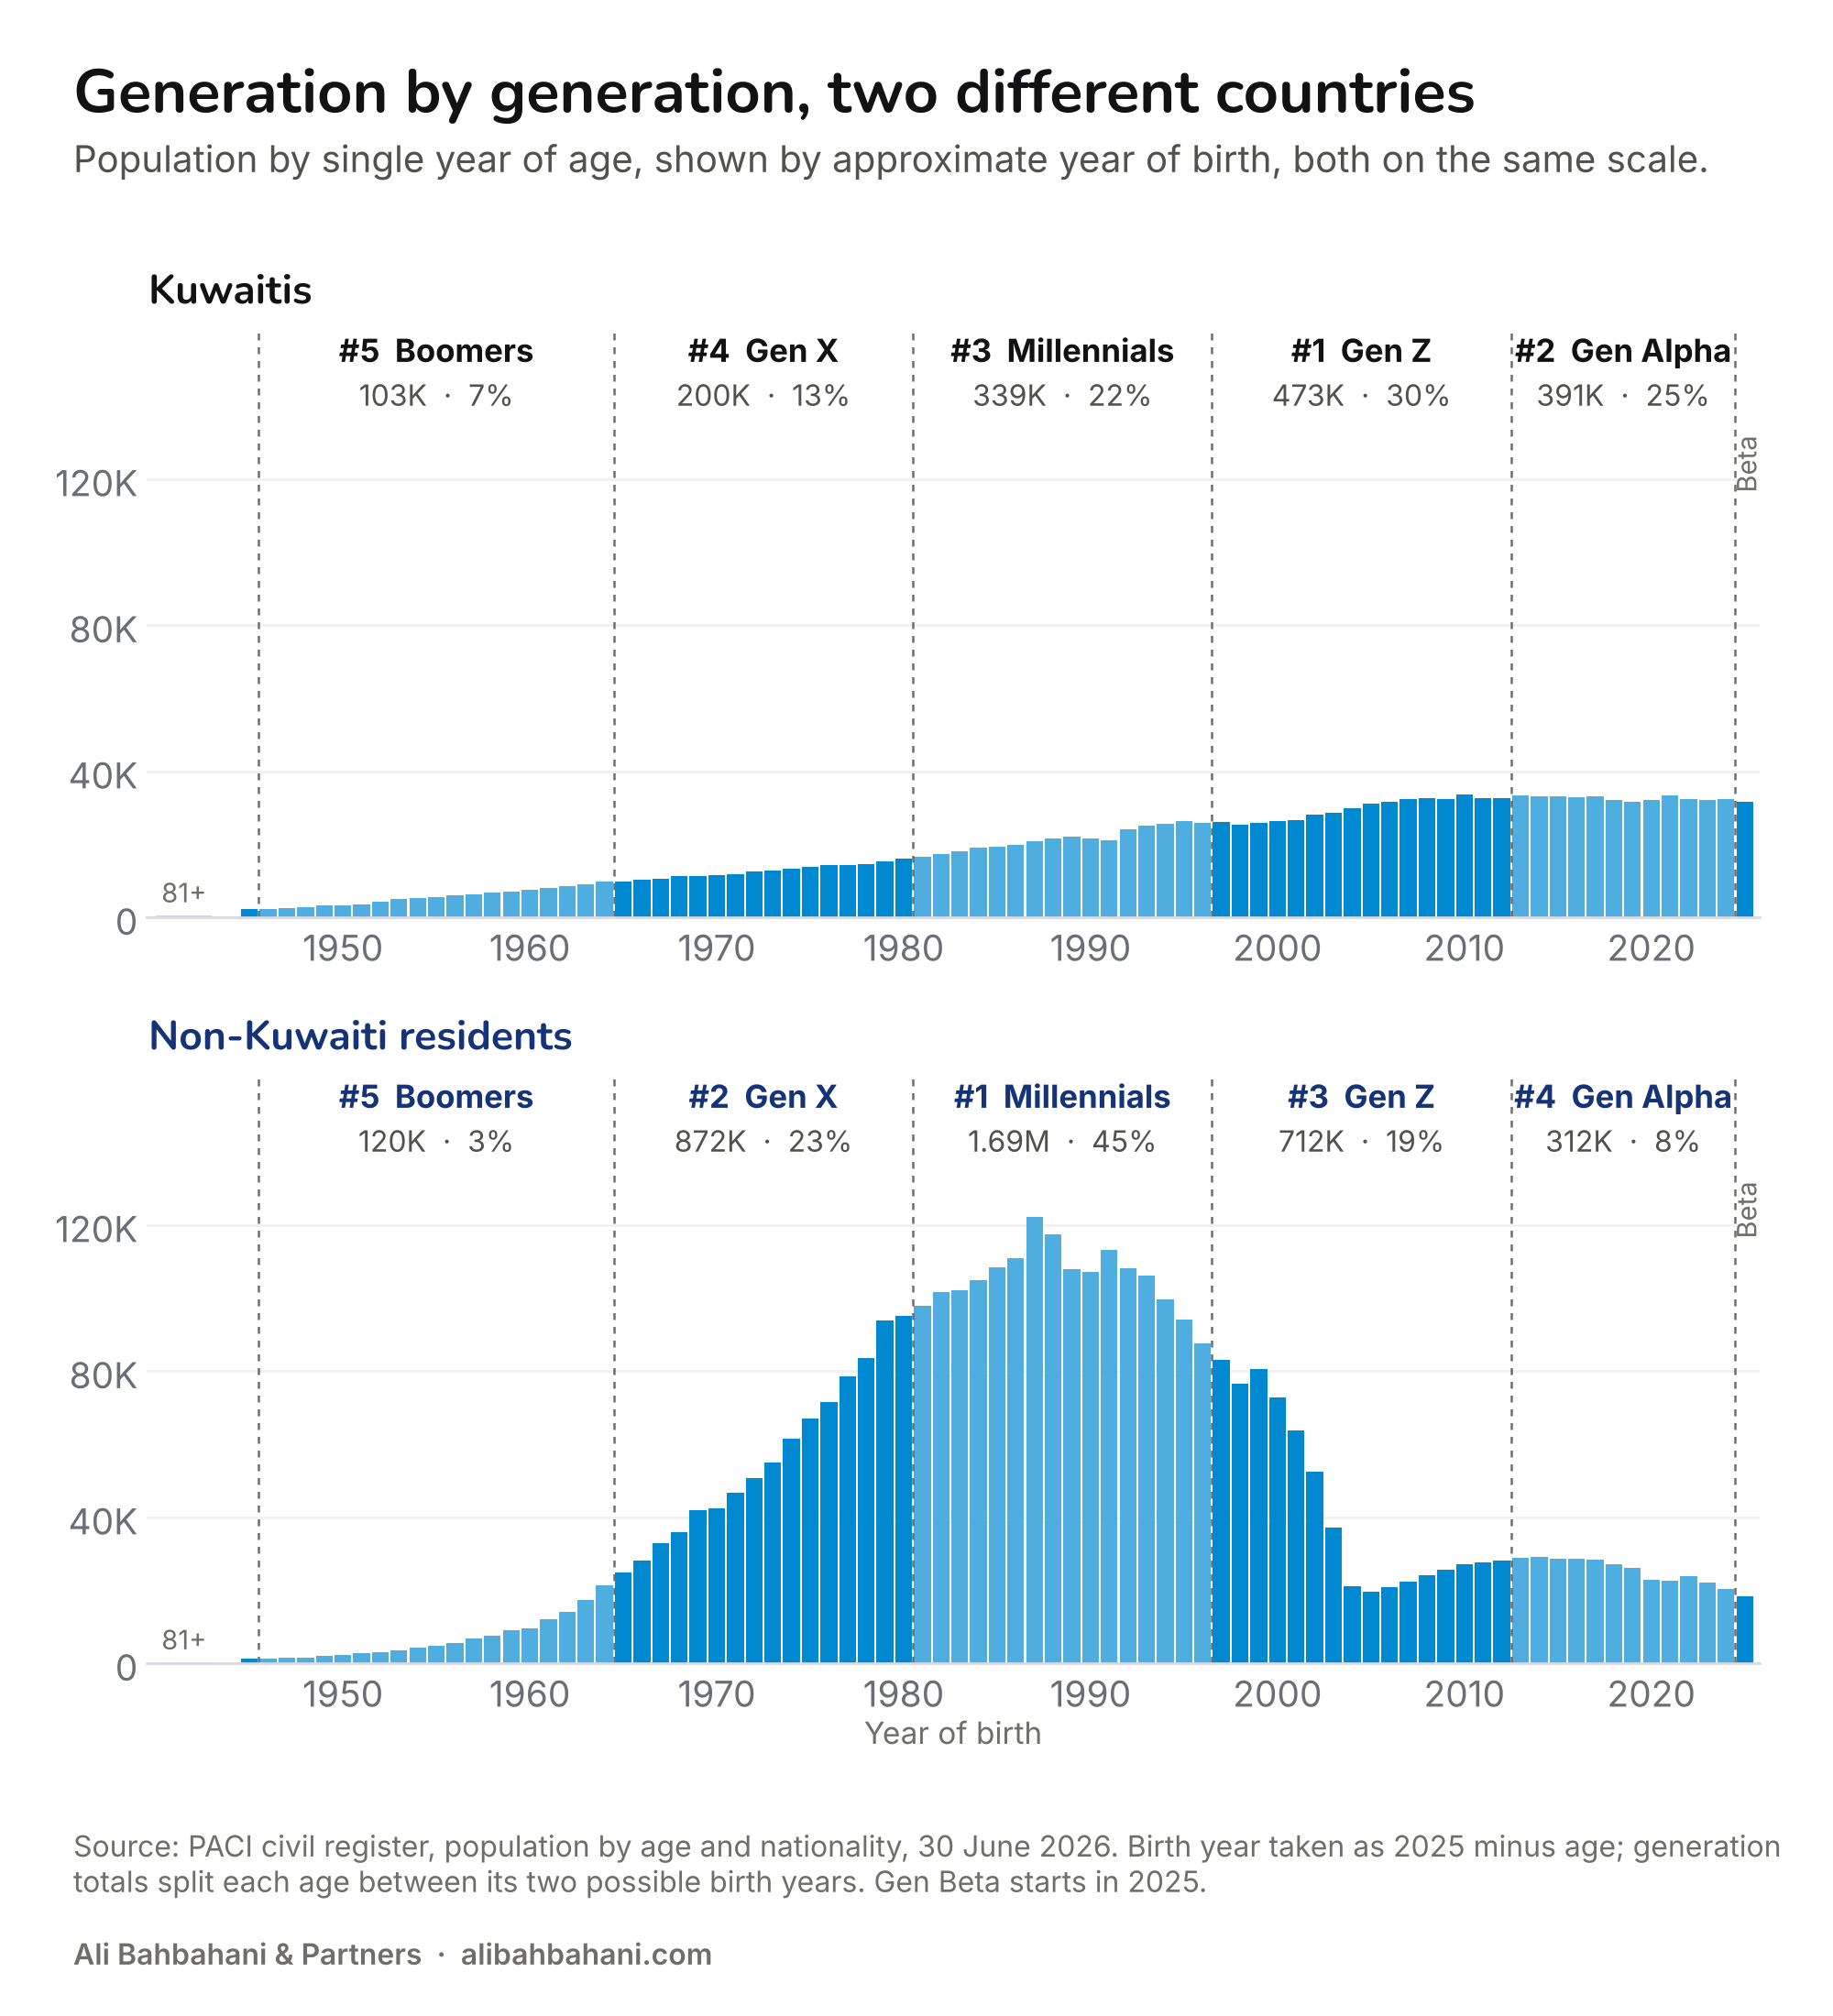
Sort by birth years and the two groups could be different countries. 58% of Kuwaitis were born in 1997 or later: 30% from 1997 to 2012 (Gen Z), 25% from 2013 to 2024 (labelled Gen Alpha here) and 3% since 2025. 68% of non-Kuwaitis were born between 1965 and 1996 (Gen X and Millennials). Only 8% were born from 2013 to 2024.
Lay every birth year side by side, on the same scale, and the shape of each country appears. The Kuwaiti bars climb gently from the 1950s and then go flat: every year of birth since about 2006 holds between 31K and 34K Kuwaitis. Kuwaitis born 1997 to 2012 (473K) are the largest group and those born 2013 to 2024 (391K) the second. The non-Kuwaiti bars form a single hump centred on people born in the late 1980s, then fall away. Non-Kuwaiti Millennials alone number 1.69M, more than all Kuwaitis put together.
The pyramid shows it in heads rather than shares. The largest Kuwaiti band is ages 10 to 14, at 165K. The largest non-Kuwaiti band is 35 to 39, at 565K, more than three times bigger. Past 65 the non-Kuwaiti side almost disappears.
Line the two up age by age and Kuwaitis hold a majority only at the two ends of life: under 20 and over 70. In every band from 20 to 69, non-Kuwaitis outnumber Kuwaitis. At 40 to 44 the ratio peaks at 5.7 to 1; at exactly 40 it is 5.6.
So the national mix is set at working age, and hiring sets it. If you want to know why Kuwait looks the way it does, look at the permits.
A residence system built around the job
CSB counted 3.17M valid residence permits in 2025. That is fewer than the 3.74M non-Kuwaitis on the civil register; the two come from different systems and do not match. Eight in ten were for work: 1.67M in the private sector, 773K in domestic work and 102K in government. Family dependants held 567K, or 18%.
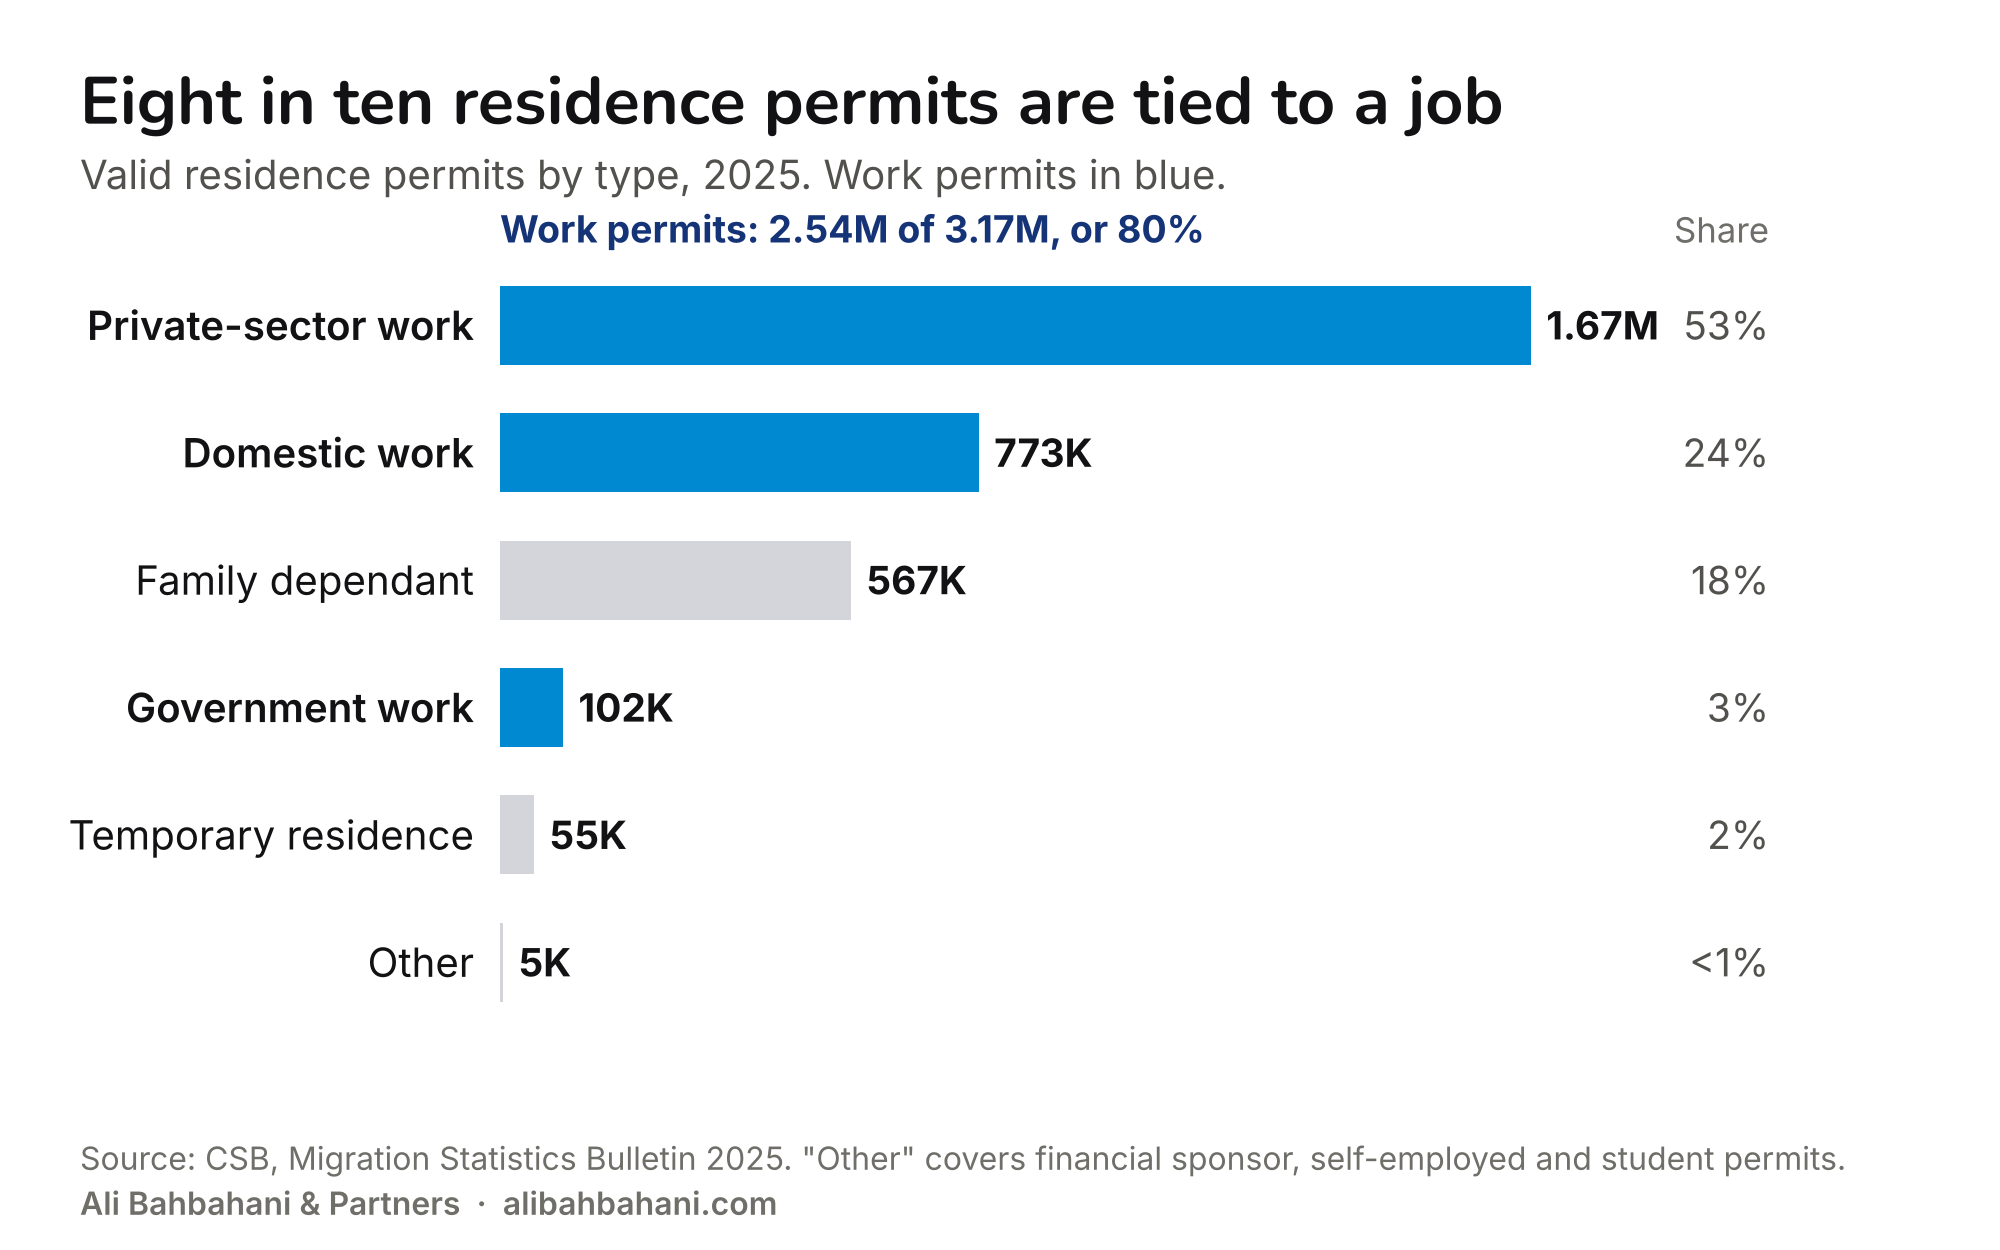
Most non-Kuwaitis hold their right to stay through an employer. The flow of new permits points the same way. In 2025 Kuwait issued 46K first-time domestic-worker permits and 18K for private-sector work, against 20K first-time permits for family dependants.
Family permits are a small share. Domestic workers cannot sponsor dependants, so take them out of the count. Across private, government and self-employed permits there were 32 family-dependant permits for every 100 work permits in 2025, and the ratio has barely moved since 2022. That is a count of permits, not of households. It does not tell us how many workers live with family: one worker can sponsor several dependants, and a spouse who works holds a work permit of their own.
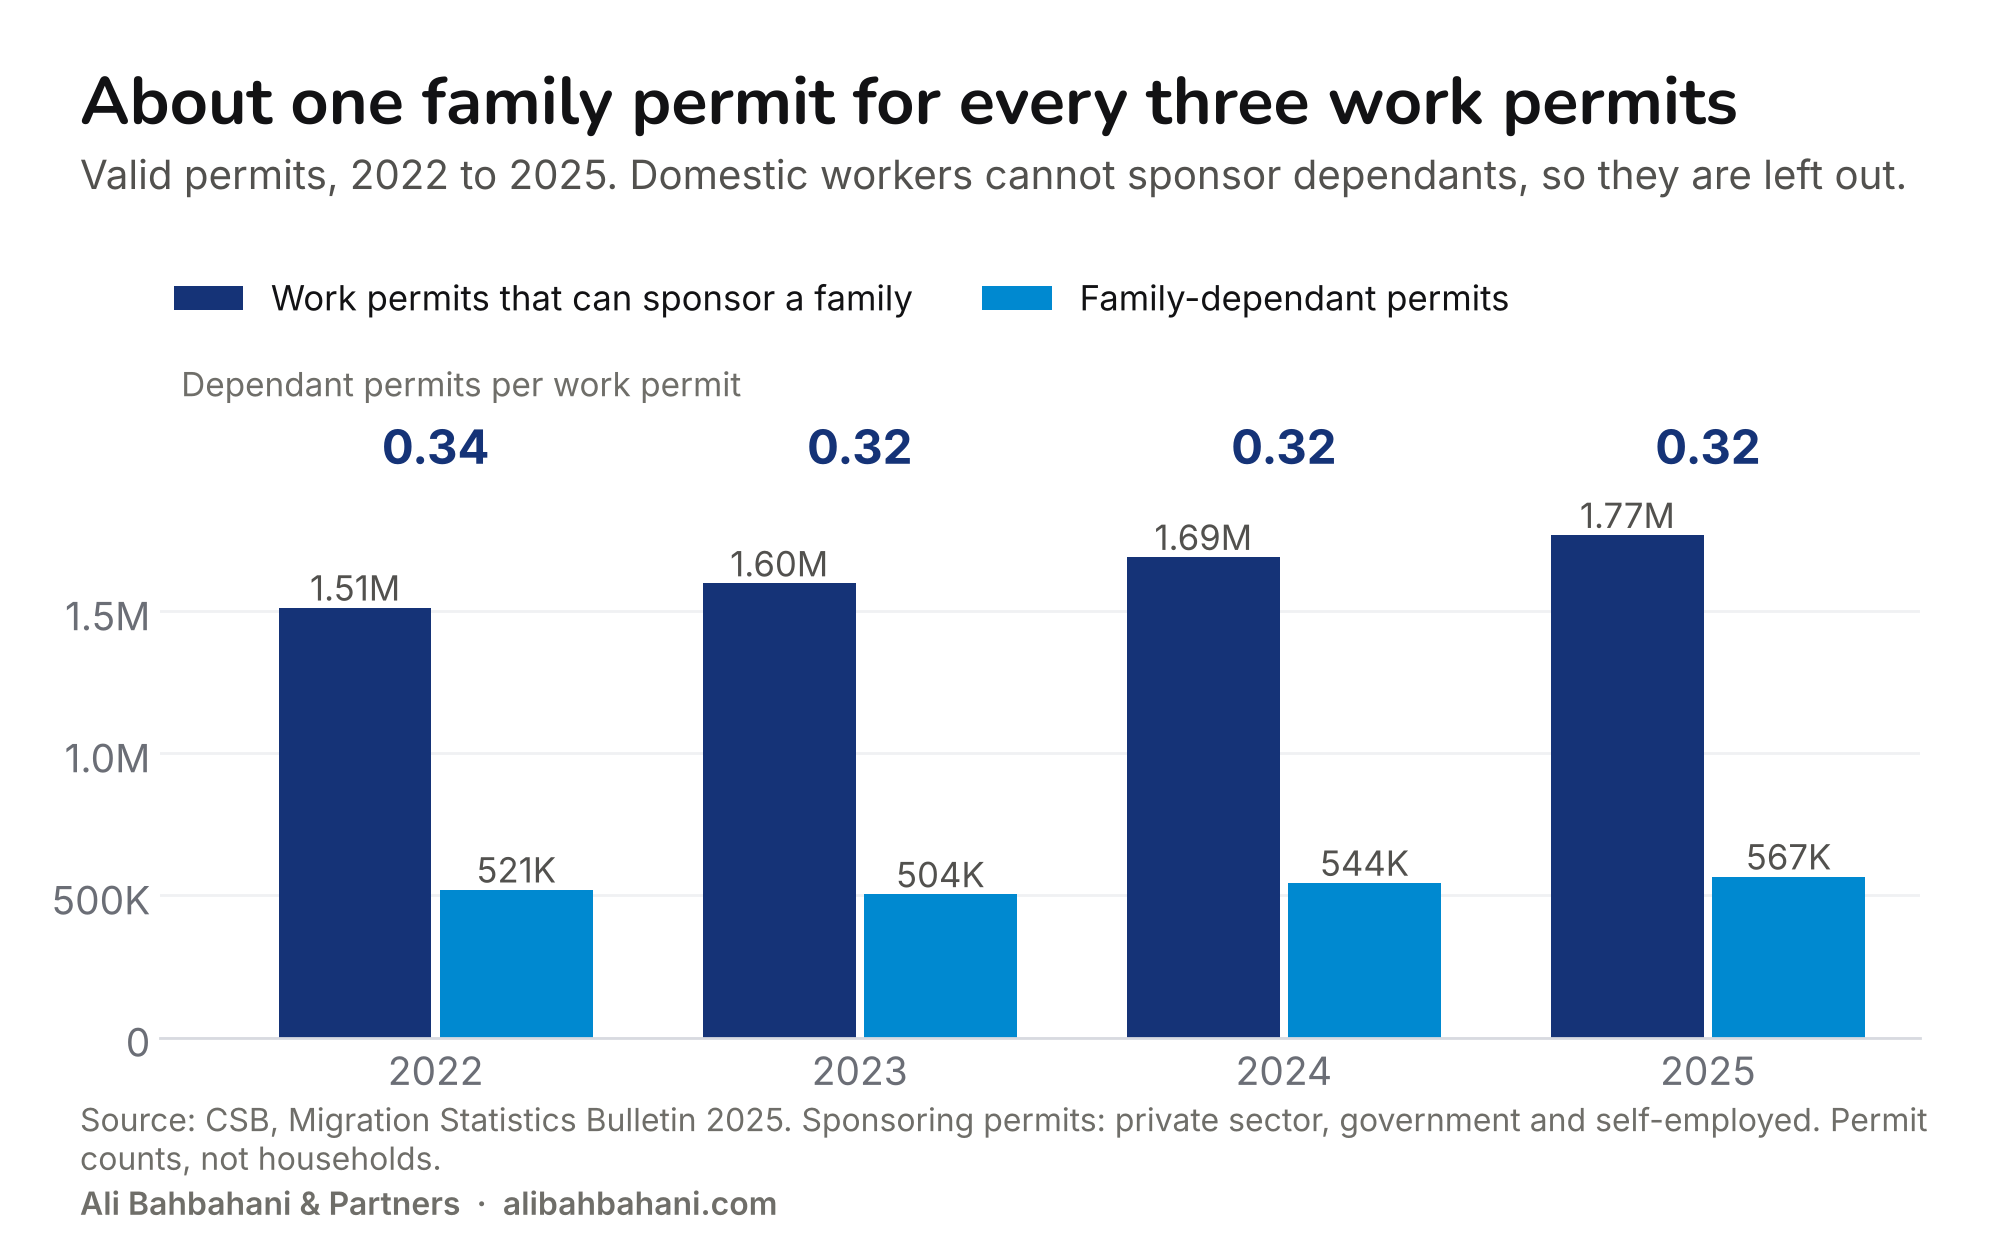
Salary thresholds for family visas, school fees, housing costs and the design of the 2025 expat health insurance reform all bear on whether a worker brings dependants. The data cannot say which matters most. They do show the ratio has held for four years.
Marriage records point the same way. In 2024 Kuwait registered 10,564 marriages between two Kuwaitis and 2,183 between two non-Kuwaitis, although non-Kuwaitis outnumber Kuwaitis more than two to one. Per head, Kuwaitis register more than ten times as many marriages: 6.9 per 1,000 against 0.6. Some non-Kuwaiti couples marry in their home country and never appear in Kuwait's records, so the gap overstates the difference in family life. The records cannot say how large that effect is.

The mixed marriages are a quiet bridge between the two populations. In 2024, 1,400 Kuwaiti men married non-Kuwaiti women, about one in eight Kuwaiti grooms, and 492 Kuwaiti women married non-Kuwaiti men.
Two ways of working
The register also records what each person does, and here the two populations split again.
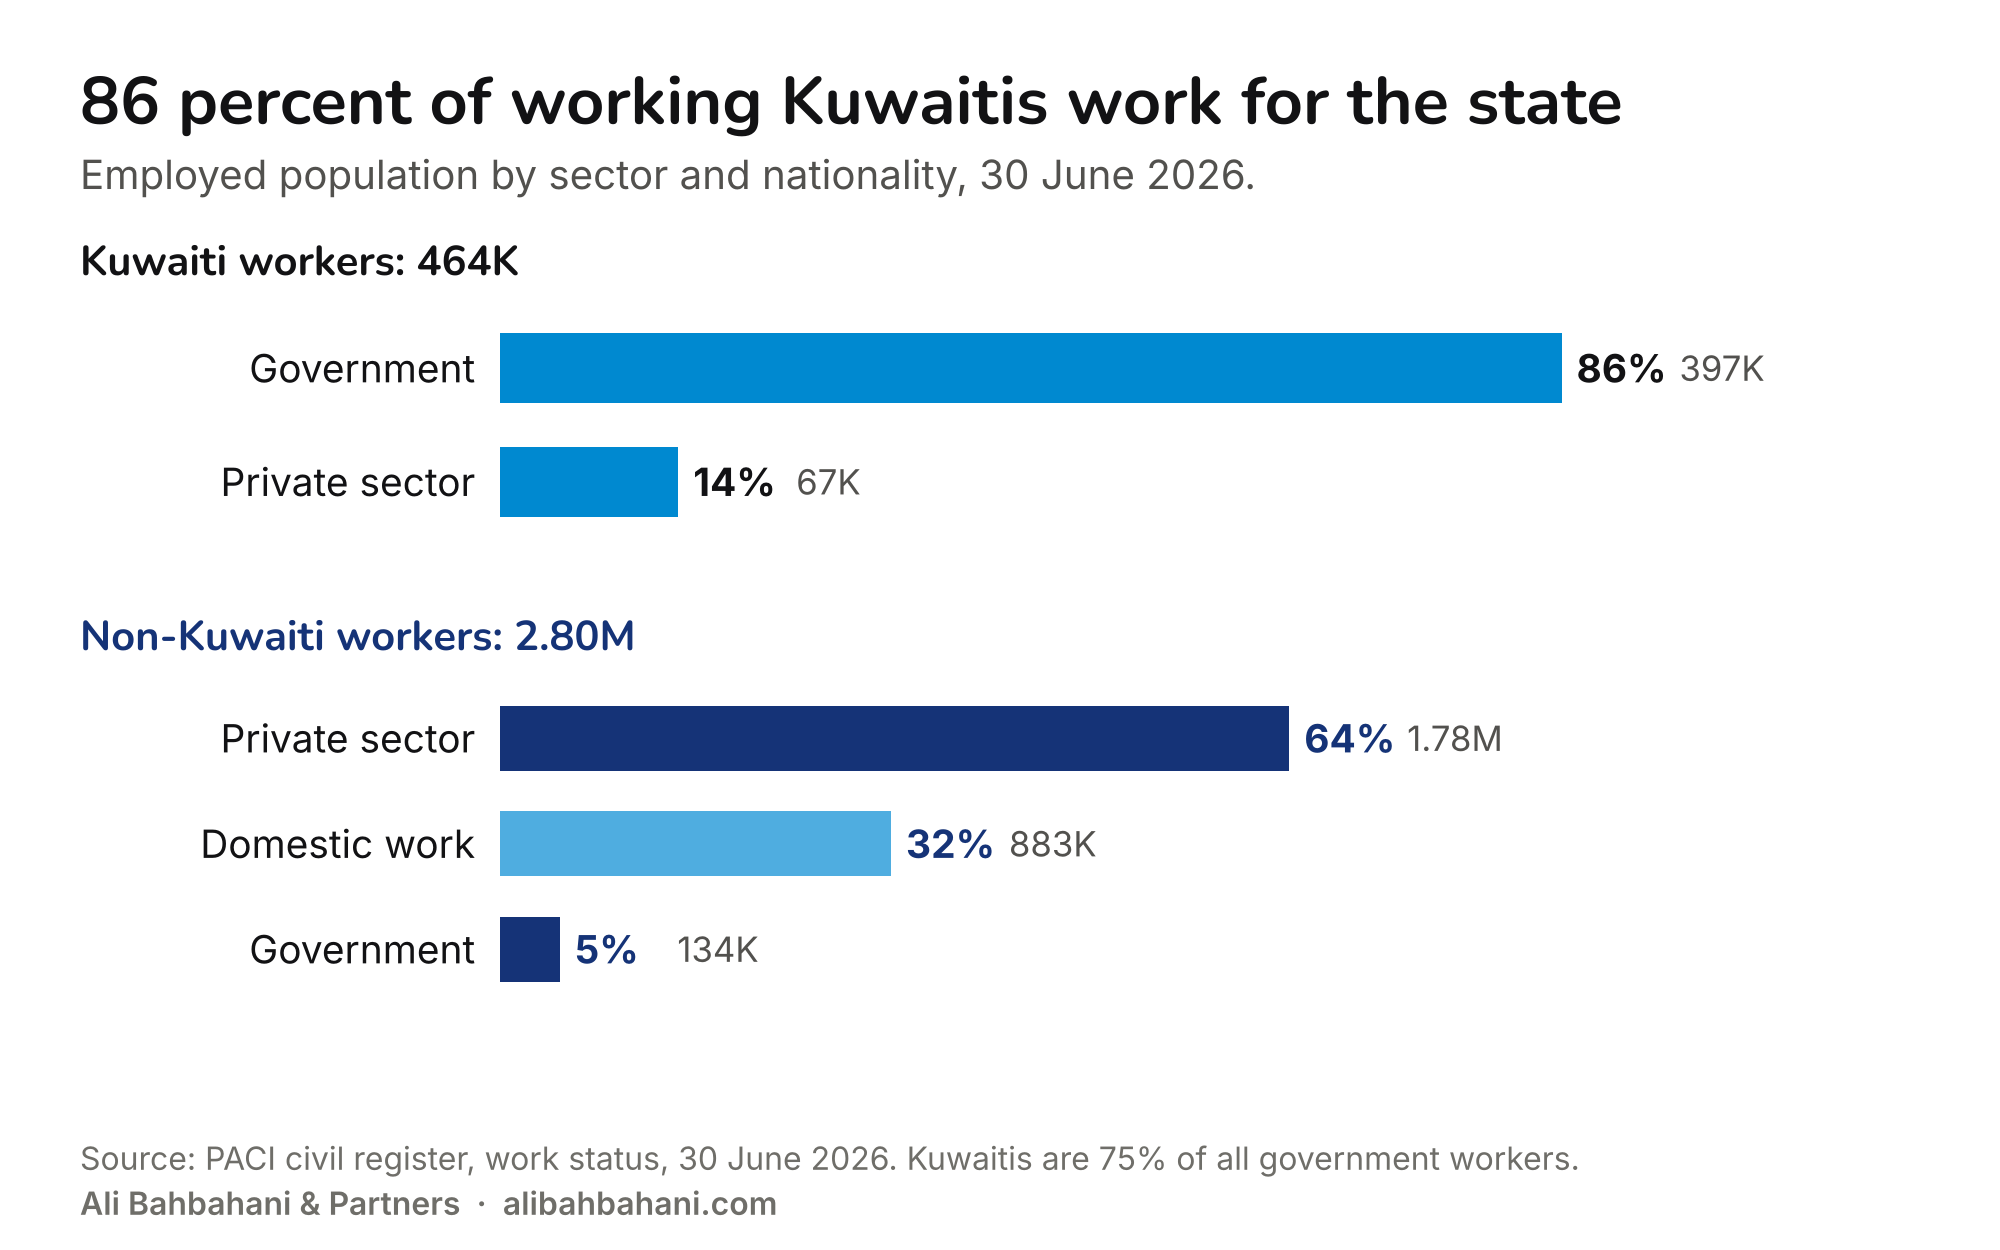
Of 464K Kuwaitis in work, 397K, or 86%, work for the state. Only 67K work in the private sector. Non-Kuwaitis run the other way: of 2.80M in work, 1.78M are in private firms, 883K in households, and 134K in government. Kuwaitis hold three quarters of all government jobs. The private economy, and almost all of the household economy, runs on workers whose right to stay is tied to a job.
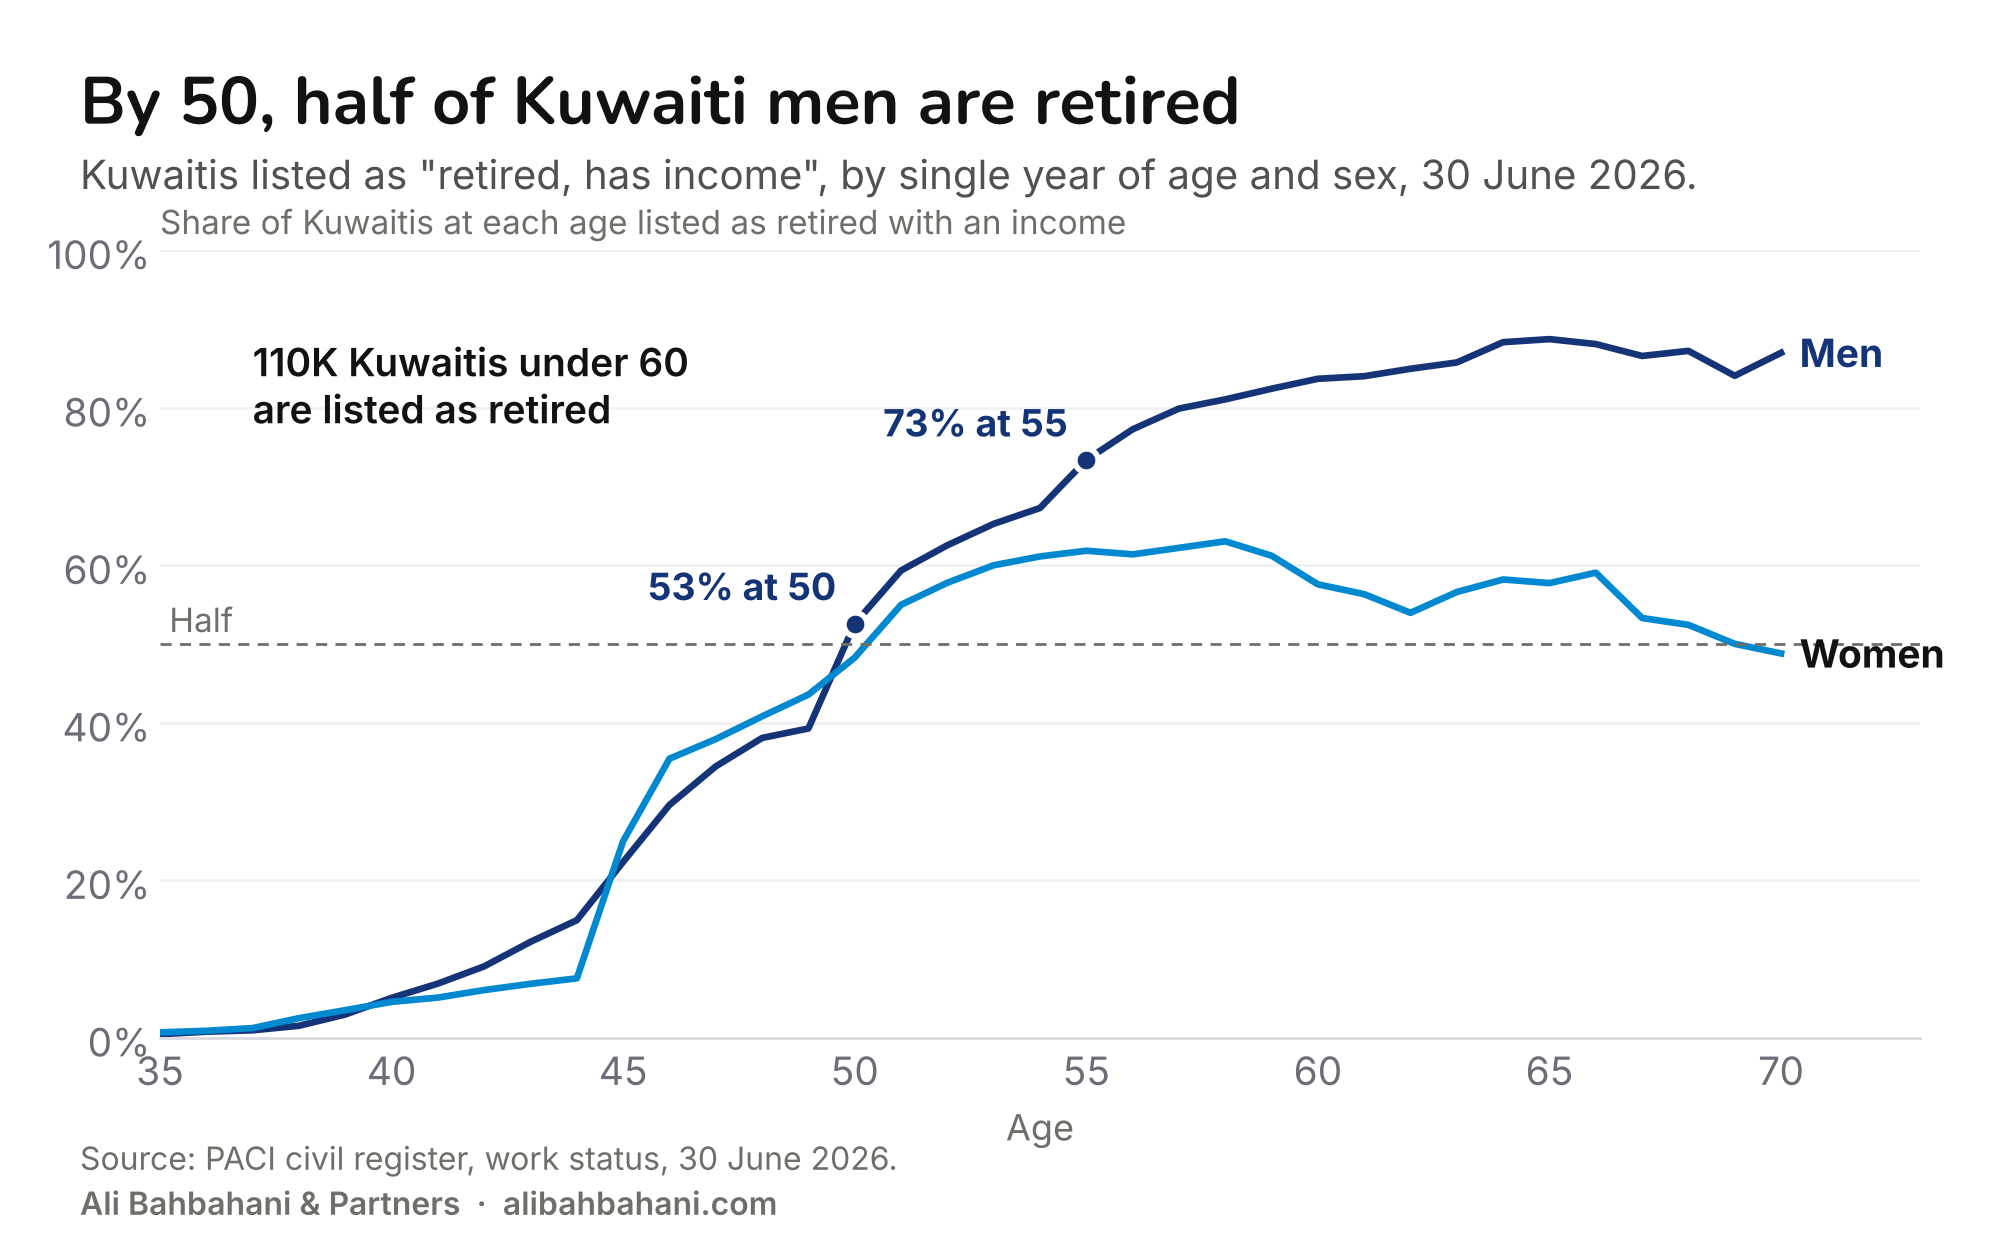
The second split is in when work ends. The register lists 186K Kuwaitis as retired with an income, and 110K of them are under 60. At 45, roughly a quarter of Kuwaitis are retired. At 50, more than half of Kuwaiti men are. By 55 it is nearly three in four men and six in ten women. Non-Kuwaitis barely appear in that column: 6,600 in total.
Put the two together and the life cycles mirror each other. Kuwaitis enter the workforce through the state, and many leave it in their late forties with a pension and decades of adult life ahead. Non-Kuwaiti workers arrive in their late twenties, fill the private sector, and few reach pension age here. The young Kuwaiti workforce that those born since 1997 will become has to find jobs in an economy built around that arrangement. For the fiscal side of early retirement, see The Kuwaiti Dream, Priced.
Domestic work does not balance the numbers
It is tempting to assume domestic work evens out the male surplus with women. It does less than that. The register lists 883K domestic workers: 510K women and 373K men. Men are 42% of the sector, and under 30 they outnumber women.

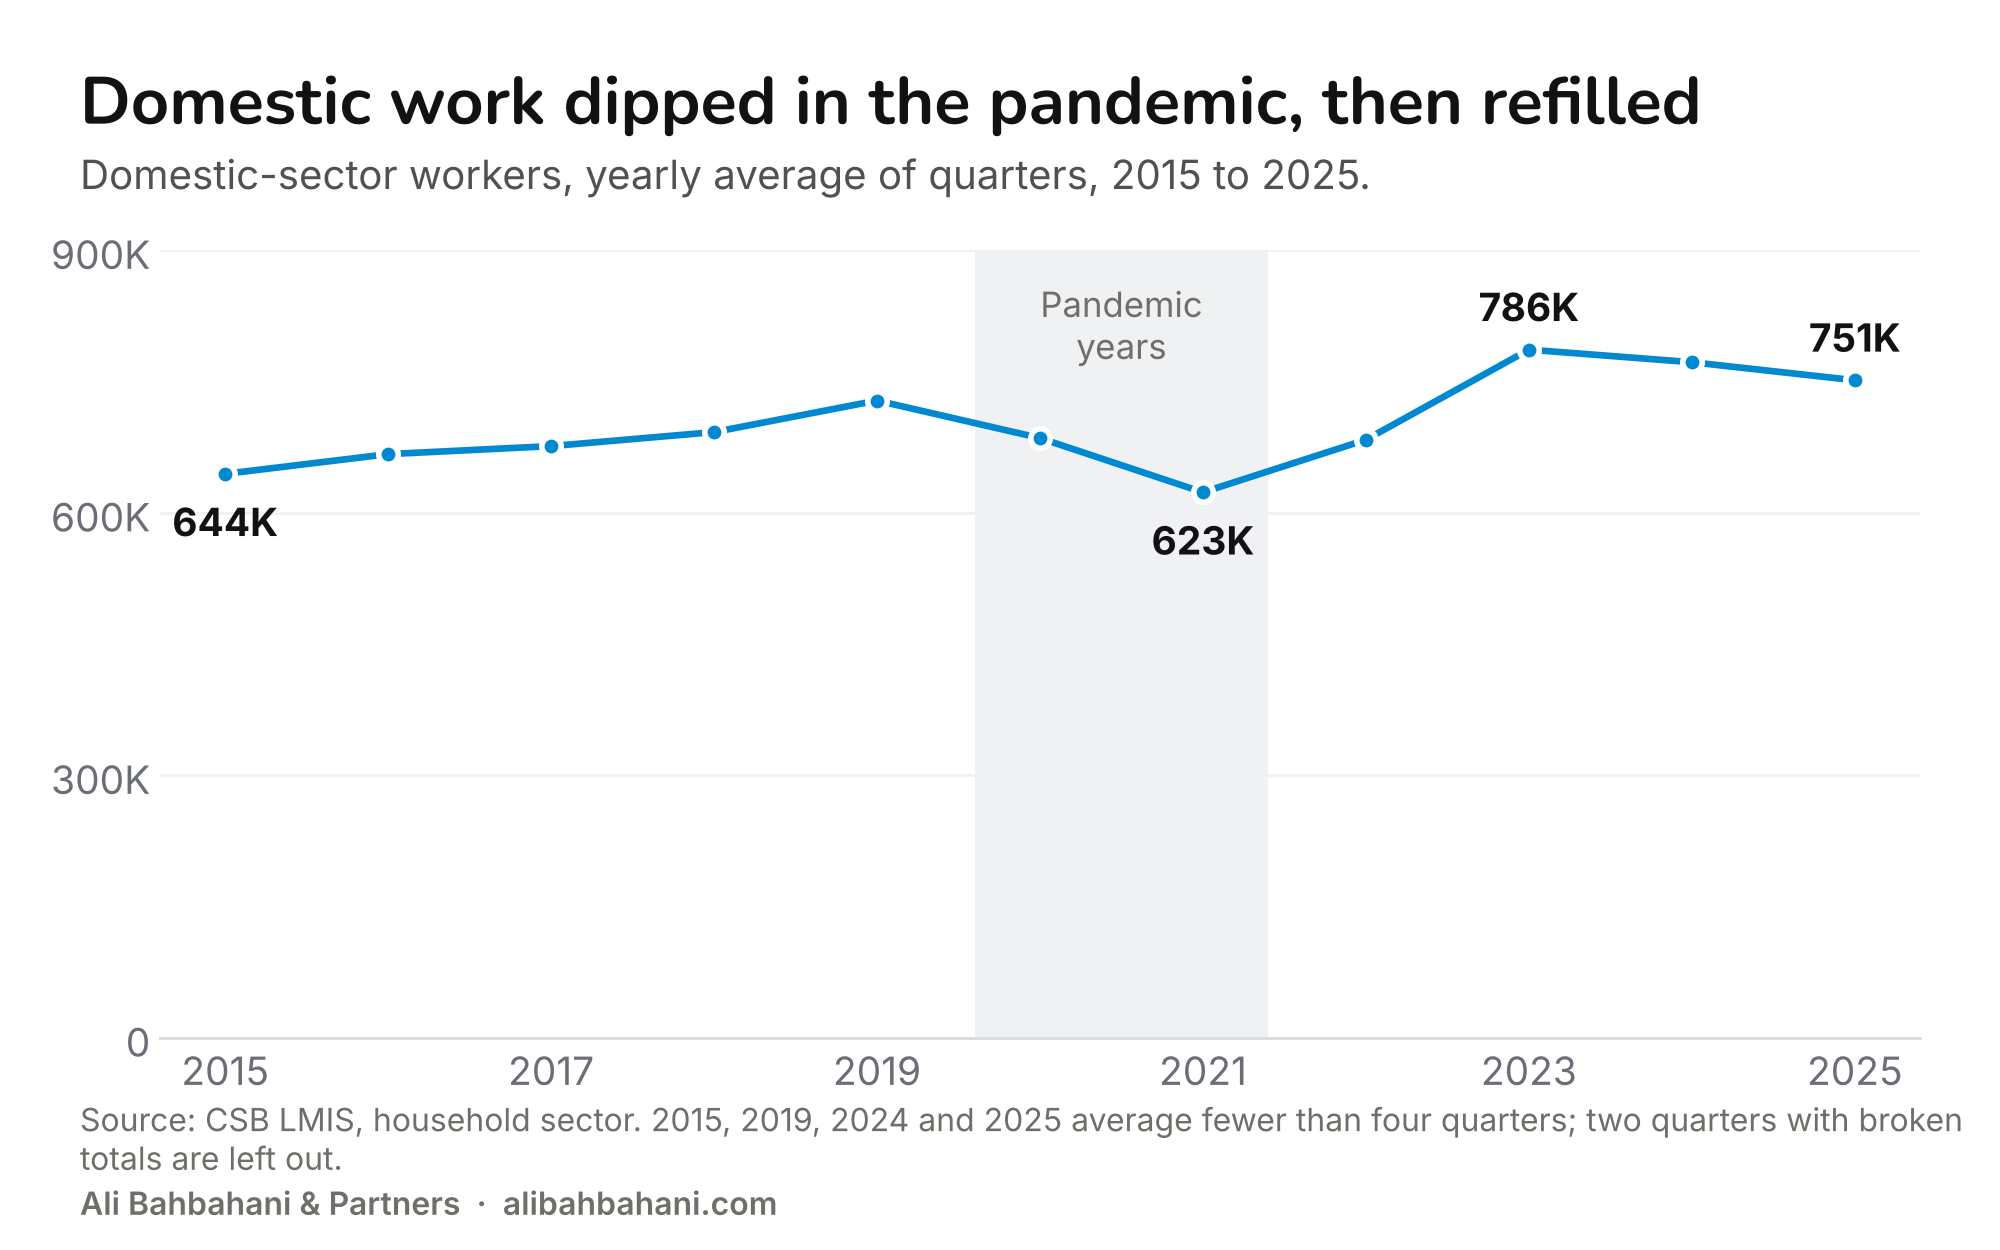
The sector is also more stable than its reputation. The labour-market survey, which counts fewer domestic workers than the register, shows it falling to 623K in 2021, when the pandemic closed borders and stopped recruitment. It refilled within two years to 786K and averaged 751K in 2025.
Now take domestic workers out of the non-Kuwaiti population, age band by age band. Across all non-Kuwaitis there are 1.8 men for every woman. Without domestic workers every band from 25 to 59 sits above 3 to 1, peaking at 3.7 at ages 45 to 49.

The register does not record marital status or who lives with whom, so this says nothing about whether these men are married. It says the adult non-Kuwaiti population outside households is mostly male. That tilts demand toward shared accommodation, canteens and money-transfer services, and away from family flats and schools.
Young cohorts fill up, older ones empty out
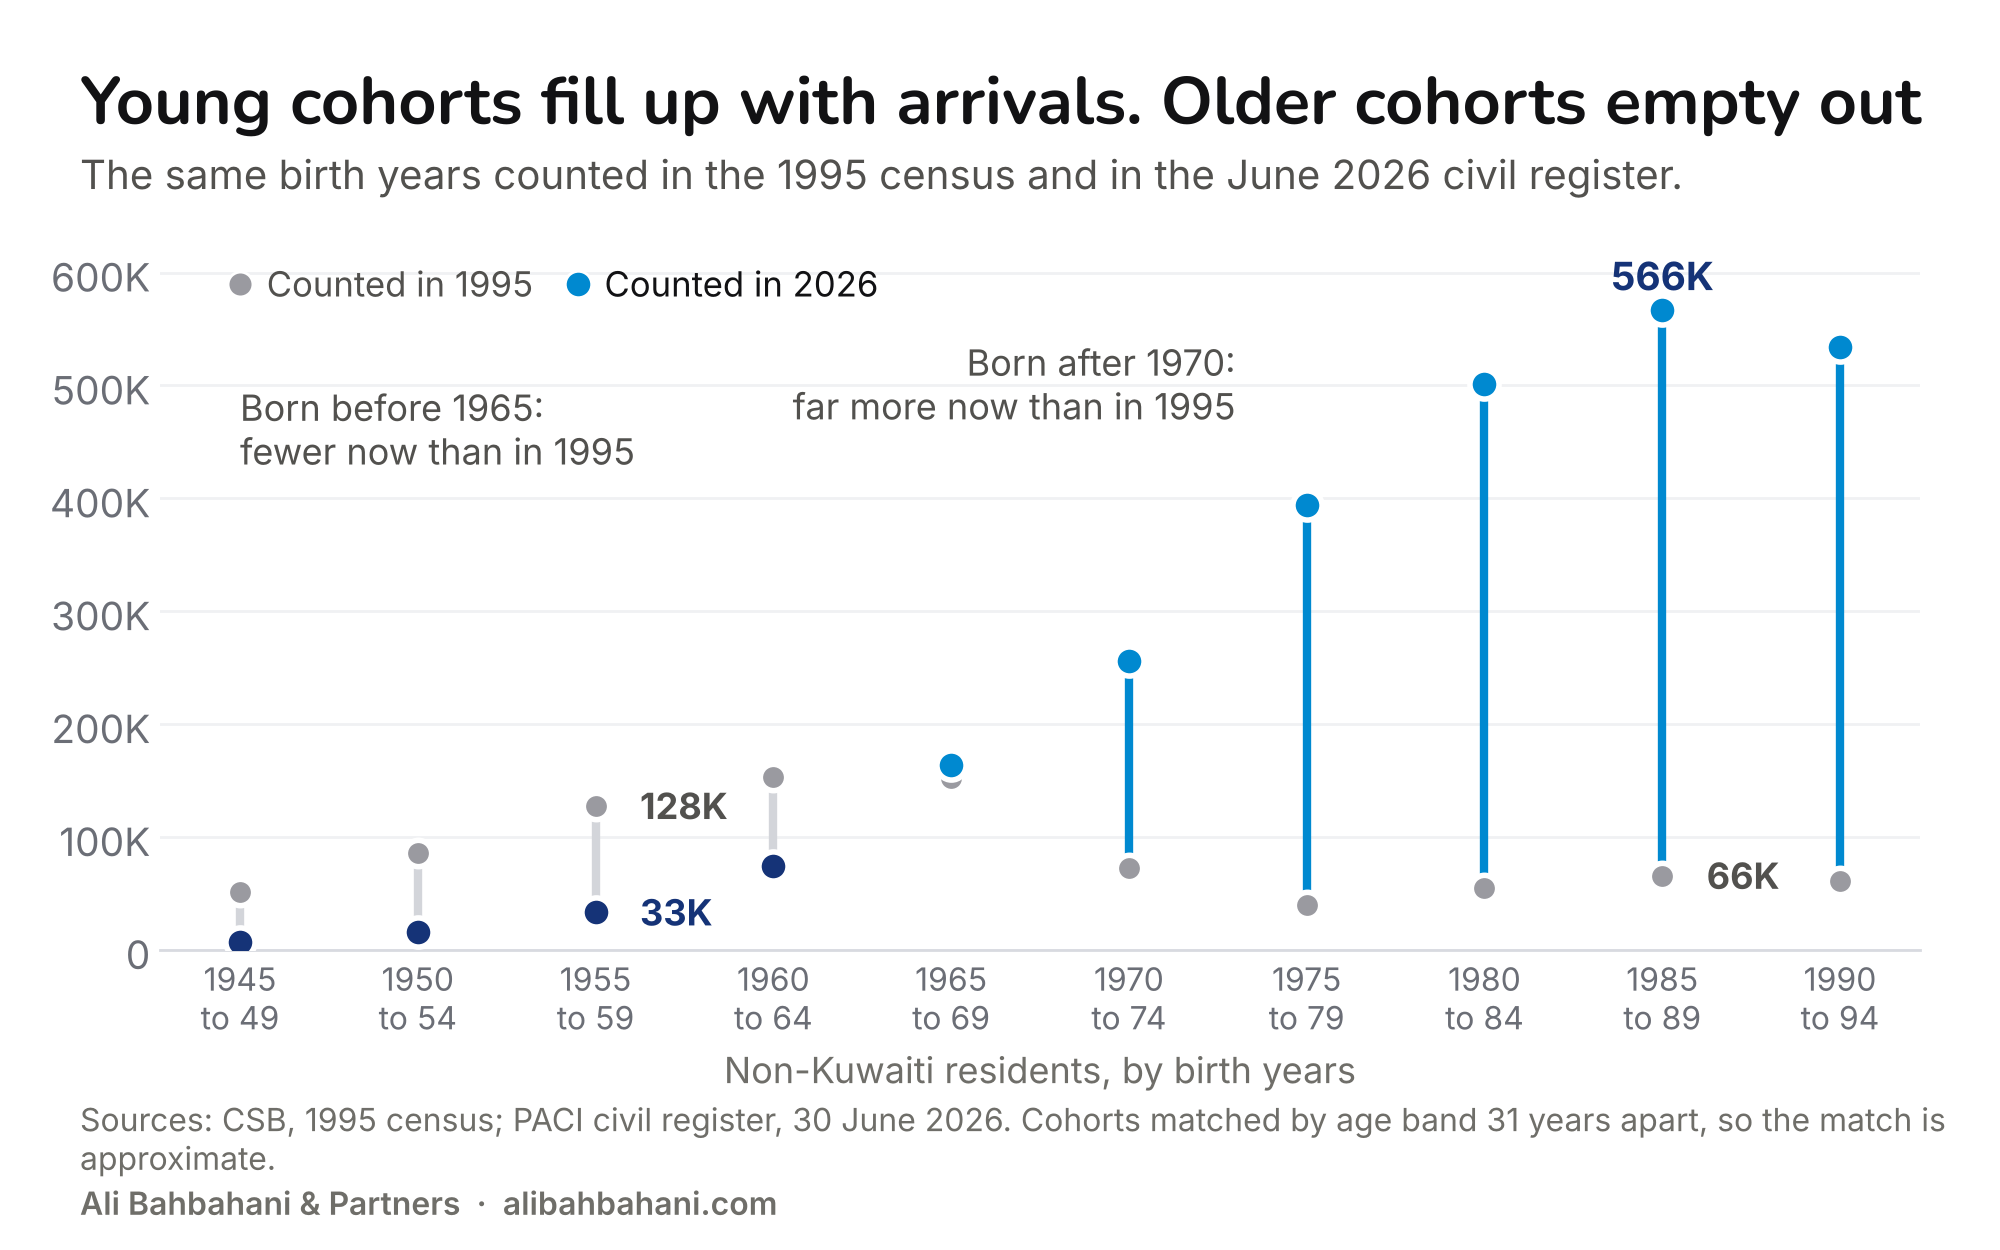
The 1995 census and the 2026 register do not follow the same people. They count everyone born in the same years, 31 years apart, which is enough to see the net movement.
Non-Kuwaitis born from 1985 to 1989 numbered 66K in the 1995 census, when they were children. In the June 2026 register they number 566K. That is a group of birth years, so it differs slightly from the 565K aged 35 to 39 in Figure 4. The count rose by half a million between the two dates, when these people were adults.
The older groups run the other way. Those born from 1955 to 1959 fell from 128K to 33K, a drop of three quarters. Every group born before 1965 is smaller now than it was in 1995. The two sources cannot say how much of that is departure, how much is death, and how much comes from differences in how a census and a register count people.
Whatever the split, few non-Kuwaitis are counted here past 65, as the pyramid in Figure 4 shows. That is a result of how the residence system works, and it has a cost on both sides. Kuwait carries little of the pension or old-age health bill for its largest population group. It also loses decades of local knowledge every year. For what a Kuwaiti life costs the state from birth to 80, see The Kuwaiti Dream, Priced.
Fewer non-Kuwaiti children, a flat line for Kuwaitis
The maternity wards tell a similar story. Non-Kuwaiti births fell from 25.7K in 2015 to 15.7K in 2024, a drop of 39%. Kuwaiti births held near 33K throughout, so the Kuwaiti share of all births rose from 57% to 68%.

The steepest fall came in 2020 and 2021, and non-Kuwaiti births did not recover when borders reopened.
The register confirms it from the other end. Every single age from birth to 17 holds between 31K and 34K Kuwaitis; eighteen years of births sit almost level.
The Kuwaiti line hides its own story. Kuwaiti births climbed from 22.6K in 1990 to 33.9K in 2010. Since then they have moved sideways, between about 31K and 35K a year. Over roughly the same stretch, from 2010 to 2025, the number of Kuwaitis grew 36%.

Marriage records add context without settling the cause. Registered marriages have stayed between 13K and 16K a year since 2008, apart from a spike to 19.9K in 2011, while divorces rose from 4.9K to 8.2K. By 2024 there were 56 divorces for every 100 marriages registered, up from 33. Both series cover all nationalities; 85% of the marriages registered in 2024 involved at least one Kuwaiti. Flat marriages and rising divorces fit flat births, but the data do not show that one causes the other.

A flat count on a growing base means fewer births per person. Births per 1,000 Kuwaitis fell from 36.4 in 1996 to 21.4 in 2024, a drop of about two fifths.
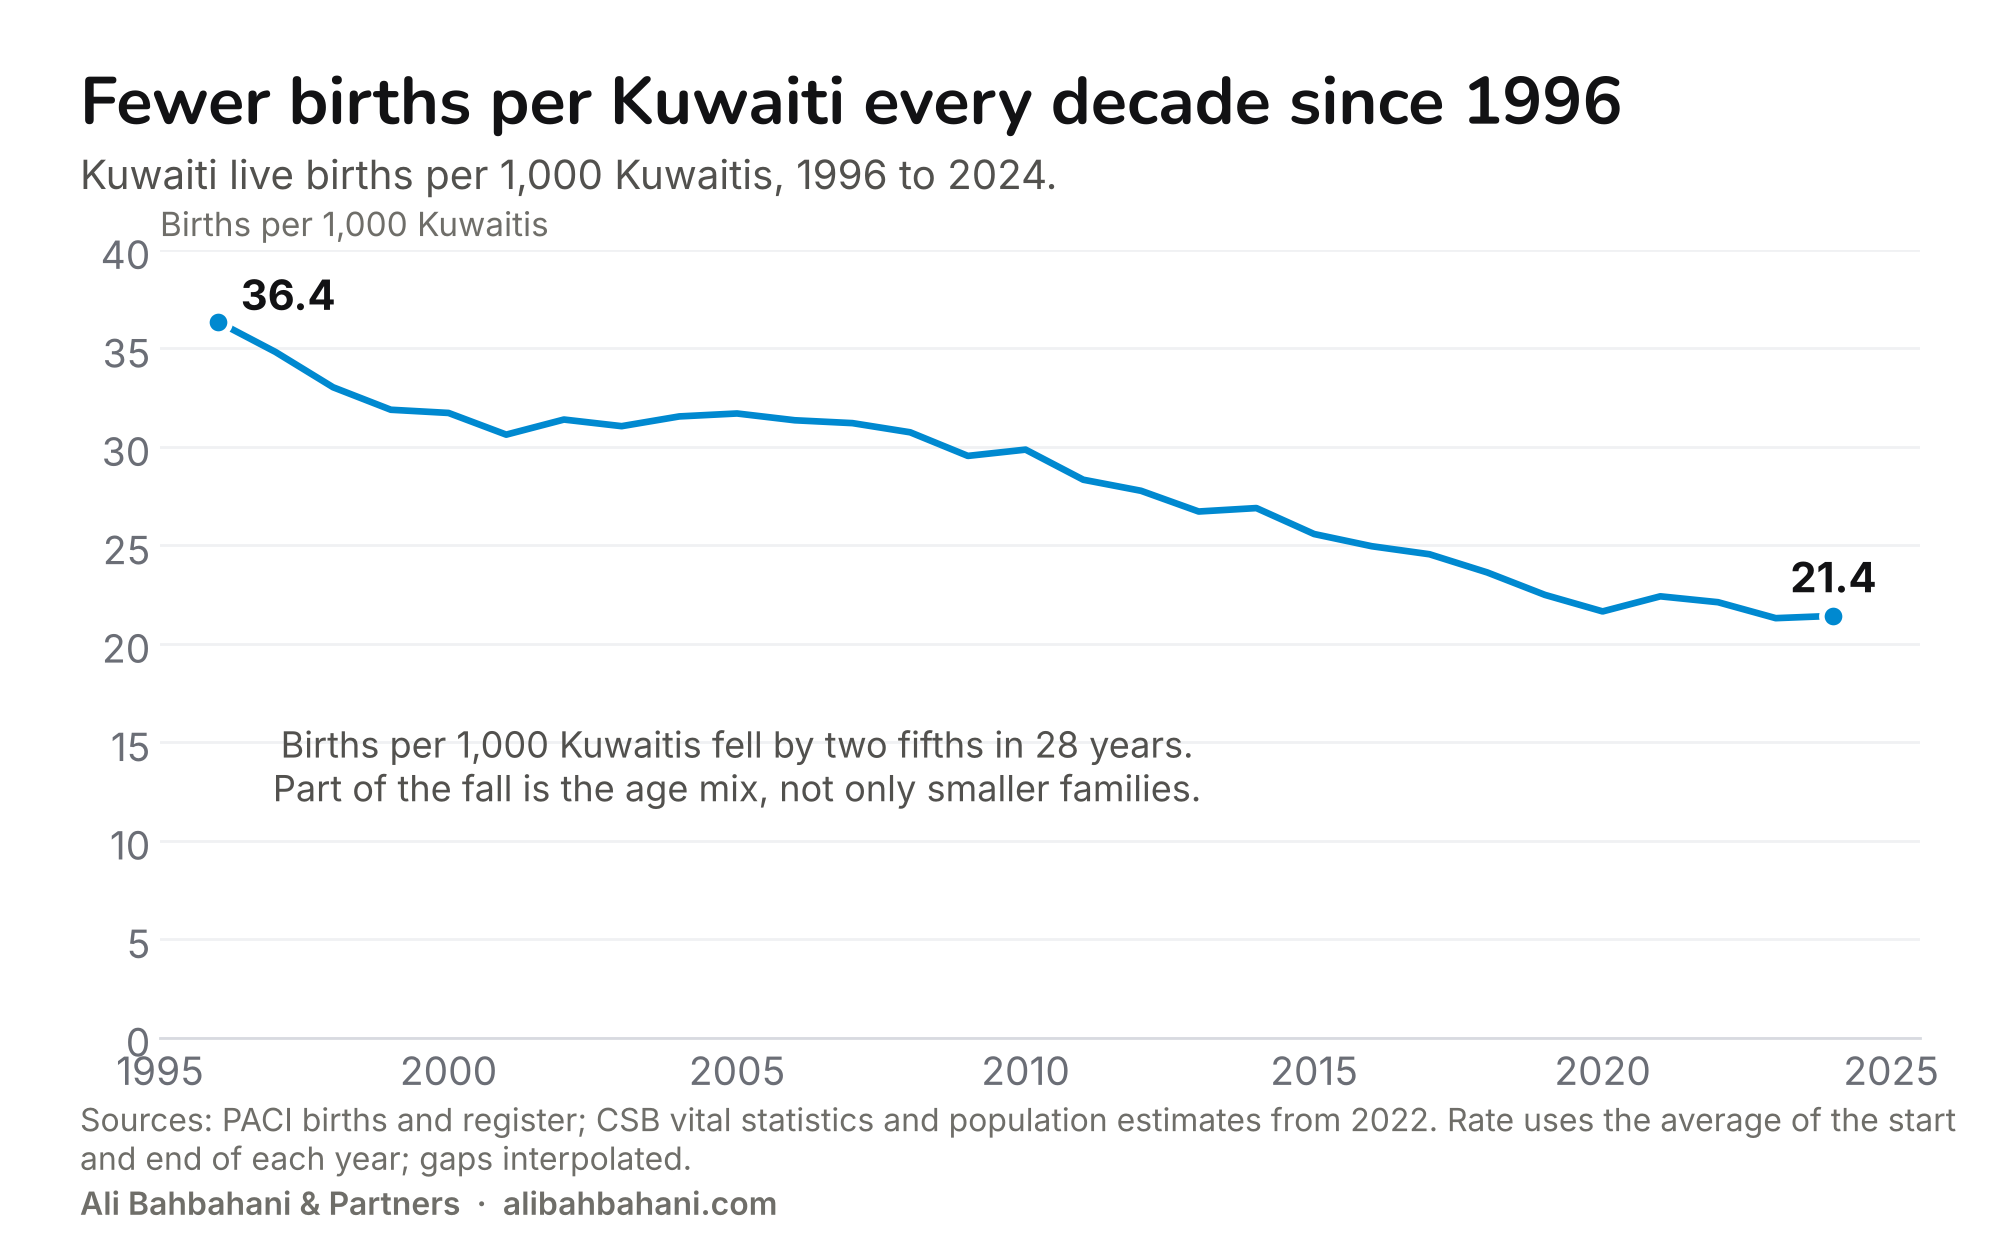
Part of that fall is the age mix: a population with more children who are not yet parents records fewer births per head. On its own it does not prove that Kuwaiti families are getting smaller. The fertility rates published by the World Bank and the UN mix both populations. The most recent Kuwaiti-only estimate I could find comes from the 2018 Kuwait Fertility Survey (Shah and Fargues, Gulf Labour Markets and Migration, 2021). A current official rate by nationality would settle the question, and anyone planning schools or housing needs one.
The next generation is already here
Generations differ in length, so comparing their totals misleads. Kuwaitis born 1997 to 2012 (Gen Z) span sixteen birth years and number 473K. Those born 2013 to 2024 span twelve and number 391K. That 2013 to 2024 grouping is this article's own: it starts where Pew Research ends Gen Z, and ends where McCrindle, which coined the term Gen Alpha, ends it. McCrindle starts Gen Alpha in 2010.
Per birth year the order flips. Each birth year from 2013 to 2024 holds 32.6K Kuwaitis on average, against 29.6K for 1997 to 2012 and fewer for every earlier group. Deaths thin the older groups, so the gradient overstates how much smaller earlier cohorts were at birth. Non-Kuwaitis peak in the Millennial years, at 106K per birth year.
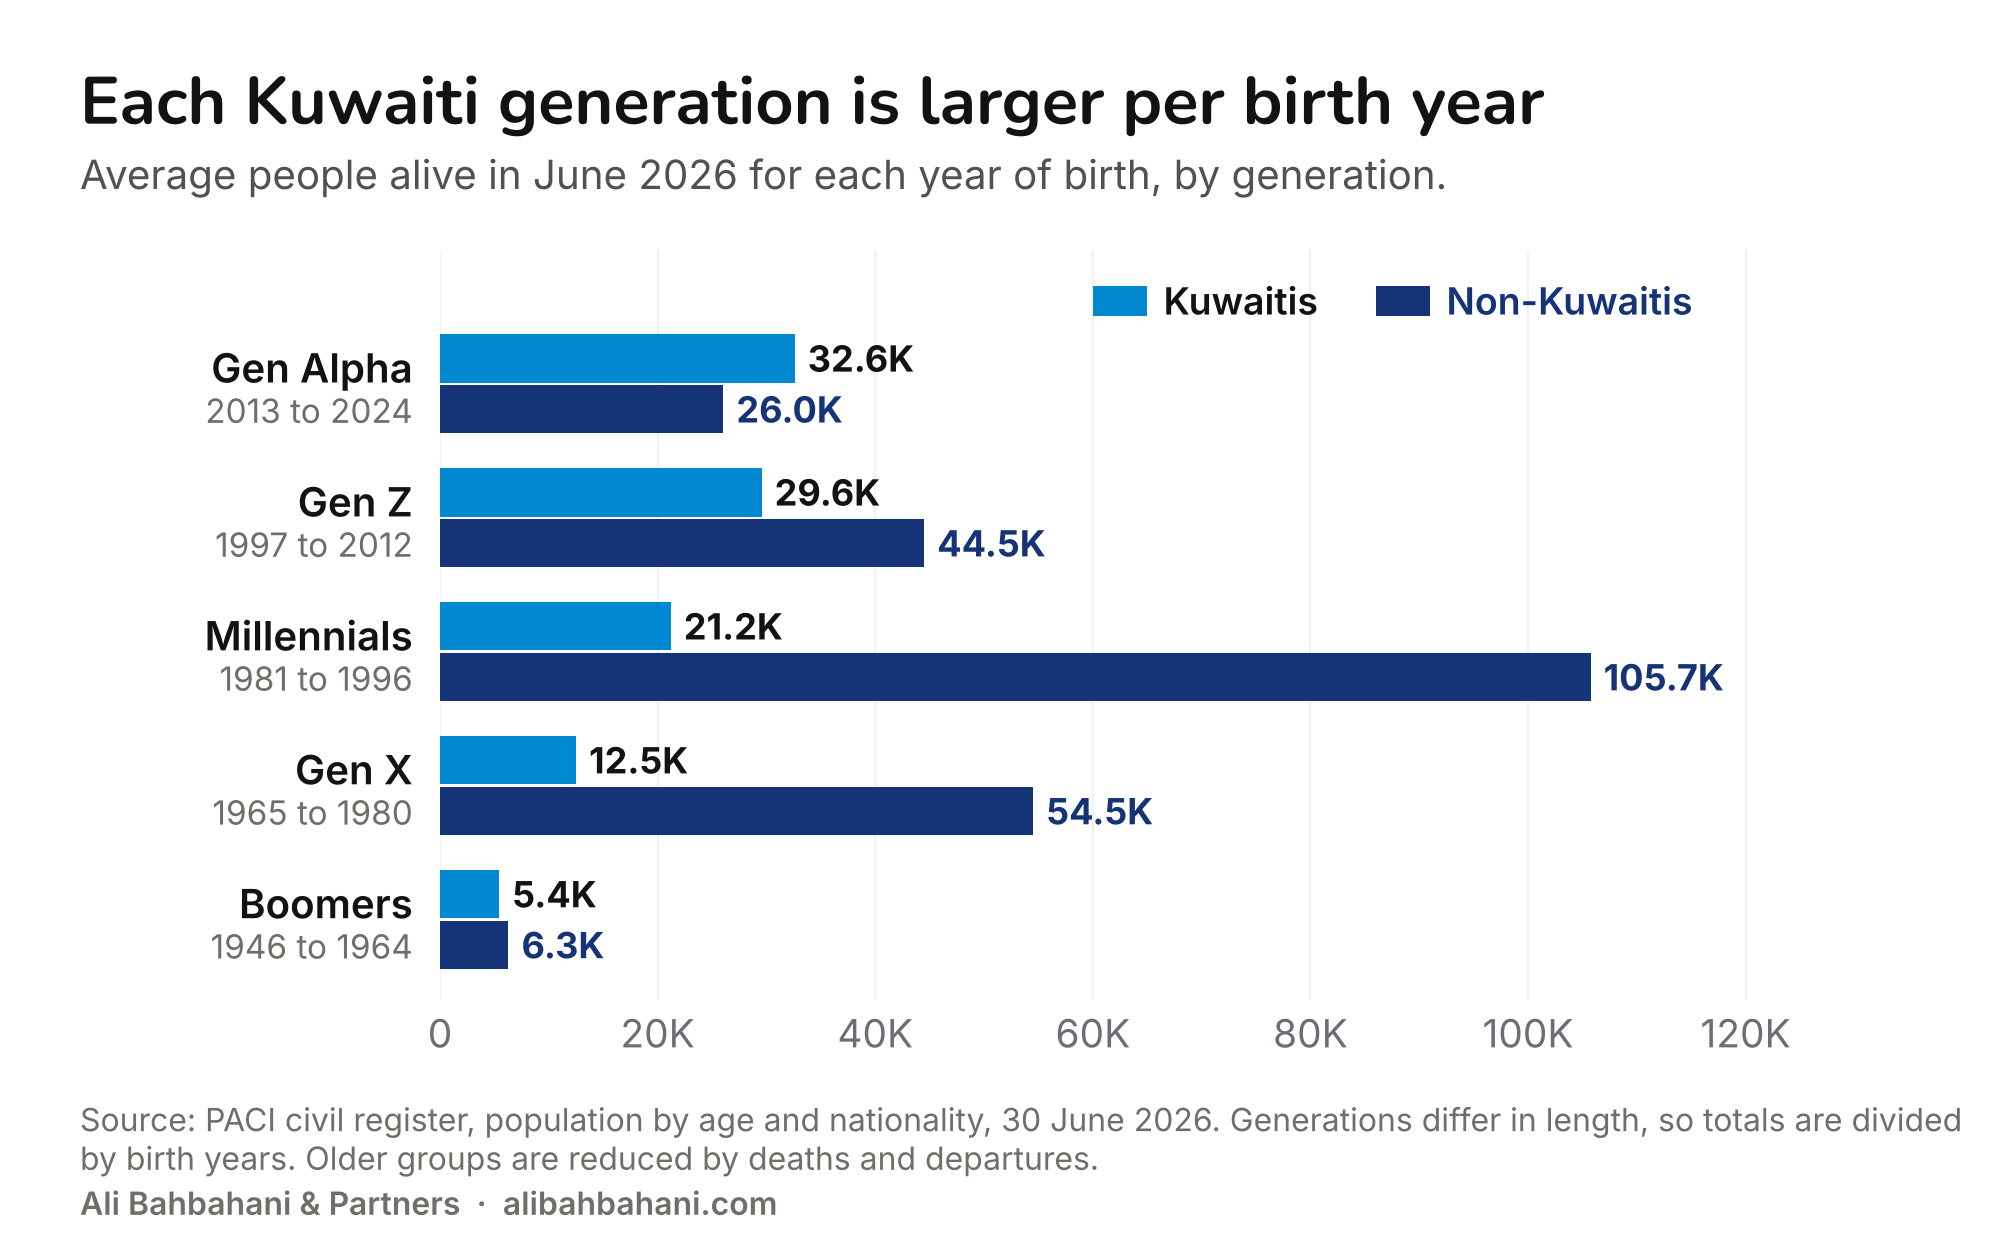
So each year of Kuwaiti children now in school is as large as any before it, and flat births since 2010 mean the cohorts behind them are about the same size. That is a starting point for planning, not a forecast. A birth cohort of 32K to 34K does not mean that many school places, first jobs or first homes: enrolment depends on school choice, jobs on the economy, and homes on marriage, household formation and the housing queue. What the cohorts rule out is a shrinking pipeline. The private-housing market I wrote about in Fewer Deals, Bigger Cheques will see young Kuwaitis come of age at a steady rate, not a falling one.
Where the money goes
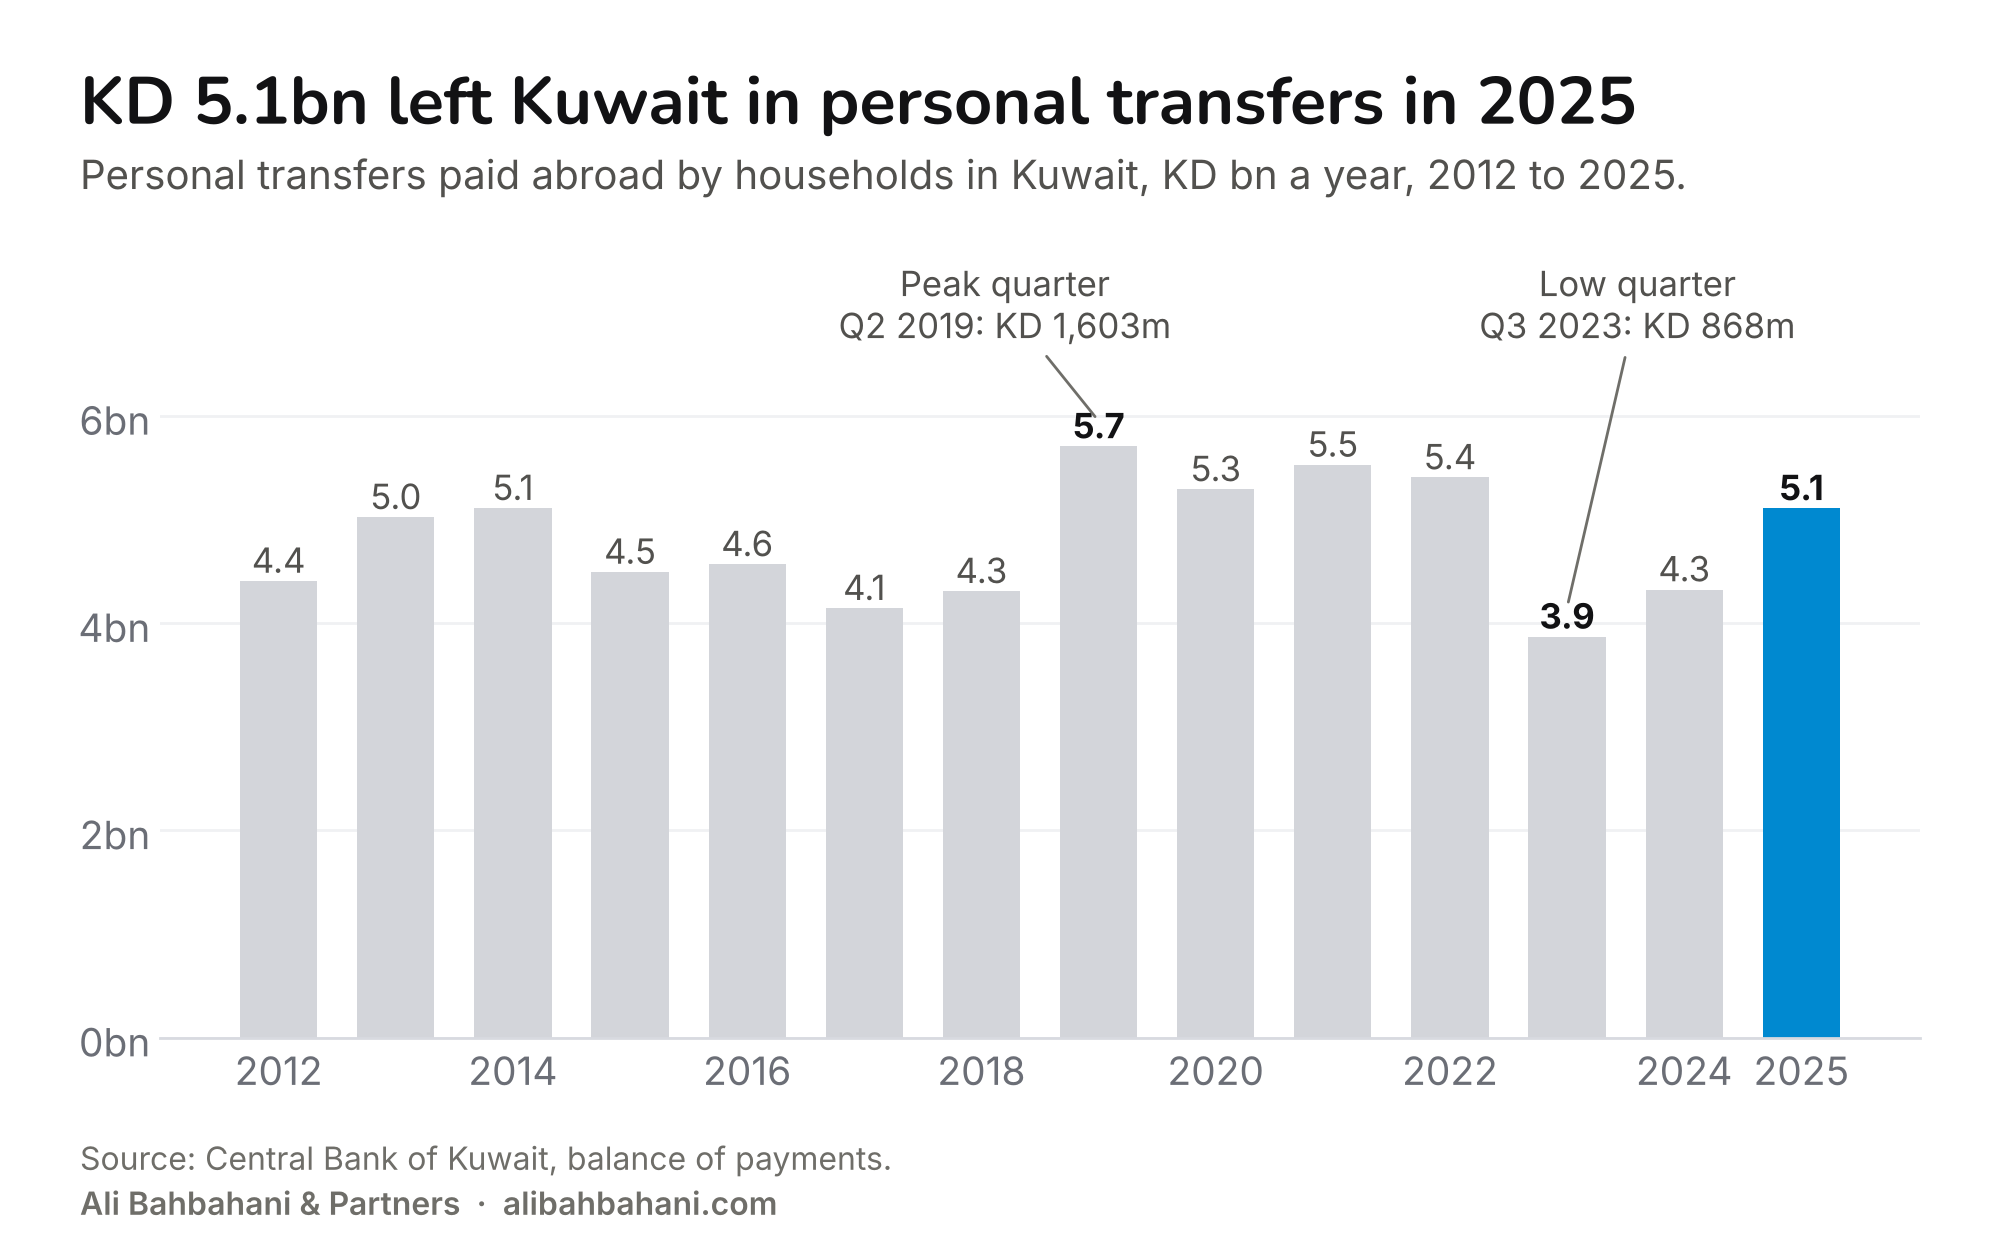
Much of what non-Kuwaiti workers earn leaves the country. The Central Bank of Kuwait records the outflow in the balance of payments as personal transfers paid abroad. Under the IMF definition this covers all current transfers from households in Kuwait to households abroad, so it is broader than wages sent home.
From 2012 to 2025 that outflow ran between KD 3.9bn and KD 5.7bn a year. The high was 2019, the low 2023. The single largest quarter was Q2 2019, at KD 1,603m. The smallest was Q3 2023, at KD 868m. 2025 closed at KD 5.1bn.
That outflow can move fast. In the first quarter of 2026, when the regional war closed Kuwait's airport, exchange-house currency sales nearly doubled on a year earlier. I covered that in Kuwait Absorbed a War in March.
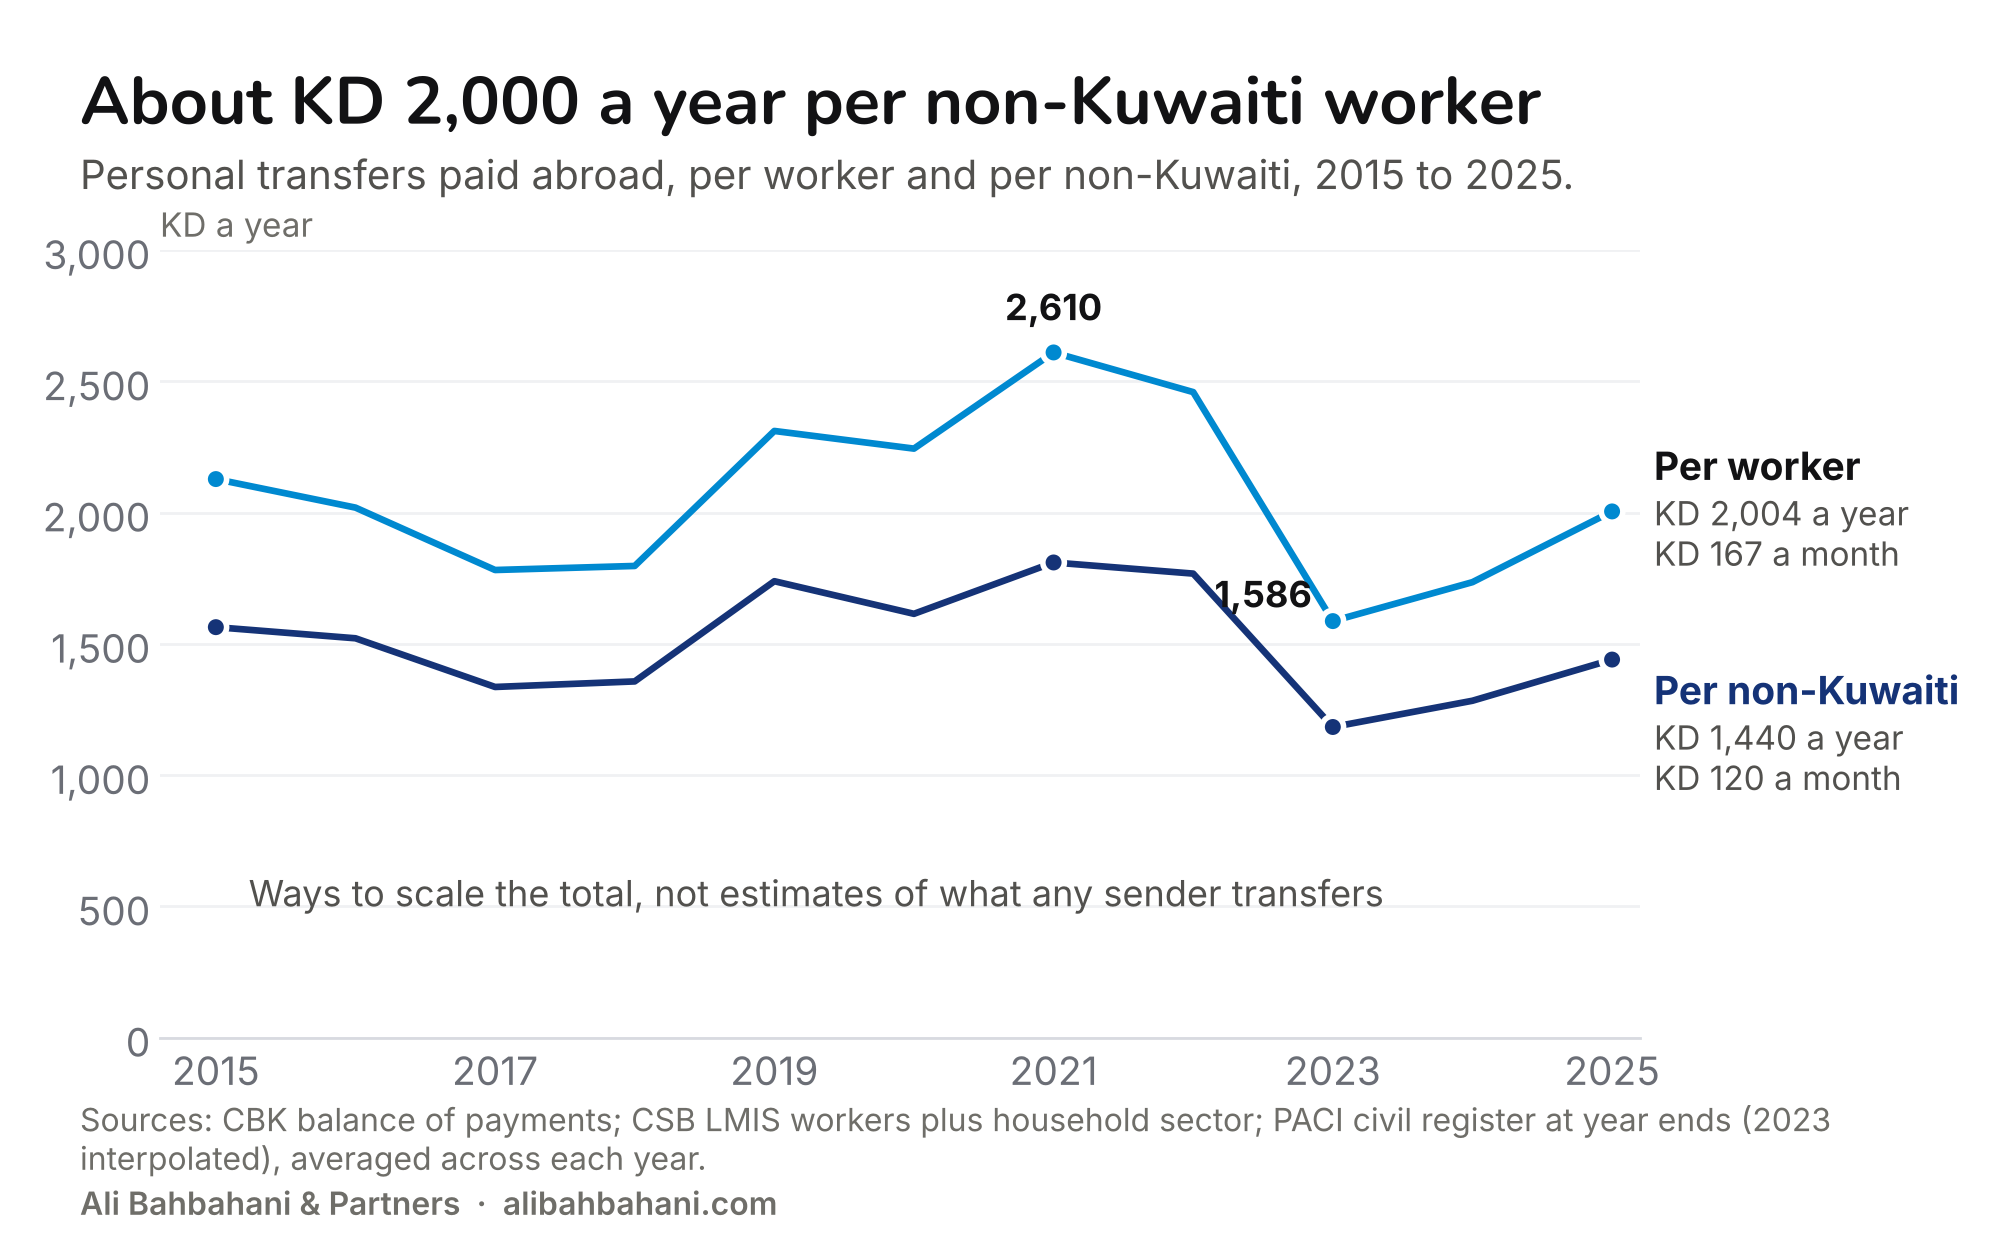
Divide the annual outflow by population and it becomes easier to picture.
- Per worker: transfers over all non-Kuwaiti workers, domestic workers included. In 2025 that was KD 2,004 a year, or KD 167 a month.
- Per non-Kuwaiti: transfers over every non-Kuwaiti on the civil register, children included. In 2025 that was KD 1,440 a year, or KD 120 a month.
Neither figure estimates what a typical sender transfers; the data do not identify the senders, and the total includes household transfers beyond wages. Use them to scale the flow, not to describe a person. Both peaked in 2021 and fell hard in 2023.
Money does not follow headcount
Index both series to 2015 and they part ways. Workers rose steadily to 121 by 2025, with one dip back to 100 in 2021. Transfers jumped to 127 in 2019, sat at 123 in 2021 while the workforce was at its smallest, fell to 86 in 2023 while workers rose, and recovered to 114.
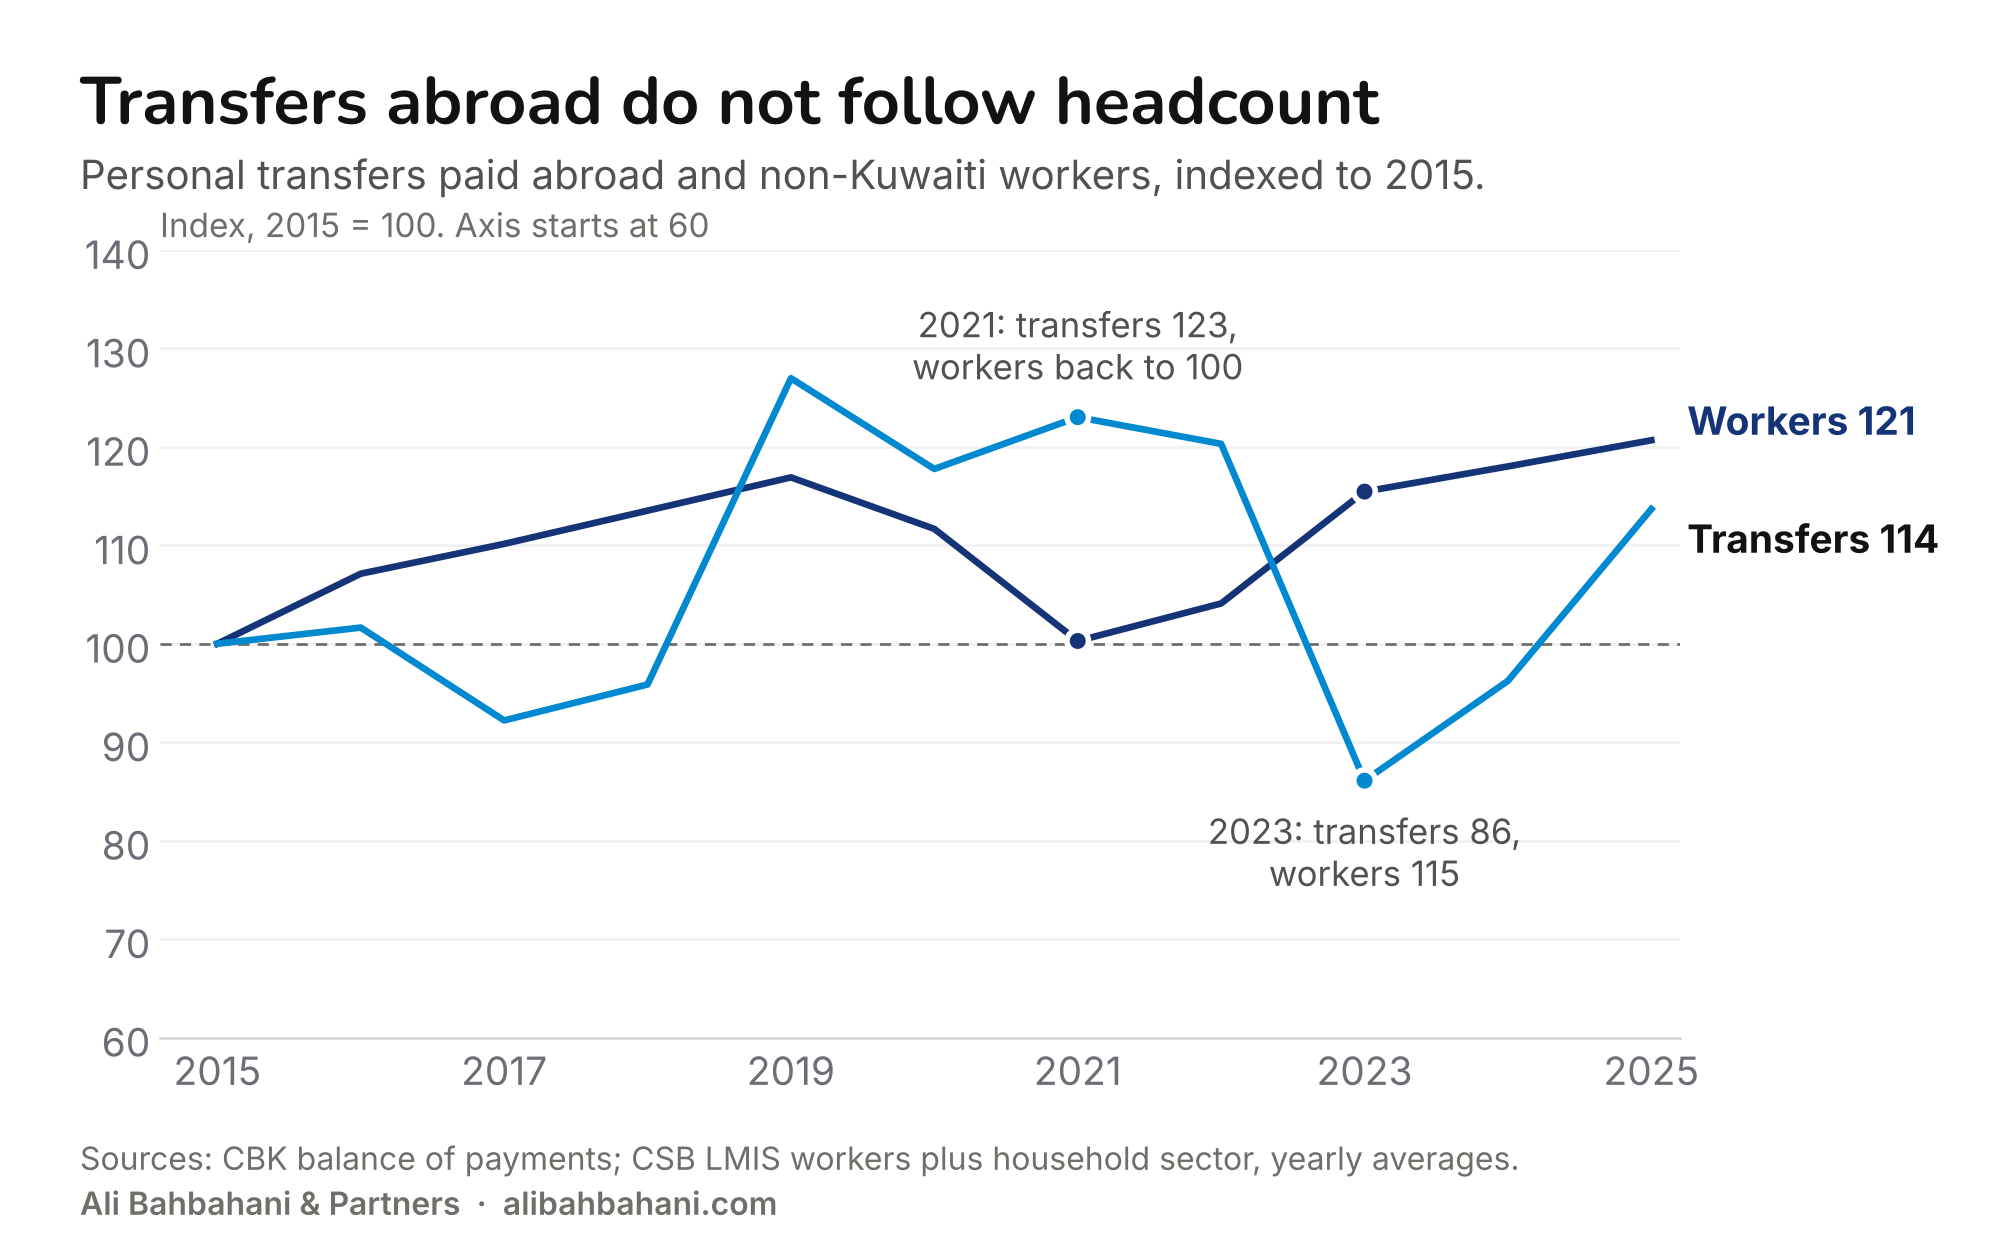
Worker numbers alone are a weak guide to outflows. One plausible reading of 2021 is that workers who left sent their savings home on the way out. The 2023 trough could reflect pay, or money moving through channels the balance of payments does not capture. The data cannot tell those stories apart, so treat both as questions.
One country, two life cycles
Side by side, Kuwait runs two population systems with different drivers.
- Median age. Kuwaitis: 24.6. Non-Kuwaitis: 37.3.
- What sets the numbers. Kuwaitis: Births, flat near 33K a year. Non-Kuwaitis: Hiring and permit rules.
- Families. Kuwaitis: 58% born in 1997 or later. Non-Kuwaitis: 32 dependant permits per 100 work permits.
- Work. Kuwaitis: 86% of workers in government. Non-Kuwaitis: 64% private sector, 32% domestic.
- Births. Kuwaitis: 68% of all births. Non-Kuwaitis: Down 39% since 2015.
- Life cycle. Kuwaitis: Born here, age here. Non-Kuwaitis: Most arrive as adults; older groups shrink sharply.
- Money. Kuwaitis: Not measured here. Non-Kuwaitis: KD 5.1bn in transfers abroad, 2025.
Schools, first jobs and housing are mostly a Kuwaiti question for the next decade, shaped by births that have already happened. Labour supply, accommodation and the outflow of money are a permit question. They move when the rules move, and they can move within a year.
A market sized on "Kuwait's population" mixes a young citizen market of 1.57M with a non-Kuwaiti population of 3.74M that skews male and adult and turns over fast. Those are two customer bases with different needs, spending and horizons. The CEO's guide to Kuwait and our earlier look at Kuwait's ecological and population challenges start from the same split.
If you are sizing a market, planning a site or building a workforce model in Kuwait, these two populations need separate assumptions. That is the work we do in feasibility and growth strategy at Ali Bahbahani & Partners. Get in touch if you want the numbers run for your sector.
Method and data notes
- Population by age, nationality, sex and work status: PACI civil register, Population and Labor Force table, reference date 30 June 2026 (downloaded 20 November 2026). The register counts 5.31M people, more than CSB's population estimates, which put non-Kuwaitis about 0.4M lower; the two sources should not be mixed. The 36% growth in Kuwaitis compares the PACI register for 2010 and 2025.
- Medians and generations: medians from single years of age. Groups are defined by birth years, with generation names as shorthand: 2025 on (Gen Beta), 2013 to 2024 (Gen Alpha), 1997 to 2012 (Gen Z), 1981 to 1996 (Millennials), 1965 to 1980 (Gen X). The 2013 start follows Pew Research's end of Gen Z; the 2024 end follows McCrindle, which defines Gen Alpha as 2010 to 2024. Definitions vary, so the birth years are the reliable labels. Someone aged a on 30 June 2026 was born in 2025 minus a or 2026 minus a, so each age is split evenly between the two birth years. Per-birth-year figures divide each generation's total by its number of birth years.
- Work status: as recorded in the register. "Government works", "Non-Government" and "Domestic Servants" are counted as employed. About 549K Kuwaitis and 559K non-Kuwaitis have no work status recorded, mostly children.
- Permits: CSB Migration Statistics Bulletin 2025, valid residence permits by article of the residence law. Permit counts and population counts come from different systems and do not match exactly. The dependant ratio divides family-dependant permits by private, government and self-employed work permits; it counts permits, not households.
- Domestic workers: by age and sex from the PACI register (883K). The 2015 to 2025 trend uses the CSB Labour Market Information System (LMIS) household sector, which counts fewer domestic workers (751K in 2025); yearly figures average the available quarters, and two quarters with broken totals (Q4 2024 and Q3 2025) are left out.
- 1995 cohorts: 1995 census, non-Kuwaitis by age, matched to the five ages 31 years older in the June 2026 register. These are net counts of birth years, not the same individuals; the change mixes arrivals, departures, deaths and differences in coverage between a census and a register, and the match is approximate.
- Births: PACI births to 2021, CSB vital statistics from 2022; the nationality split for 2015 to 2024 uses CSB vital statistics throughout. Births per 1,000 Kuwaitis use the average Kuwaiti population at the start and end of each year, with missing years interpolated.
- Marriages and divorces: CSB vital statistics, authenticated marriage cases by nationality of groom and bride (2020 to 2024 table, 2024 bulletin) and yearly marriage and divorce totals. Rates per 1,000 use a mid-2024 population: Kuwaitis interpolated between the PACI end-2022 and end-2025 counts, non-Kuwaitis the average of end-2023 (interpolated) and end-2024. Marriages contracted outside Kuwait are not in these records.
- By year of birth: each single age is shown at birth year 2025 minus age; people aged 81 and over are shown as a yearly average. Generation totals in that chart exclude people born before 1946.
- Transfers abroad: Central Bank of Kuwait balance of payments, personal transfers paid (BPM6), as published. Workers are CSB LMIS non-Kuwaiti workers plus the household sector, yearly averages. Non-Kuwaitis are the PACI register, averaged across each year (end-2023 interpolated; end-2024 as published by PACI). The index chart starts its axis at 60, as marked on the chart.
All figures were drawn from the Ali Bahbahani & Partners Kuwait statistics warehouse, which holds these official tables as published.
Related reading
- The Kuwaiti Dream, Priced: One Life Costs KD 4.13 Million
- Kuwait Absorbed a War in March: What the Data Shows
- Kuwait's 2025 Expat Health Insurance Reform: What the Numbers Tell Us
- Fewer Deals, Bigger Cheques: Kuwait Real Estate 2025
- Kuwait Airport Data: 16 Years of Airlines Data, Measured
- Kuwait's Payment Revolution in 2025
Sources
- Central Statistical Bureau: population estimates, vital statistics, Migration Statistics Bulletin 2025, Labour Market Information System, 1995 census
- Public Authority for Civil Information: civil register (population by age, nationality, sex and work status, 30 June 2026) and births to 2021
- Central Bank of Kuwait: balance of payments releases
- IMF, BPM6 frequently asked questions: definition of personal transfers
- McCrindle, Gen Alpha and Gen Beta definitions: generation birth-year ranges
- Shah and Fargues, Kuwait Fertility Report (GLMM, 2021): Kuwait Fertility Survey 2018