Kuwait Car Sales Fell 22% in H1 2026. The War Explains Less Than You Think
.webp)
The Strait of Hormuz closed to normal traffic on 28 February 2026. Car carriers are among the least adaptable ships afloat. They cannot part-unload, they cannot wait cheaply, and they cannot be replaced by a container slot. Vehicles bound for Kuwait discharged at Jeddah, Sohar and Fujairah instead and finished the trip on a truck.
Every dealer in Kuwait got the same phone call in the same week.
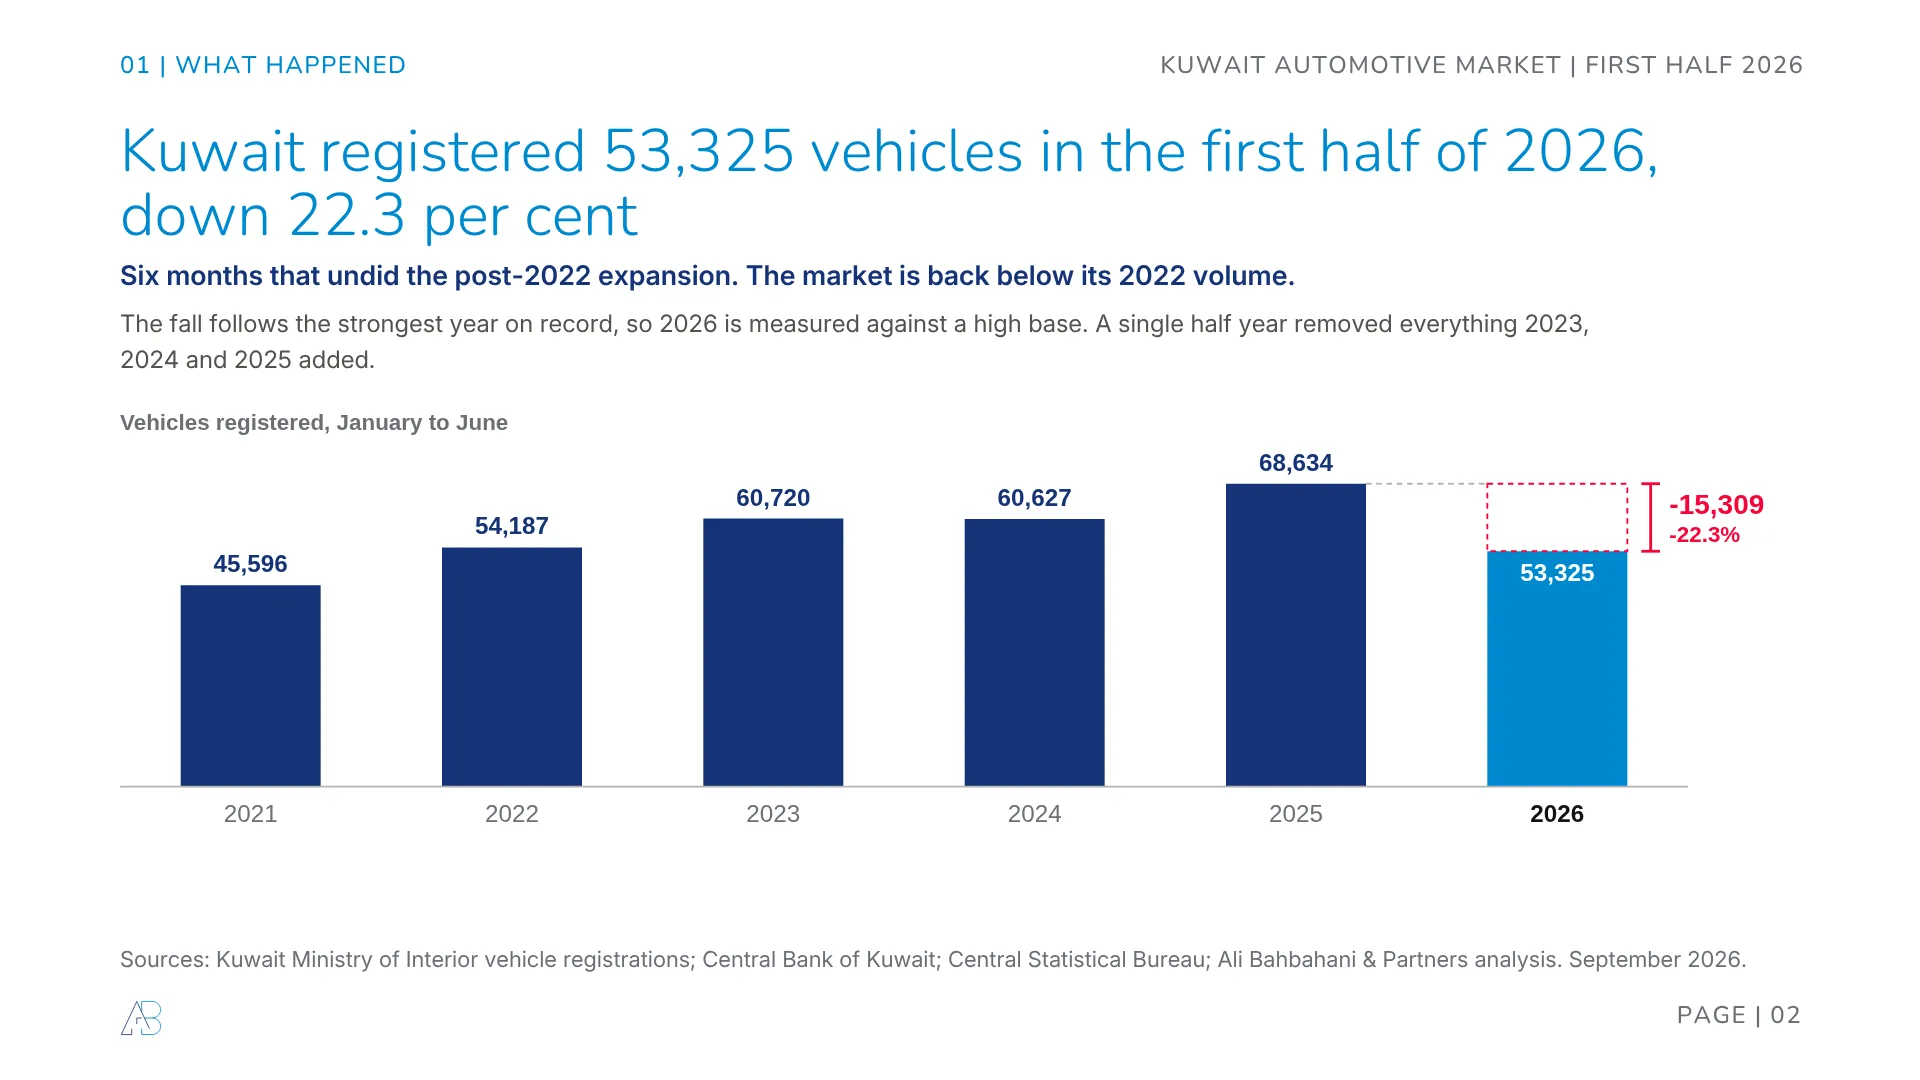
Kuwait registered 53,325 vehicles in the first half of 2026, down 22.3 per cent and 15,309 units on the same six months of 2025. That is the weakest half year since 2021, and it landed immediately after the strongest full year the market has ever recorded. Six months erased what 2023, 2024 and 2025 had added.
So the war did it. That is the version you will hear at every dealer meeting in Kuwait this autumn, and we will show you the evidence for it, because it is real and it is large. Then we will show you what it does not explain, which is most of what will still be true in 2028.
Here is the whole thing in six lines.
- 53,325 registrations, down 22.3 per cent and 15,309 units, the weakest half since 2021 and straight after the strongest year on record.
- The shock looks like supply, not household weakness. Vehicle imports fell 73 per cent in March. Card spending inside Kuwait held. April and May were worse than March.
- An estimated 10,815 registrations went missing between March and June. If shipping was the constraint, much of that should return in the second half.
- China passed Japan for the first time, 37.3 per cent against 36.1. Every brand that added 50 vehicles or more this year is Chinese.
- Toyota is 48 per cent of the entire decline. It walked into March already down 22 per cent, then lost 40 points of growth. Half of that reverses with the ships. Half does not.
- The market is now the most fragmented it has been since 2021. That is the change no shipping recovery undoes.
- The size and shape of the fall
- What the war actually did
- Follow the credit and the customs record
- China passed Japan
- Toyota is two problems, not one
- Down a size and out of luxury badges
- What holds, and the two numbers to watch
What the registration file cannot show you
Before the data, three things we know from sitting on the other side of it, none of which appear in any government table.
War risk insurance is running up to KD 600 a car. Not per container, not per booking. Per vehicle. On a KD 12,000 car that is five per cent of the retail price added before anything else moves, and it does not sit neatly in either the importer’s margin or the buyer’s price. Somebody eats it, and mostly it has been the distributor, which is why you have not seen list prices jump to match.
The wait for a sailing slot went from about a month to about three months, and the slots are smaller. This is the part the customs numbers hide. Kuwait did not simply wait longer for the same cars. It waited three times as long for fewer cars per sailing, which is a compounding constraint, not a delay. It is also why the recovery, when it comes, will arrive in lumps rather than as a clean curve.
Right now, forecasting a 2027 volume is close to guesswork. We would not put weight on any number anyone gives you for next year, including one of ours. The honest position is that the shape of the recovery depends on a shipping lane nobody in this industry controls, and the correct response to that is to plan in ranges and watch one or two leading indicators rather than to defend a point estimate. We name those two indicators at the end.
The size and shape of the fall
Kuwait registered 45,596 vehicles in the first half of 2021 and 68,634 in the first half of 2025. That run was the story we told in our 2025 market review and, over a longer window, in the 2013 to 2024 decade study. The 2026 half year sits at 53,325, below 2022.
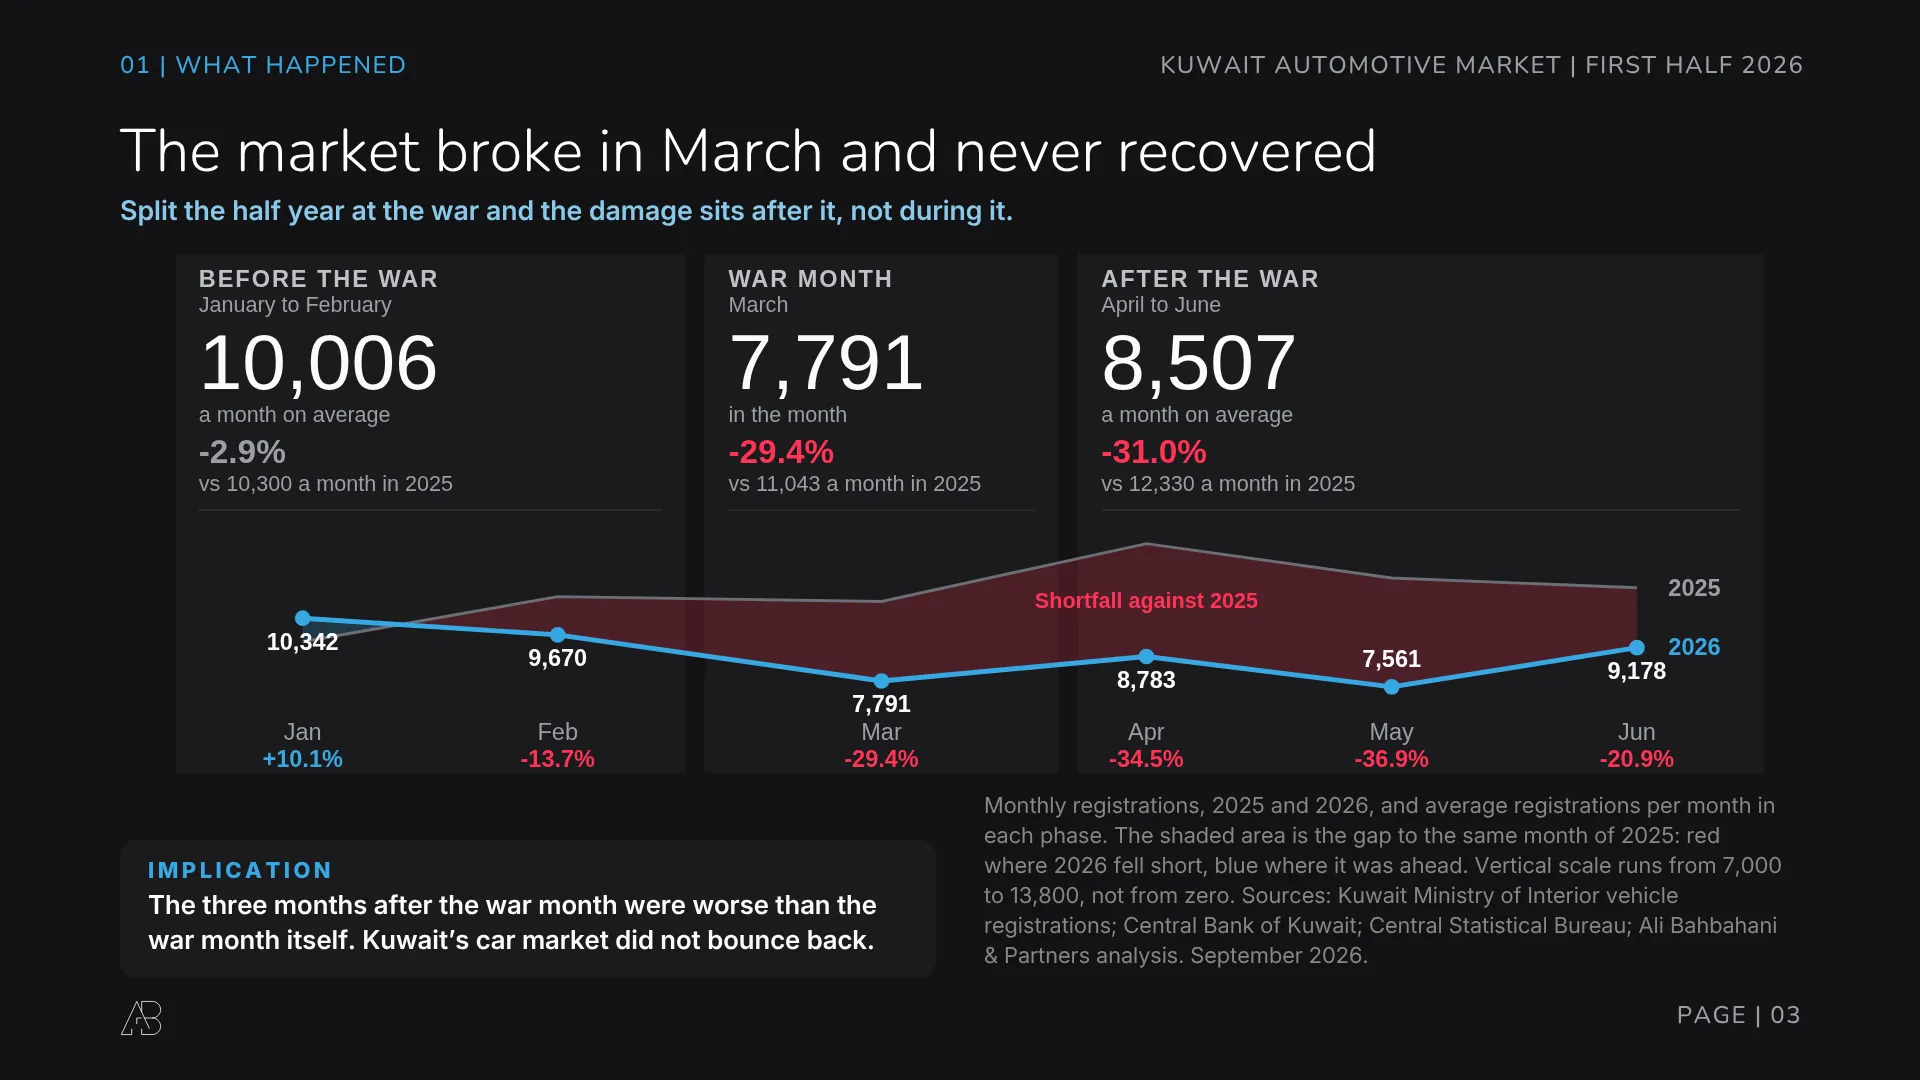
The monthly sequence matters more than the total, because it separates a market that stopped buying from a market that stopped receiving.
January 2026 was the strongest January Kuwait has ever recorded: 10,342 vehicles, up 10.1 per cent. February gave some back at 9,670. Then March fell 29.4 per cent, April 34.5 and May 36.9. June recovered to a fall of 20.9.
Read that sequence twice. The three months after the war month were worse than the war month. Registrations averaged 8,507 a month from April to June against 12,330 a year earlier, a fall of 31.0 per cent. Whatever hit the market in March was still hitting it in May. A three month wait for a sailing slot would produce exactly that shape.
What the war actually did
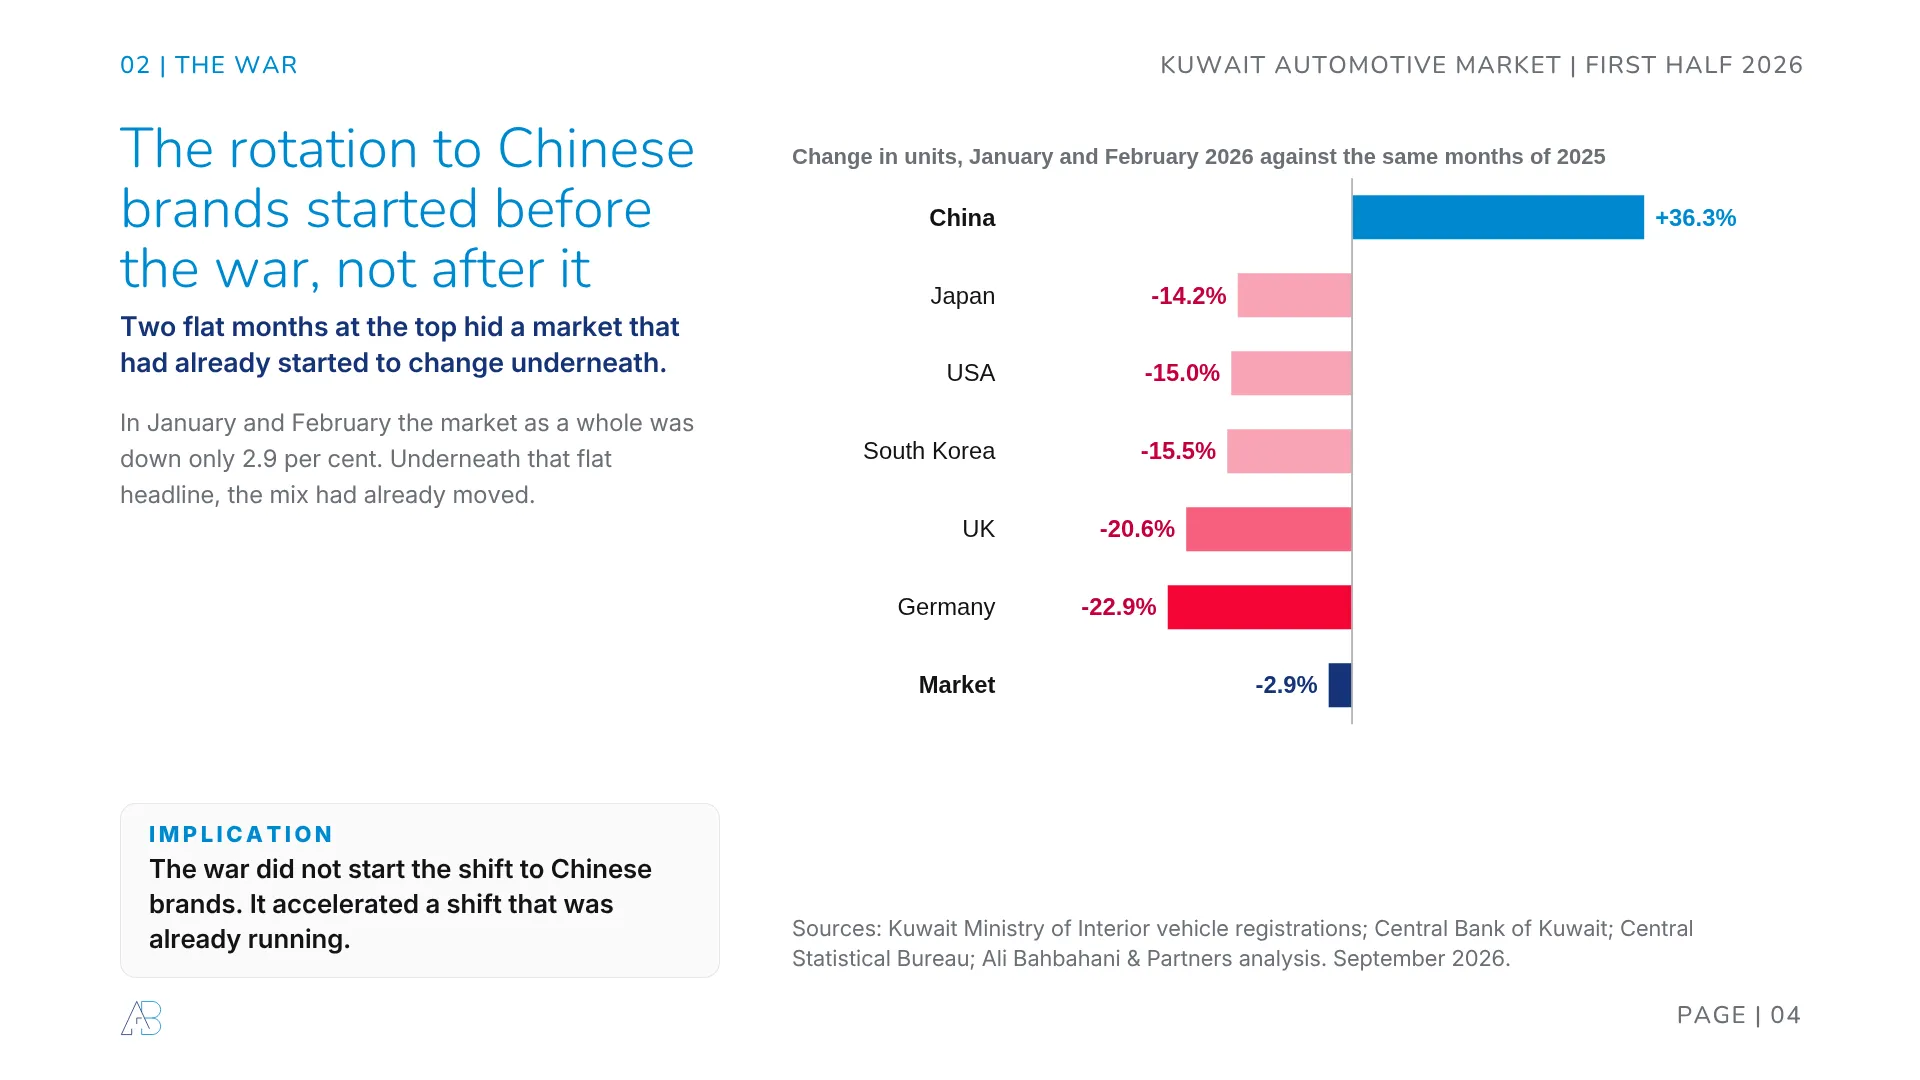
Start with the awkward fact for the war explanation. The rotation to Chinese brands was already running in January and February, when the market as a whole was down only 2.9 per cent and the headline looked flat.
Underneath that flat headline, Chinese brands were up 36.3 per cent. Japan was down 14.2, the United States 15.0, South Korea 15.5, Britain 20.6 and Germany 22.9. Two quiet months at the top hid a market that had already changed underneath.
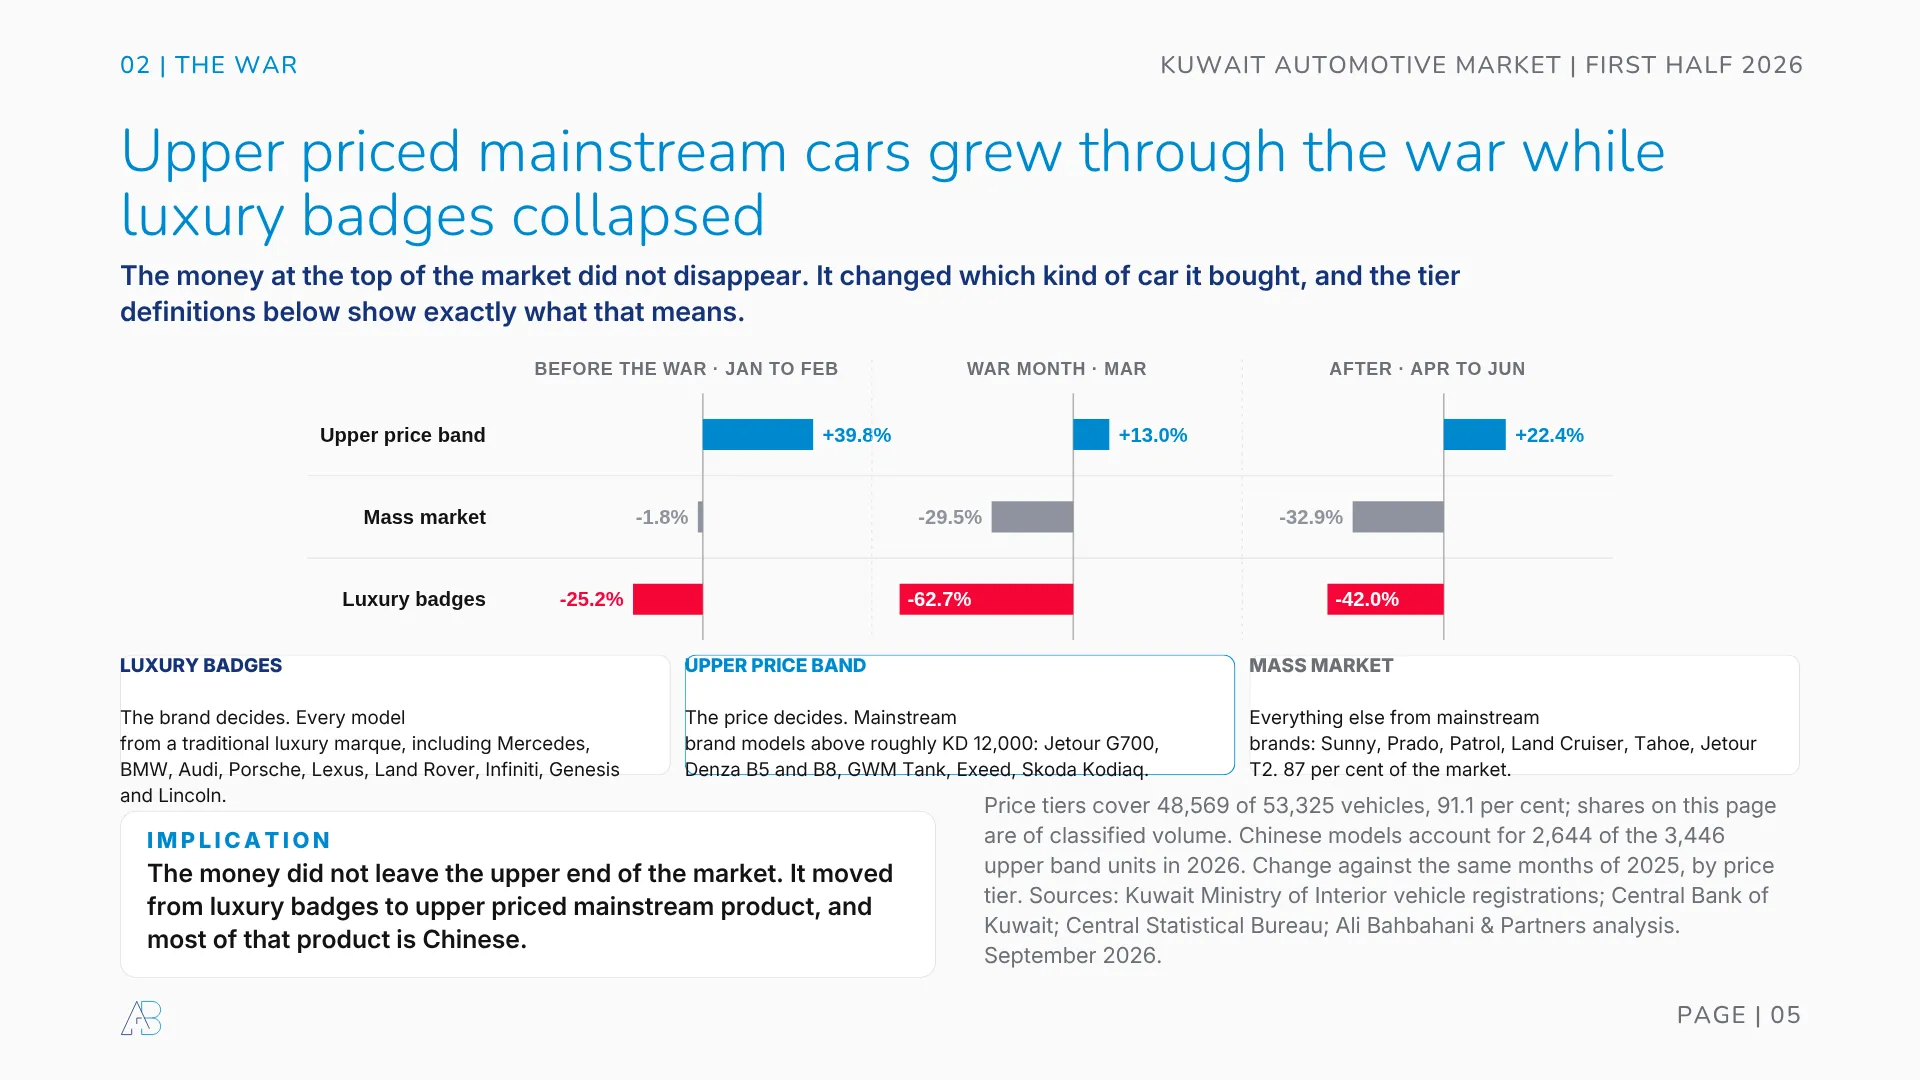
Hold that thought and watch what the shock did to each price tier. The upper price band, meaning mainstream brand models priced above roughly KD 12,000 with no luxury badge, grew 39.8 per cent before the war, 13.0 per cent in the war month and 22.4 per cent after it. Luxury badges fell 25.2, then 62.7, then 42.0.
The money at the top of the market did not leave Kuwait. It changed which kind of car it bought, and most of what it moved to is Chinese. If you want the arithmetic of why that swap makes sense to a buyer, we costed it model by model in what a car actually costs in Kuwait.
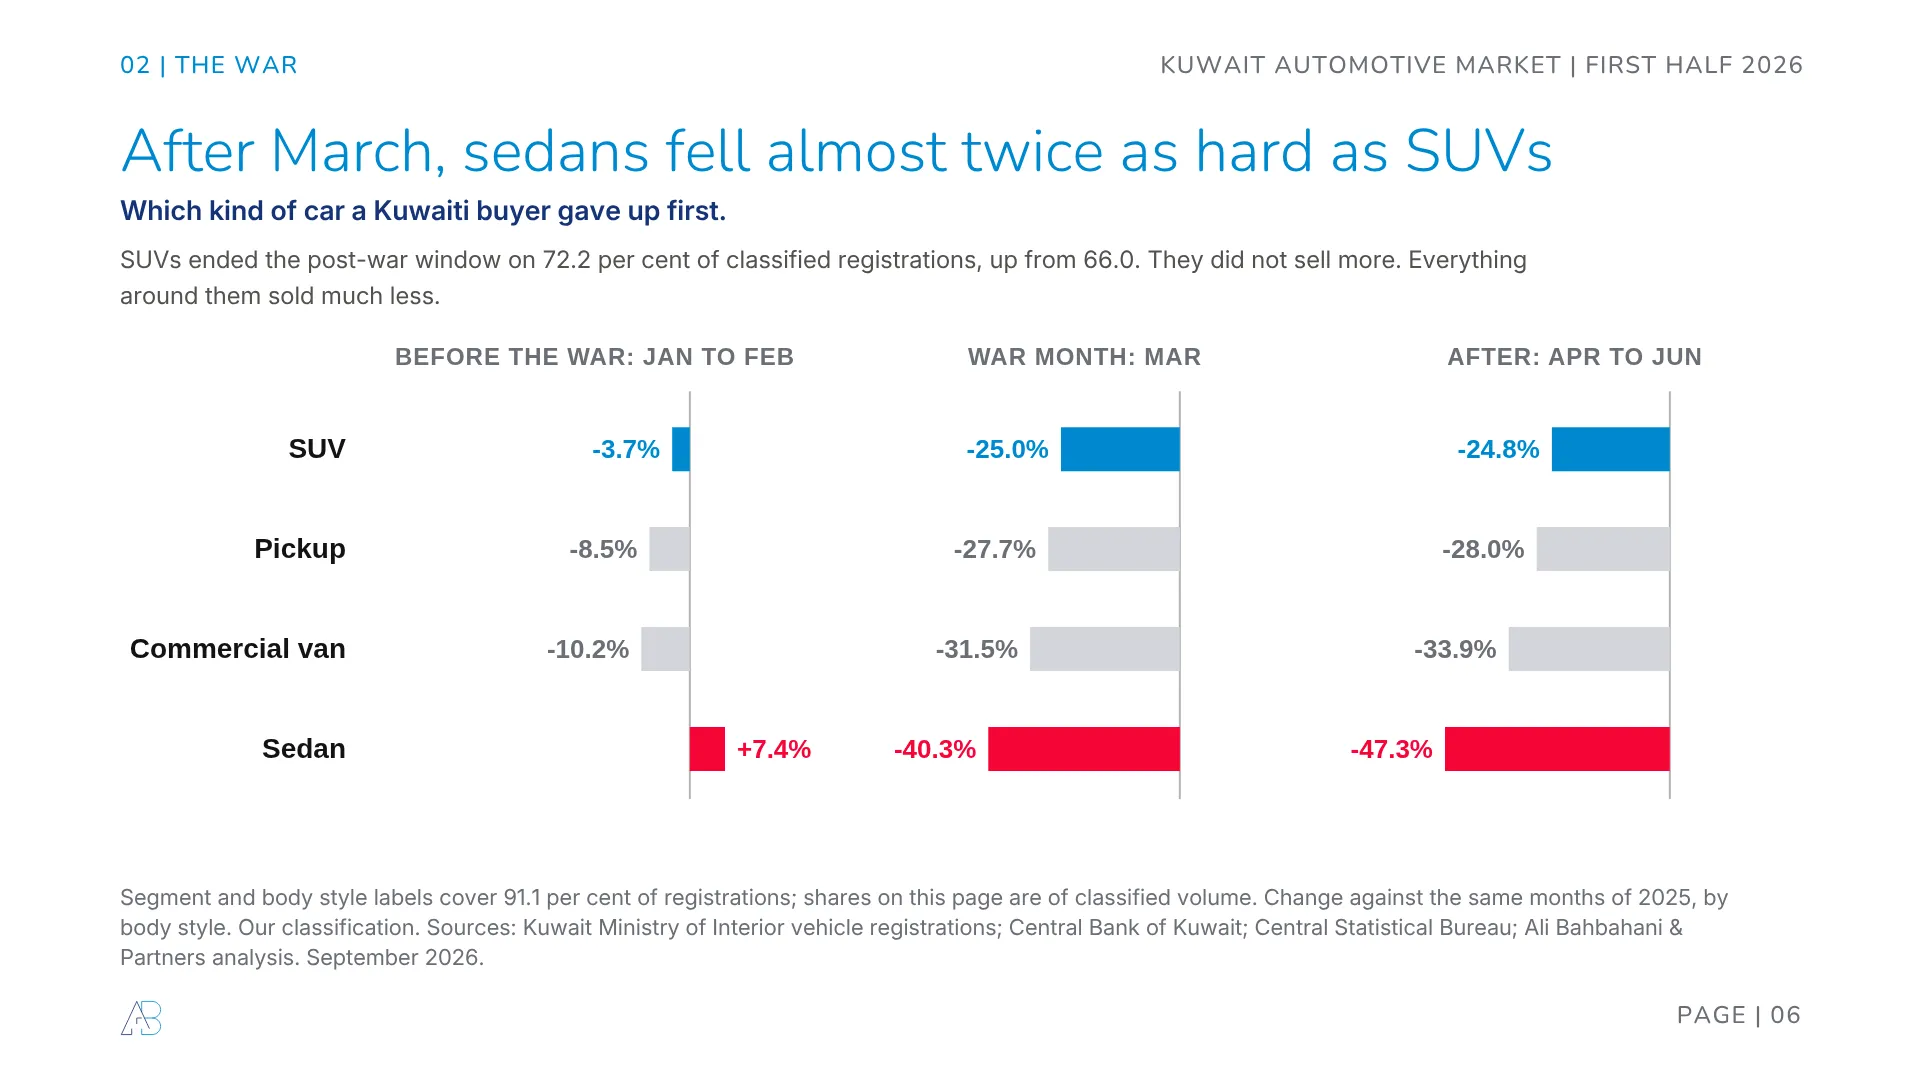
Body style tells the same story from another angle. Sedans were actually up 7.4 per cent before March. After it they fell 47.3 per cent, almost twice as hard as SUVs at 24.8. SUVs finished the post-war window on 72.2 per cent of classified registrations, up from 66.0. They did not sell more. Everything around them sold much less, a distinction most commentary gets wrong and one we made at greater length in why SUVs are taking over Kuwait’s roads. The full phase by phase chart is in the appendix.
The buyer was still there
A fall of this size has two possible explanations. Either Kuwaitis stopped buying cars, or dealers stopped having cars to sell. Those two look identical inside a registration file, so we went looking for the buyer somewhere else.
He was still spending. In March, the month the strait closed, card spending inside Kuwait rose 2.3 per cent, from KD 1,403m to KD 1,435m. Kuwaitis made 6.6 per cent fewer transactions and each one was 9.6 per cent larger. Fewer trips, bigger baskets. Spending abroad fell 40.2 per cent, because travel stopped, which is exactly what the flight data in our sixteen year study of Kuwait airport traffic would predict.
Card behaviour in Kuwait has been unusually legible for several years now, which is why it works as a control here. We have tracked it since 2010 in Kuwait’s payment revolution.
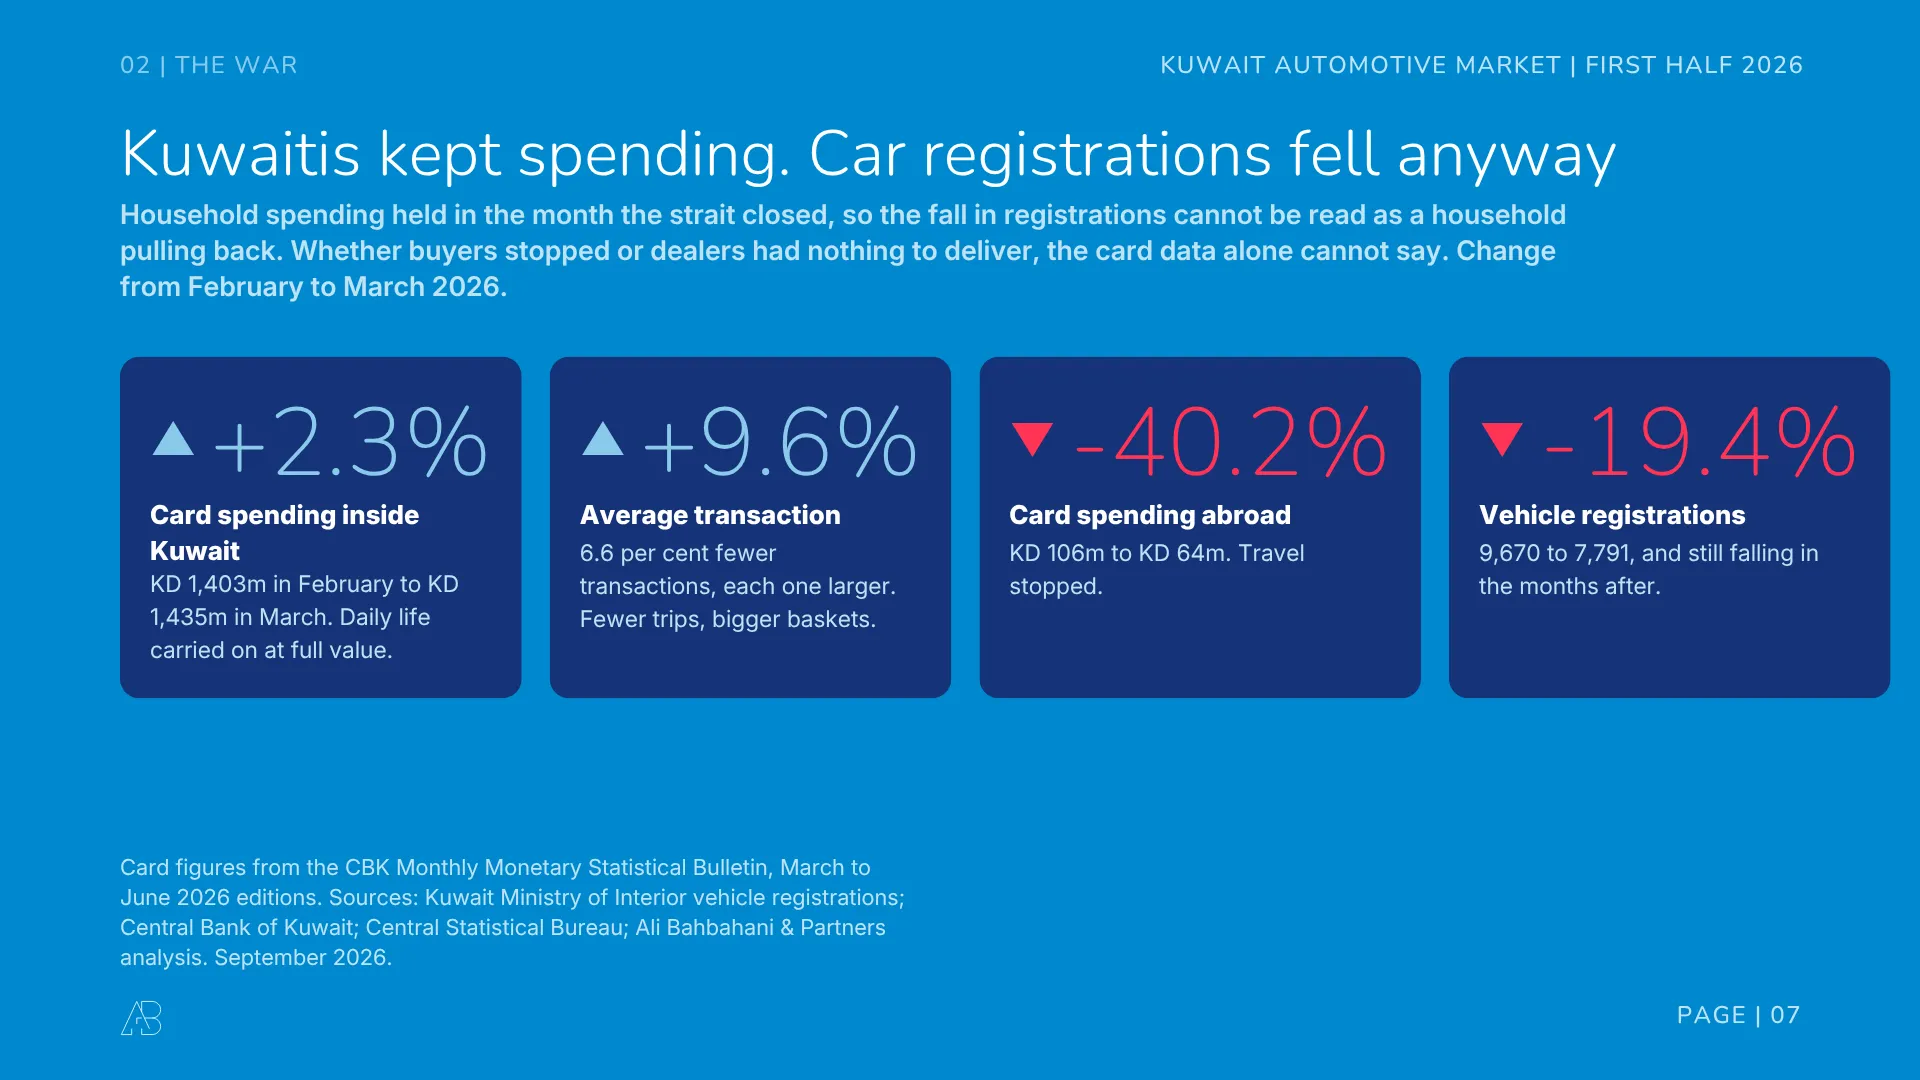
Take the whole second quarter. Card spending at the point of sale in Kuwait was down 1.9 per cent on a year earlier. Vehicle registrations were down 31.0. Household spending did not retreat. Whether demand for cars specifically retreated is a different question, and a registration file cannot answer it.
Everyone lost the same shipping lane. They did not all start from the same place
Thirty two brands sold 250 vehicles or more in the half year. Thirty of them have a comparable base in both windows, and 24 of those got worse after March. The median brand gave up 31.7 points of growth.
Here is the part that gets misread. Chinese brands gave up more than anyone: 54.1 points against 25.5 for Japanese brands. They still finished the half year up, because they walked into March growing at 23.8 per cent. Chery lost 163 points of growth. Suzuki lost 115. Toyota lost 40. Porsche, GAC, Jetour and Mitsubishi were the only four to improve.
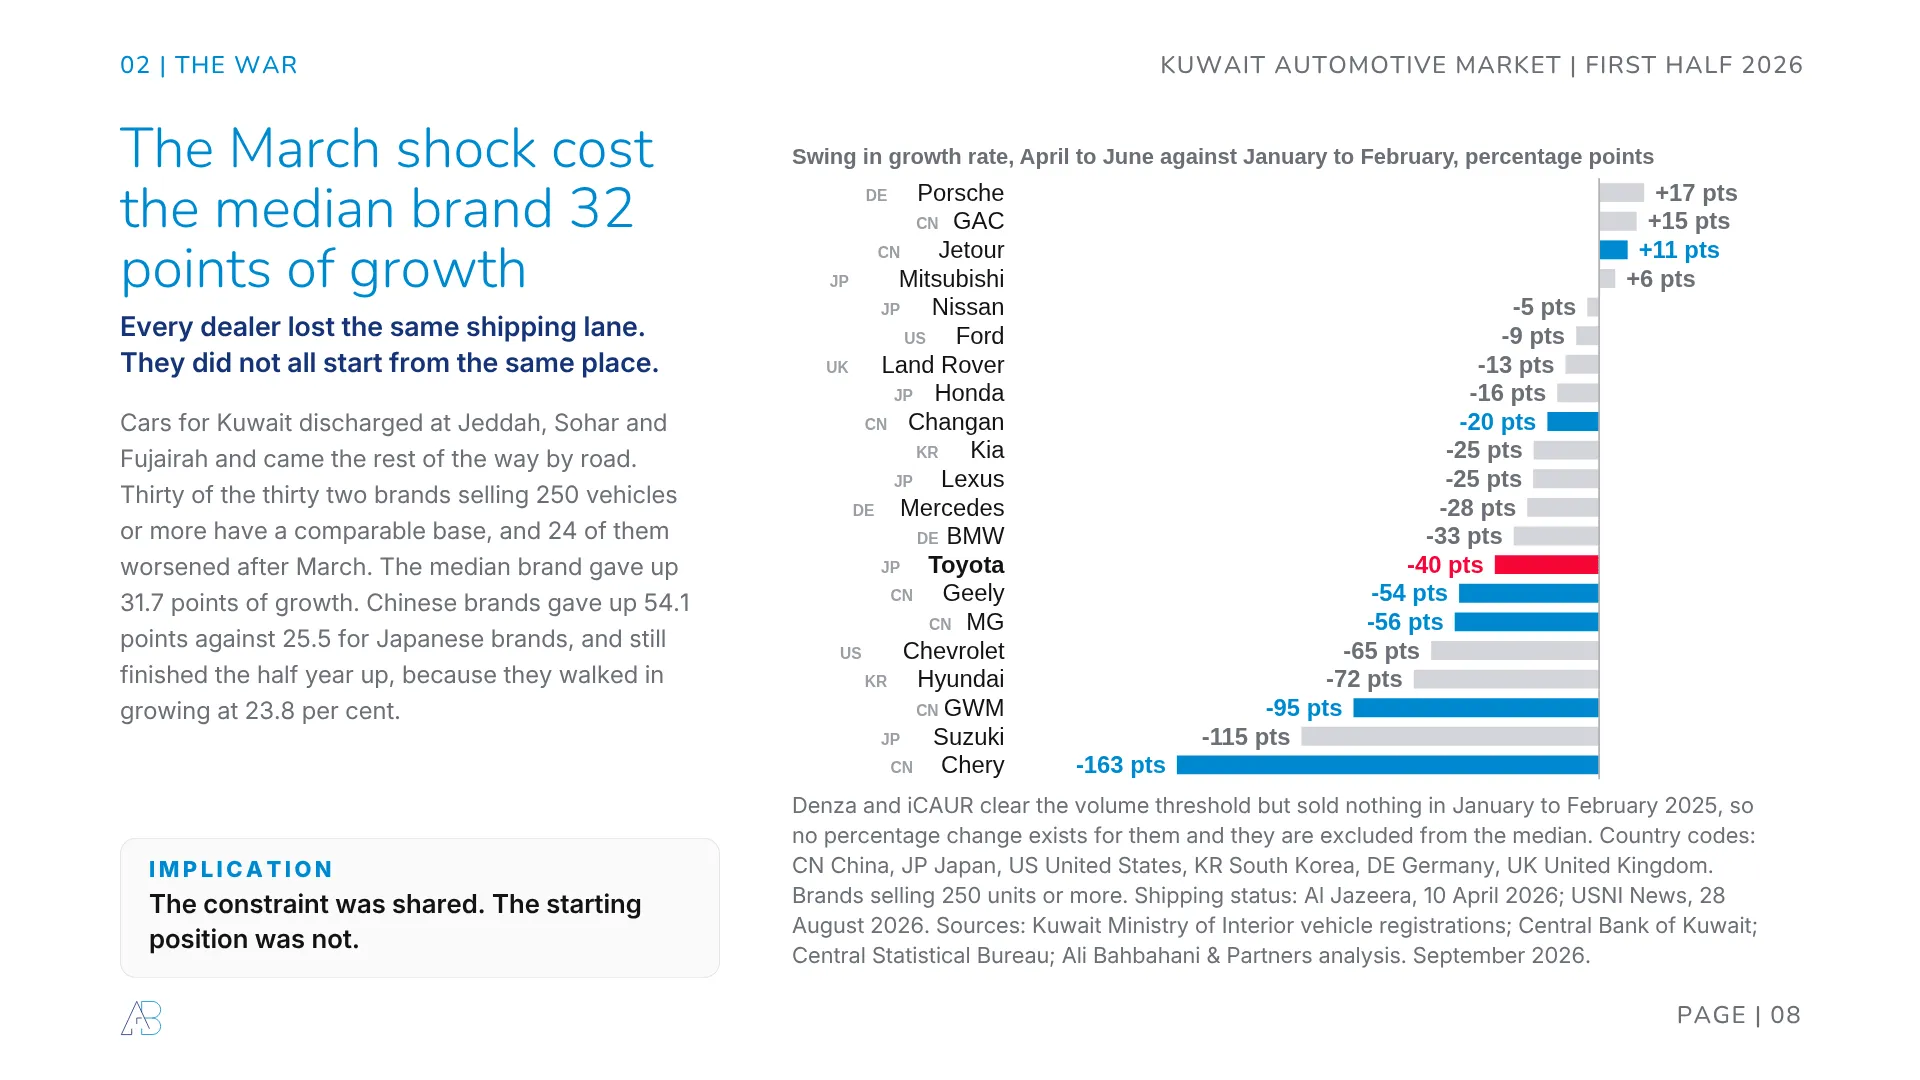
The constraint was shared. The starting position was not.
Follow the credit and the customs record
If households were fine and registrations still collapsed, the pressure has to be somewhere else. It is on the importers, and three separate datasets say so.
The first is credit. Consumer loans moved less than two per cent across the whole half year. Trade credit fell 6.5 per cent between February and June, and was down 9.0 per cent year on year at the end of June on the Central Bank’s own measure. Households kept their access to credit. Importers lost some of theirs, at the same time as they were being asked to fund KD 600 a car in extra insurance and three months of additional inventory float.

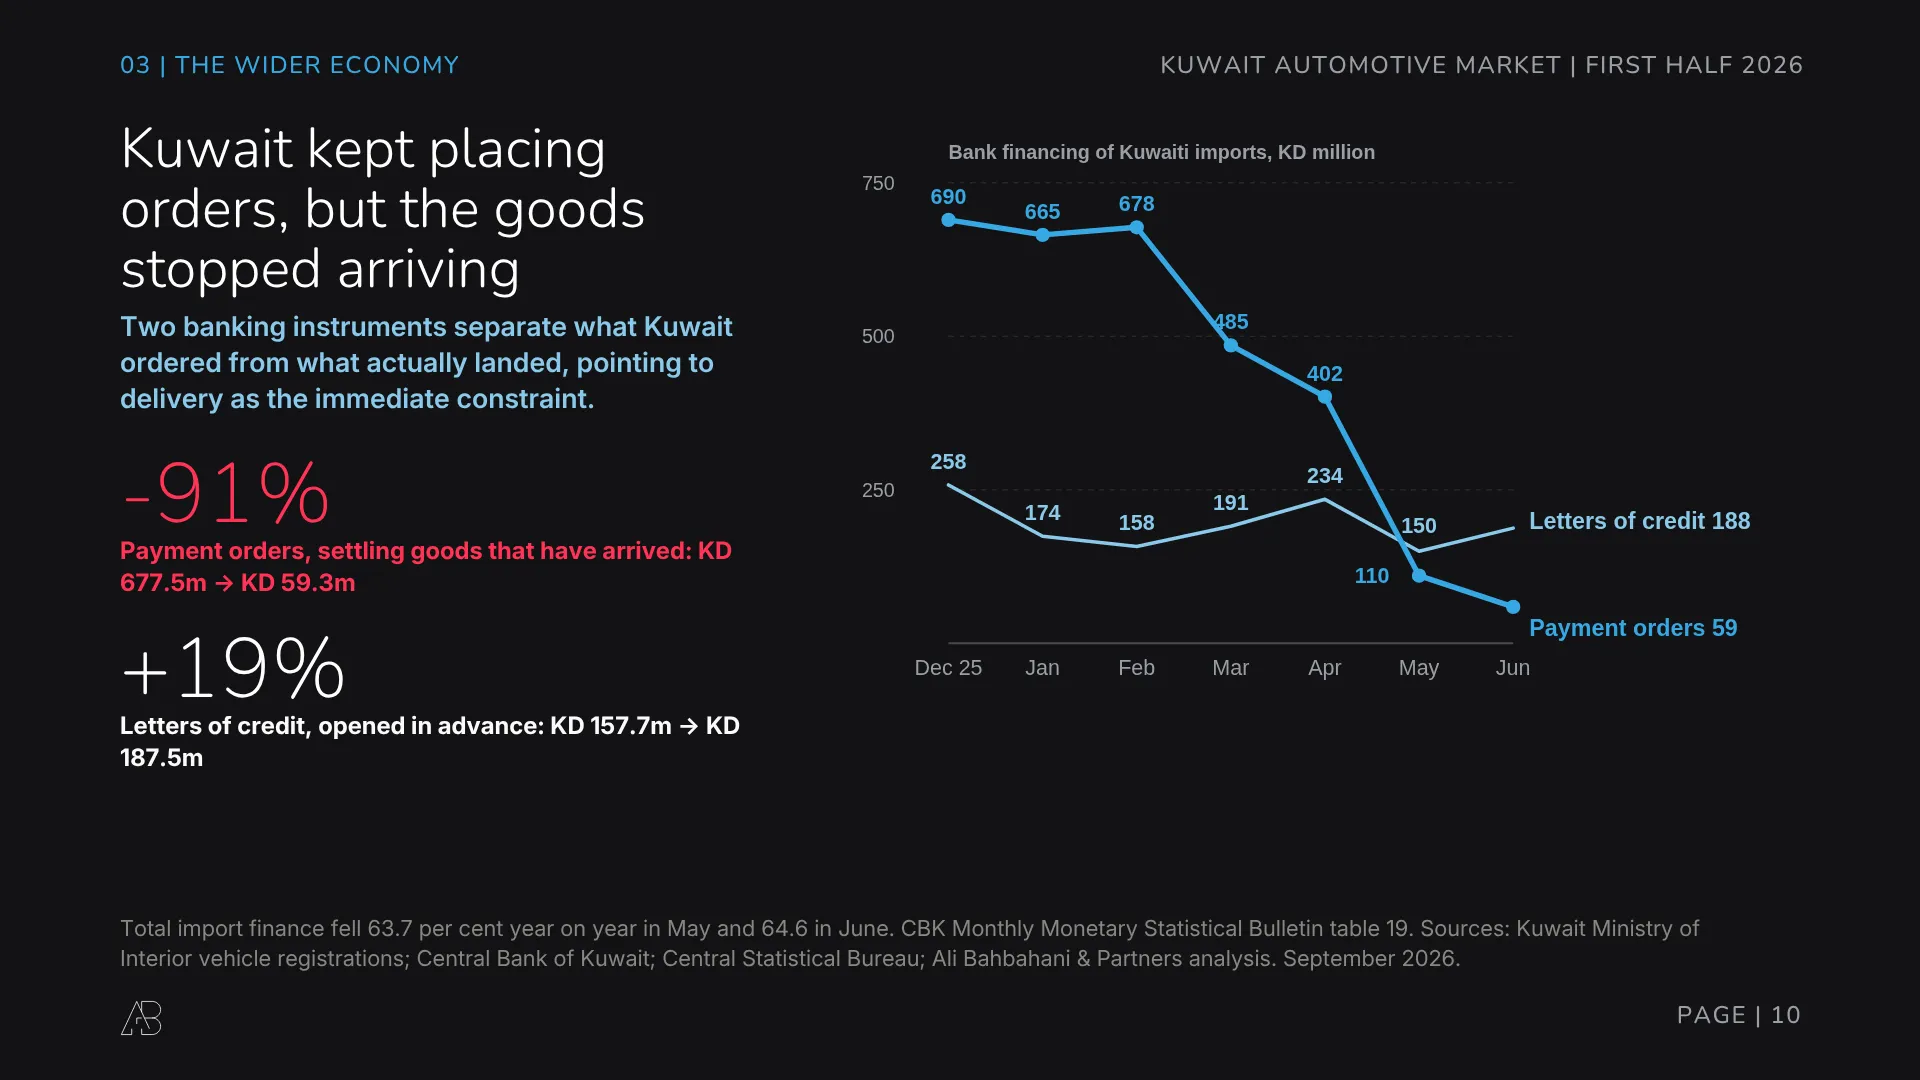
The second dataset is the sharper one, and it comes from splitting a single Central Bank table into its two instruments. They do different jobs. A letter of credit is opened in advance, for a shipment that has not happened yet. A payment order settles goods that have already arrived.
Payment orders fell from KD 677.5m in February to KD 59.3m in June, down 91 per cent. Letters of credit went the other way, from KD 157.7m to KD 187.5m, up 19 per cent.
Kuwait went on ordering. Kuwait stopped receiving. That single divergence is the cleanest evidence in the study that the constraint was delivery rather than demand.
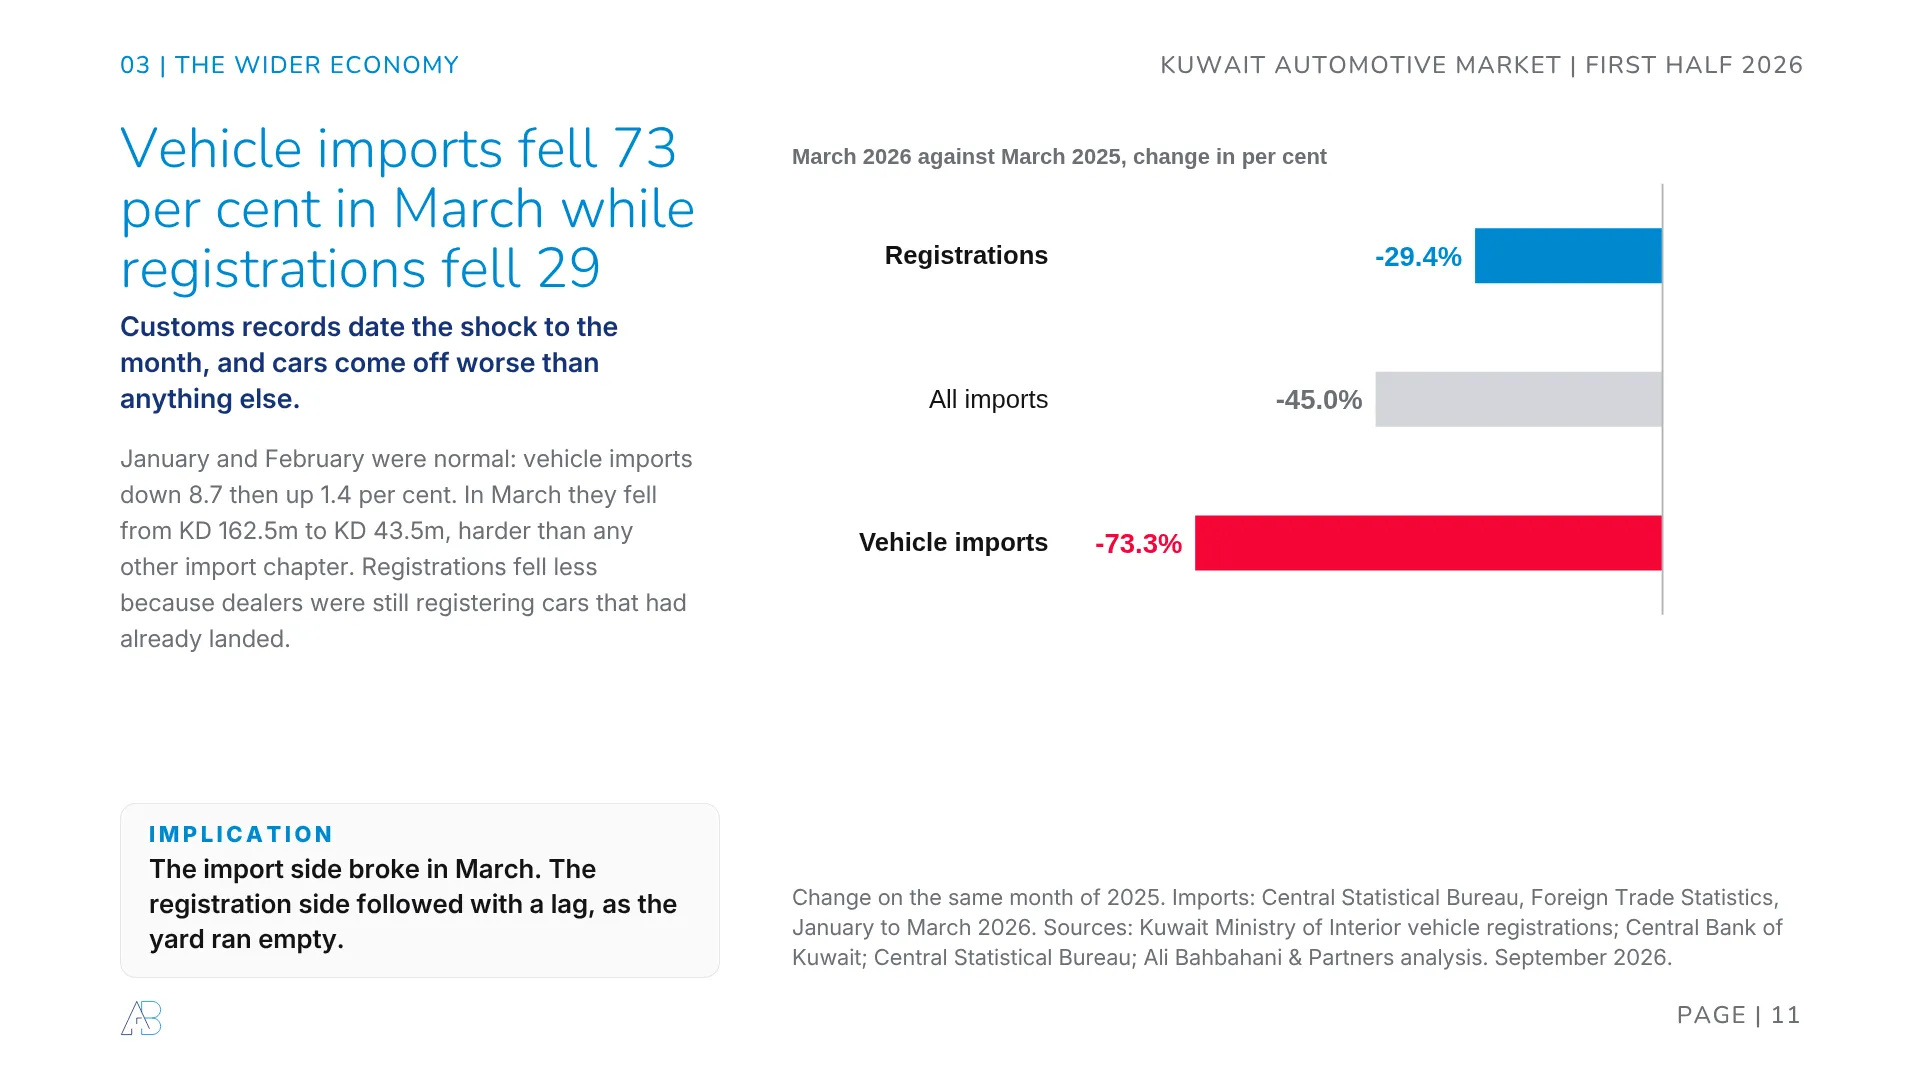
The third dataset dates the shock to the month. In March the customs value of vehicle imports fell 73.3 per cent, from KD 162.5m to KD 43.5m. That is a steeper fall than any other import chapter, and steeper than total imports at 45.0 per cent. January and February had been normal: vehicle imports down 8.7 per cent, then up 1.4.
Registrations fell only 29.4 per cent in March, because dealers were still handing over cars that had already cleared the port. The gap between the two numbers is the inventory. It ran out in April, which is why April and May were worse than March. Kuwait is exposed to this kind of shock across most of what it consumes, a point we made about food supply in securing Kuwait’s food future and about trade policy in our read on the 2025 tariffs.
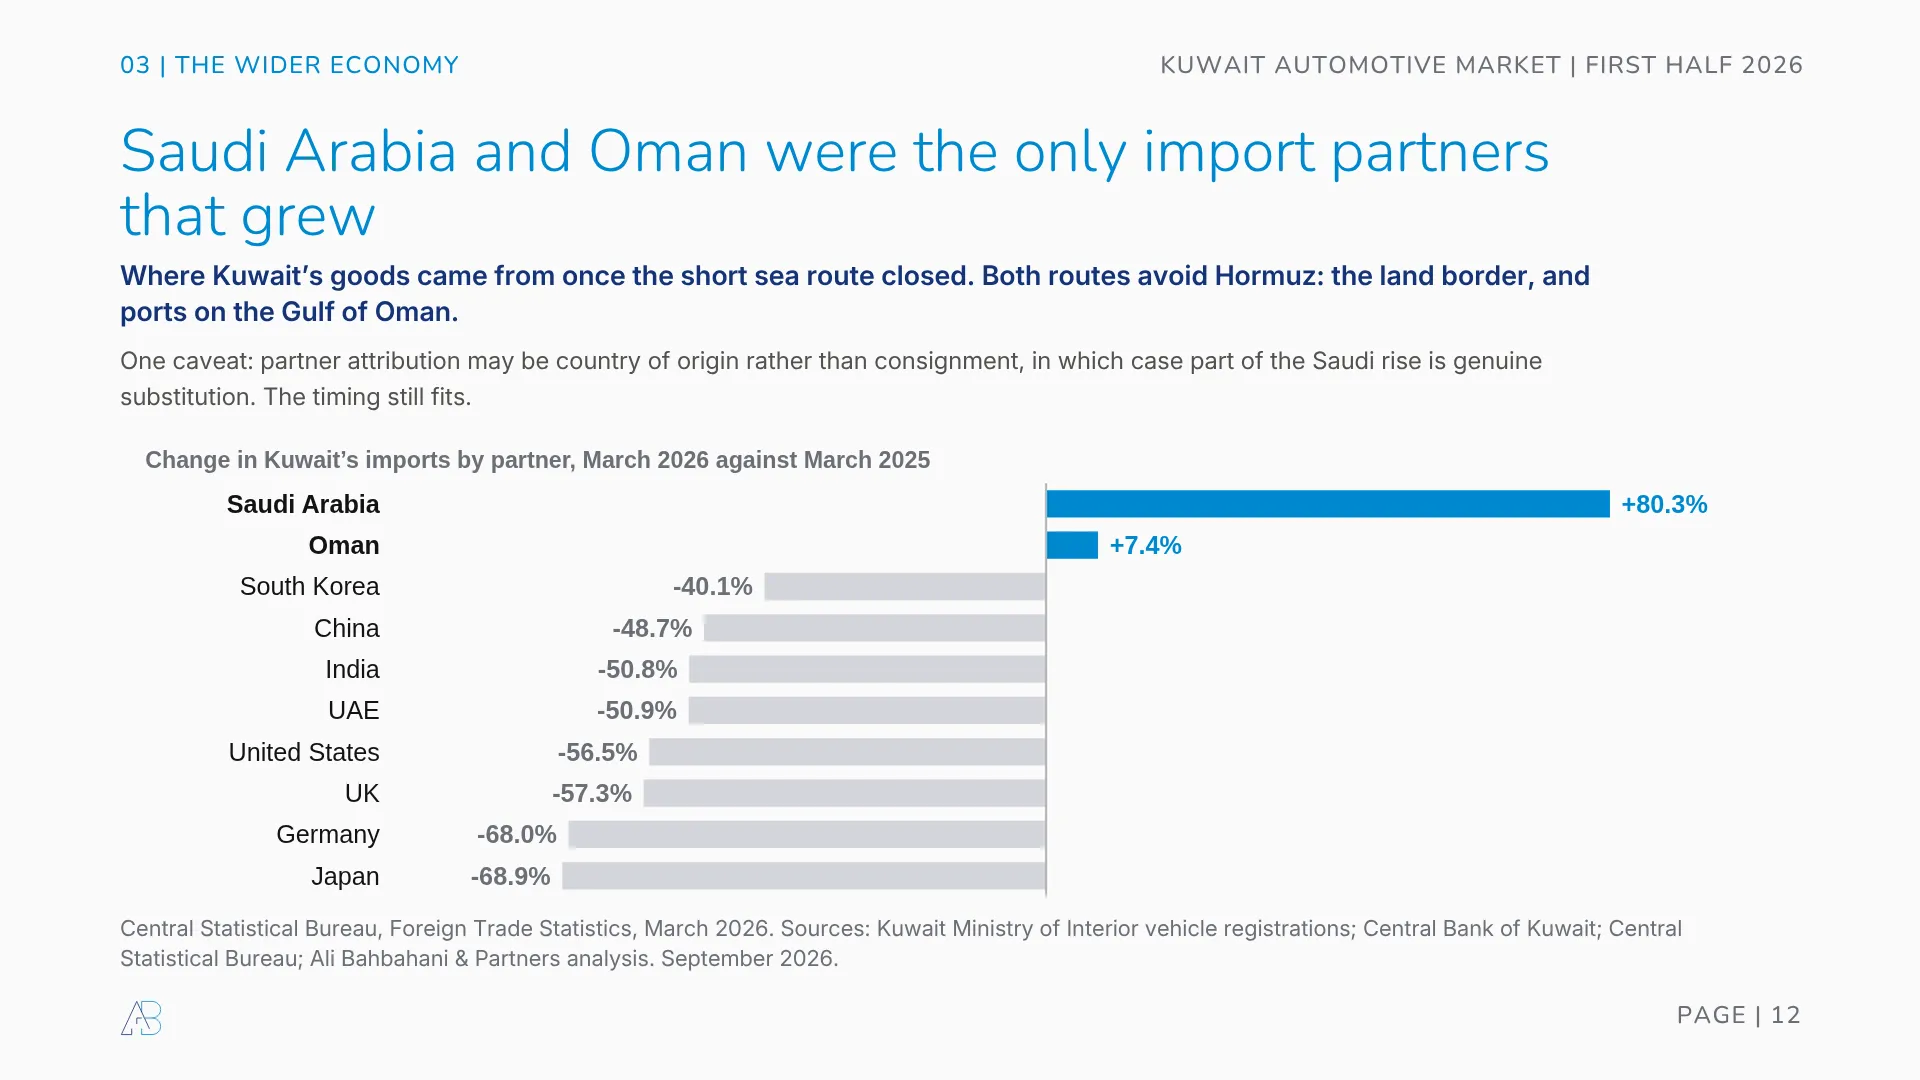
Two trade partners grew in the month everything else halved. Saudi Arabia was up 80.3 per cent and Oman up 7.4. Every other major partner fell between 40 and 69 per cent. Those two are the ways into Kuwait that do not pass through Hormuz: the land border, and ports on the Gulf of Oman.
One caveat we will not hide. Partner attribution in the customs file may be country of origin rather than country of consignment, in which case part of the Saudi rise is genuine substitution rather than rerouting. The timing still fits.
Putting a number on the hole
Take the January and February run rate, apply the ordinary shape of a Kuwaiti half year drawn from 2021 to 2025, and March to June should have delivered 44,128 registrations. It delivered 33,313. The gap is 10,815 vehicles, or 24.5 per cent. Run the same method on 2022, 2023, 2024 and 2025 and it misses the actual outcome by at most nine per cent.
If the constraint really was shipping, those 10,815 vehicles are deferred rather than lost, and they should turn up in the second half.
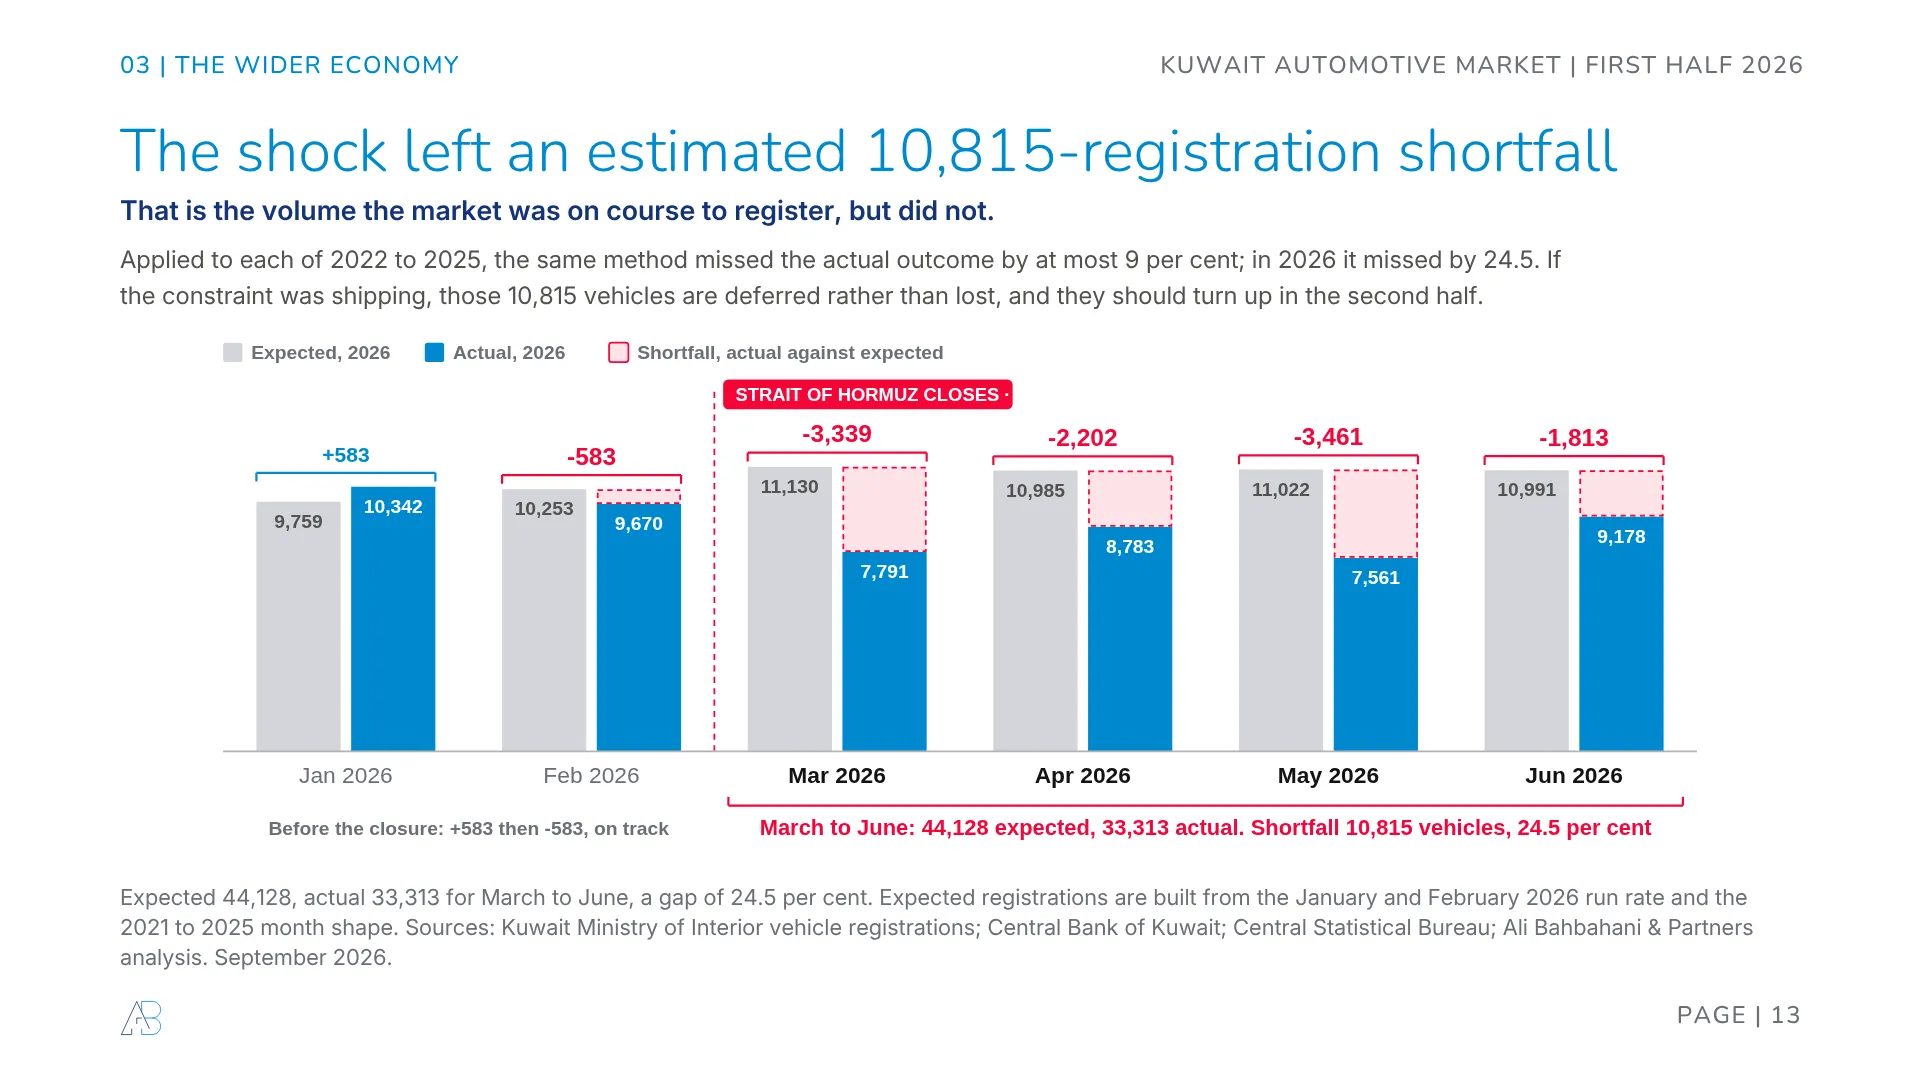
That is the gap the closure left: roughly eleven thousand registrations that did not happen. It is a large number and it is the one every dealer meeting will stop at. Stopping there would be a mistake, because it explains none of what comes next.
China passed Japan
Chinese brands took 37.3 per cent of Kuwaiti registrations in the first half of 2026. Japanese brands took 36.1. That is the first time China has led in this market. Five years ago the gap was 35.8 points the other way.
Two honest qualifications. This is a half year figure, and Japan may still finish 2026 ahead. And the crossing happened inside a period when supply was broken for everyone. The crossing happened all the same, and Germany and Korea are the quiet casualties of it.
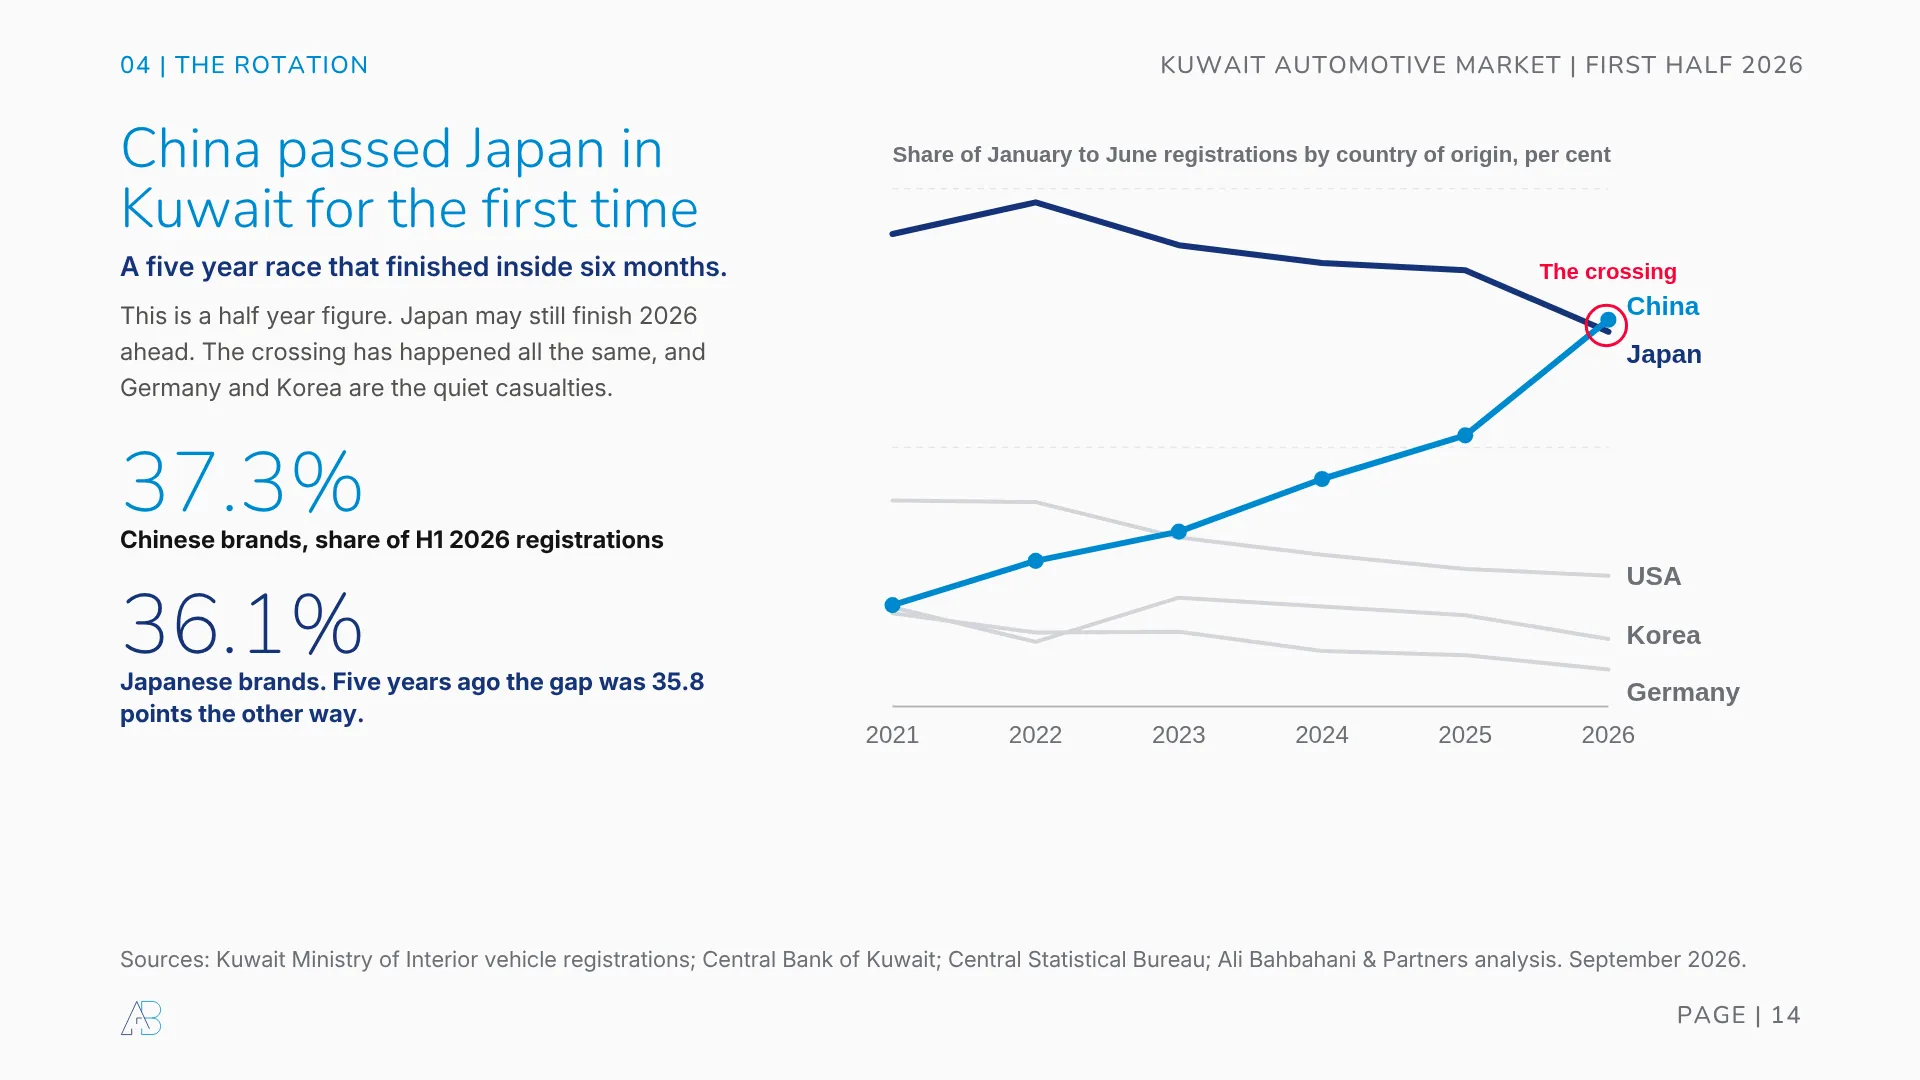
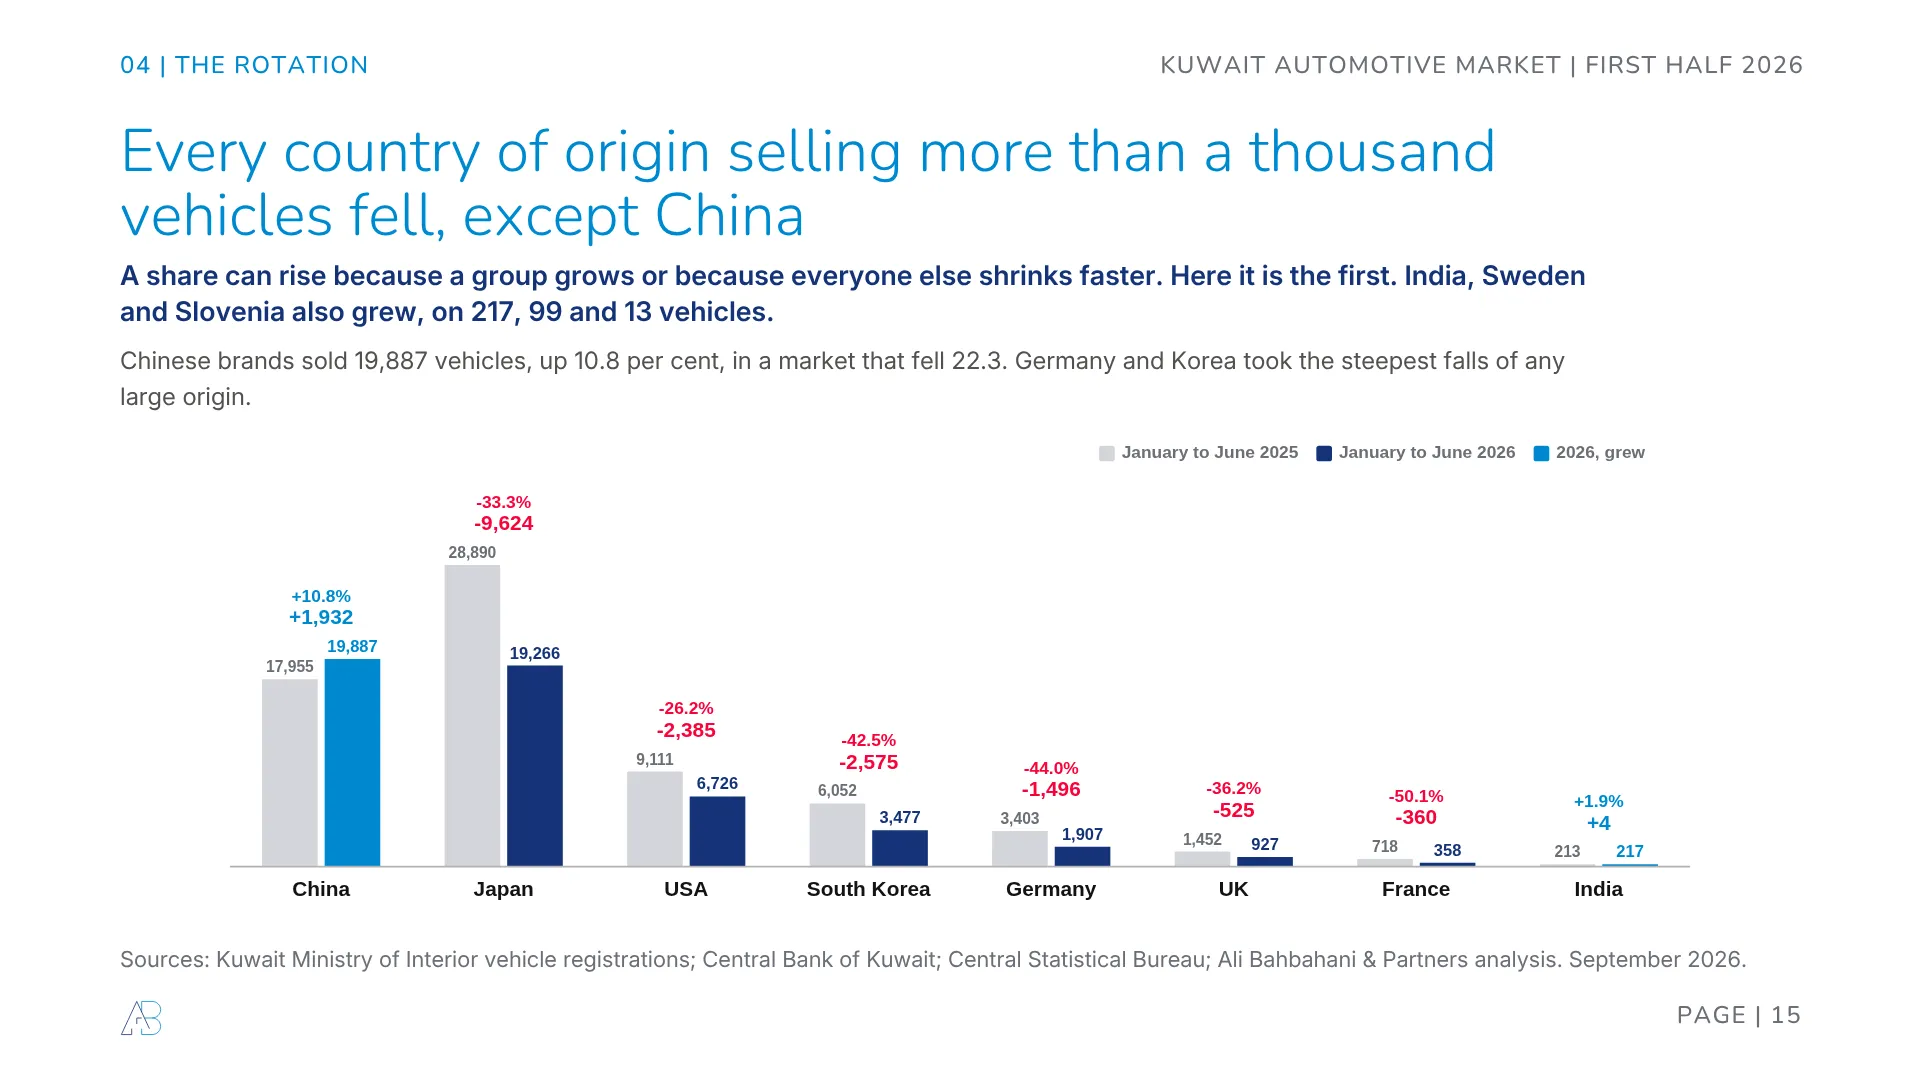
A share can rise two ways: because a group grows, or because everyone else shrinks faster. Here it is the first.
Chinese brands sold 19,887 vehicles, up 1,932 units and 10.8 per cent, in a market that fell 22.3. Japan fell 33.3 per cent and 9,624 units. Germany fell 44.0 per cent and Korea 42.5, the steepest falls of any large origin. Outside China, only India, Sweden and Slovenia grew, on 217, 99 and 13 vehicles respectively.
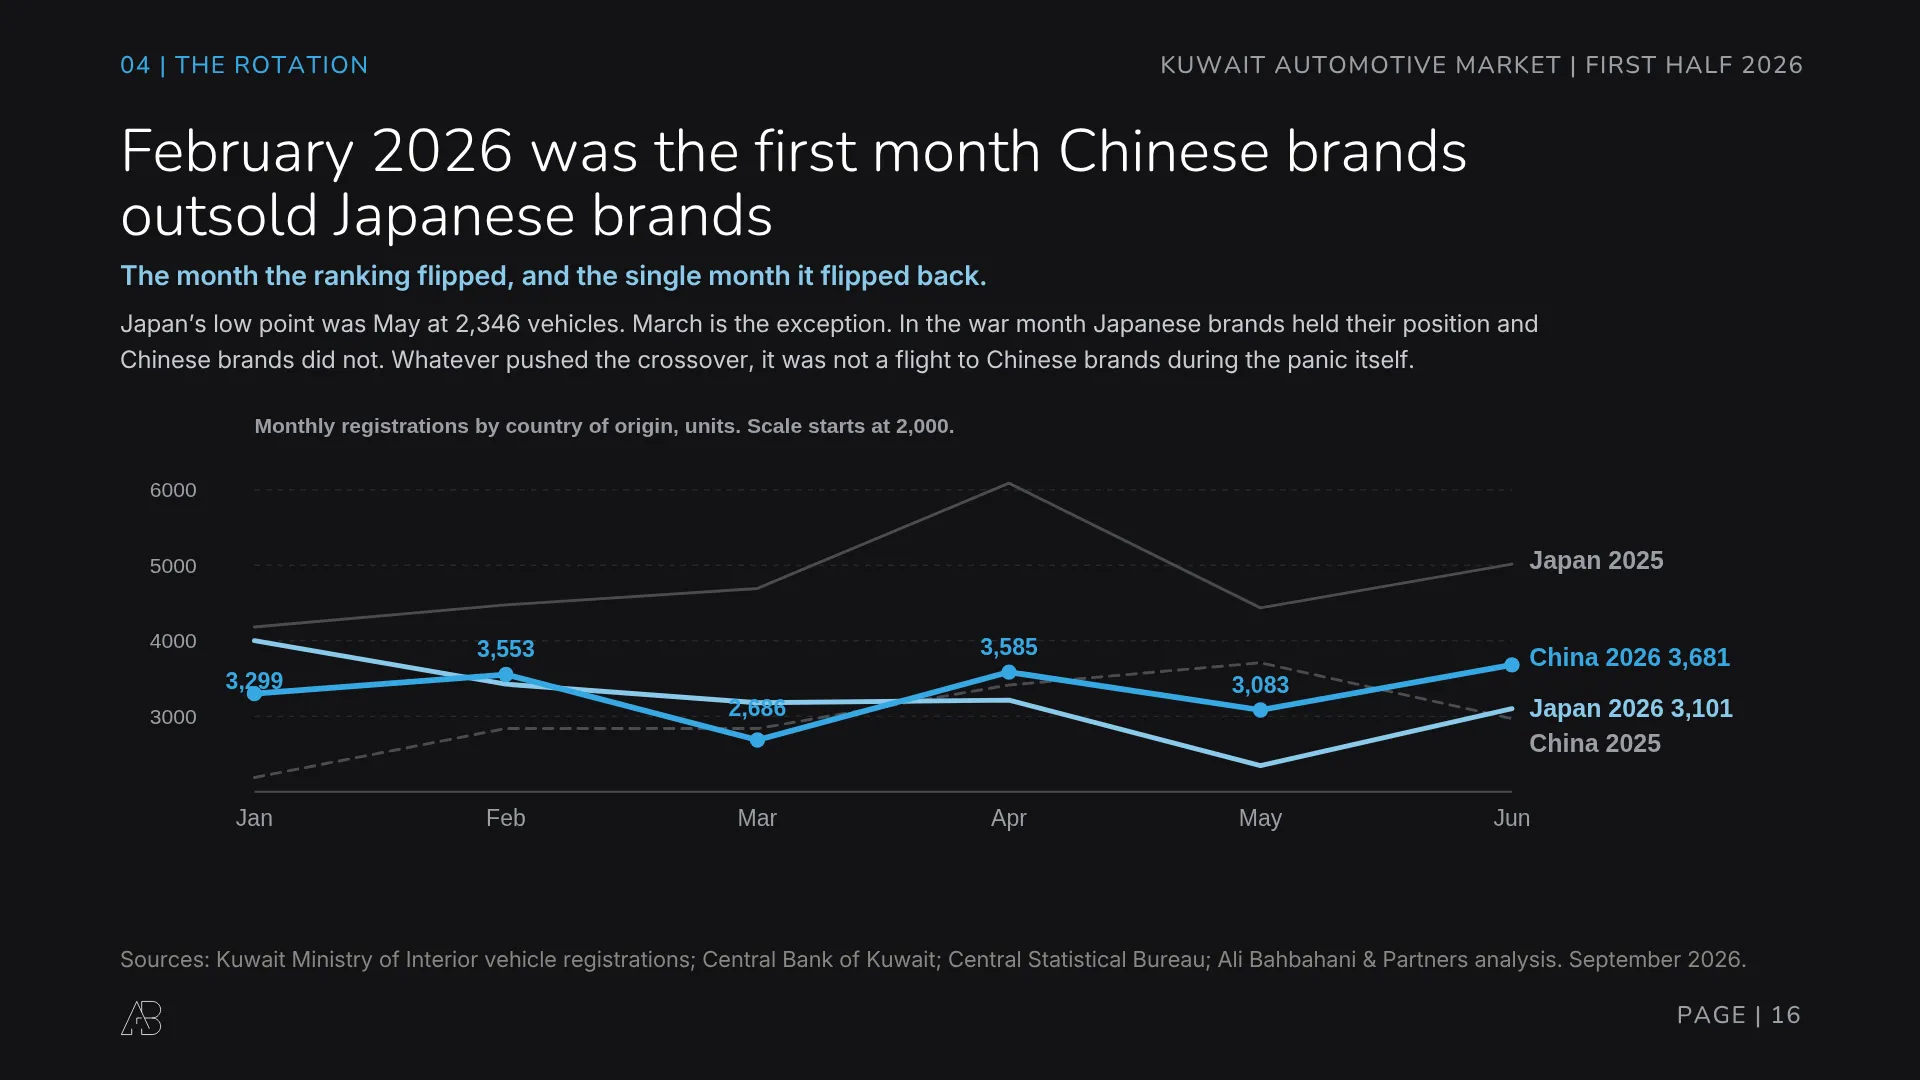
The monthly detail contains a useful correction to the lazy version of this story. February 2026 was the first month Chinese brands outsold Japanese brands in Kuwait. March was the exception: in the war month itself, Japanese brands held their position and Chinese brands did not. Japan’s low point came in May, at 2,346 vehicles.
Whatever pushed the crossover, it was not a panic flight to Chinese brands during the shock.
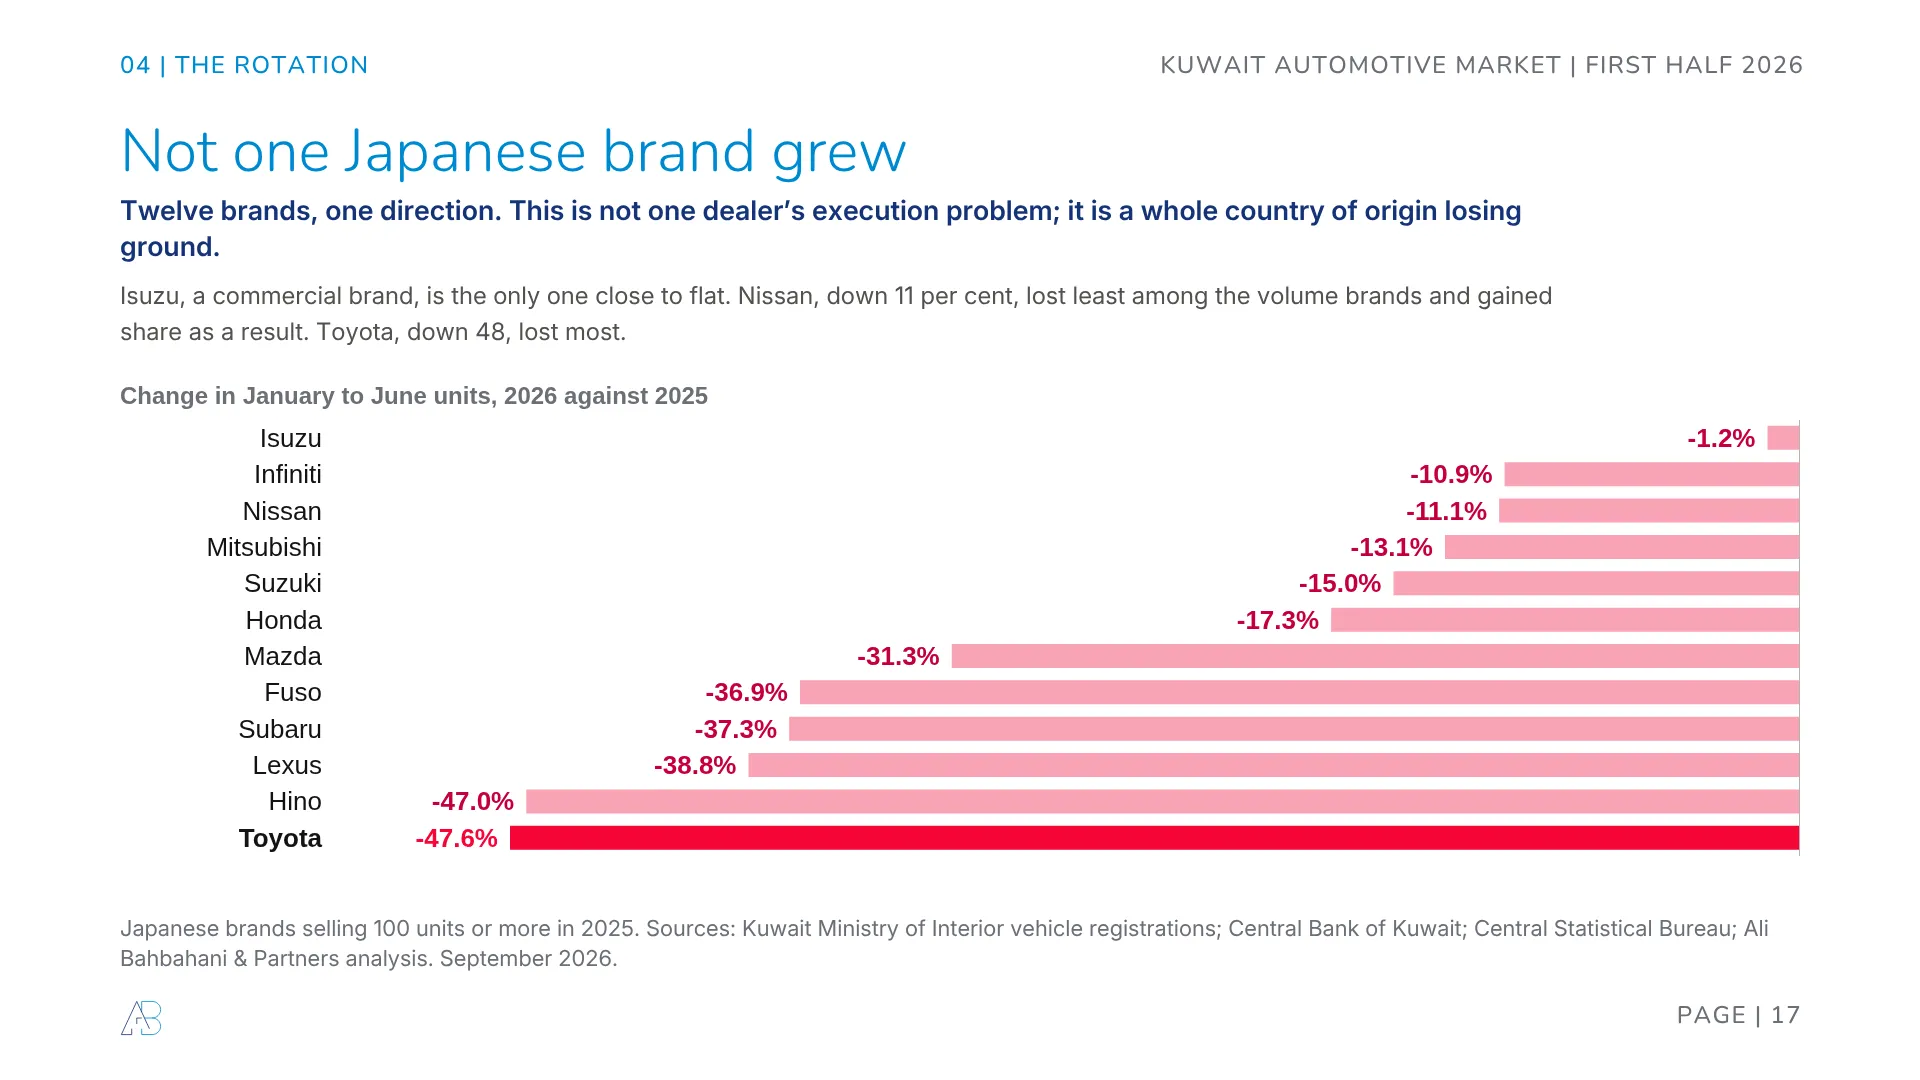
Not one Japanese brand grew. Twelve brands, one direction. Isuzu, a commercial marque, is the only one close to flat at down 1.2 per cent. Nissan lost least among the volume brands at 11.1 per cent, and gained share as a result. Toyota lost most at 47.6.
That pattern is not one distributor’s execution problem. It is a whole country of origin losing ground, which is what we flagged as a risk in our 2013 to 2023 study of brand dominance.
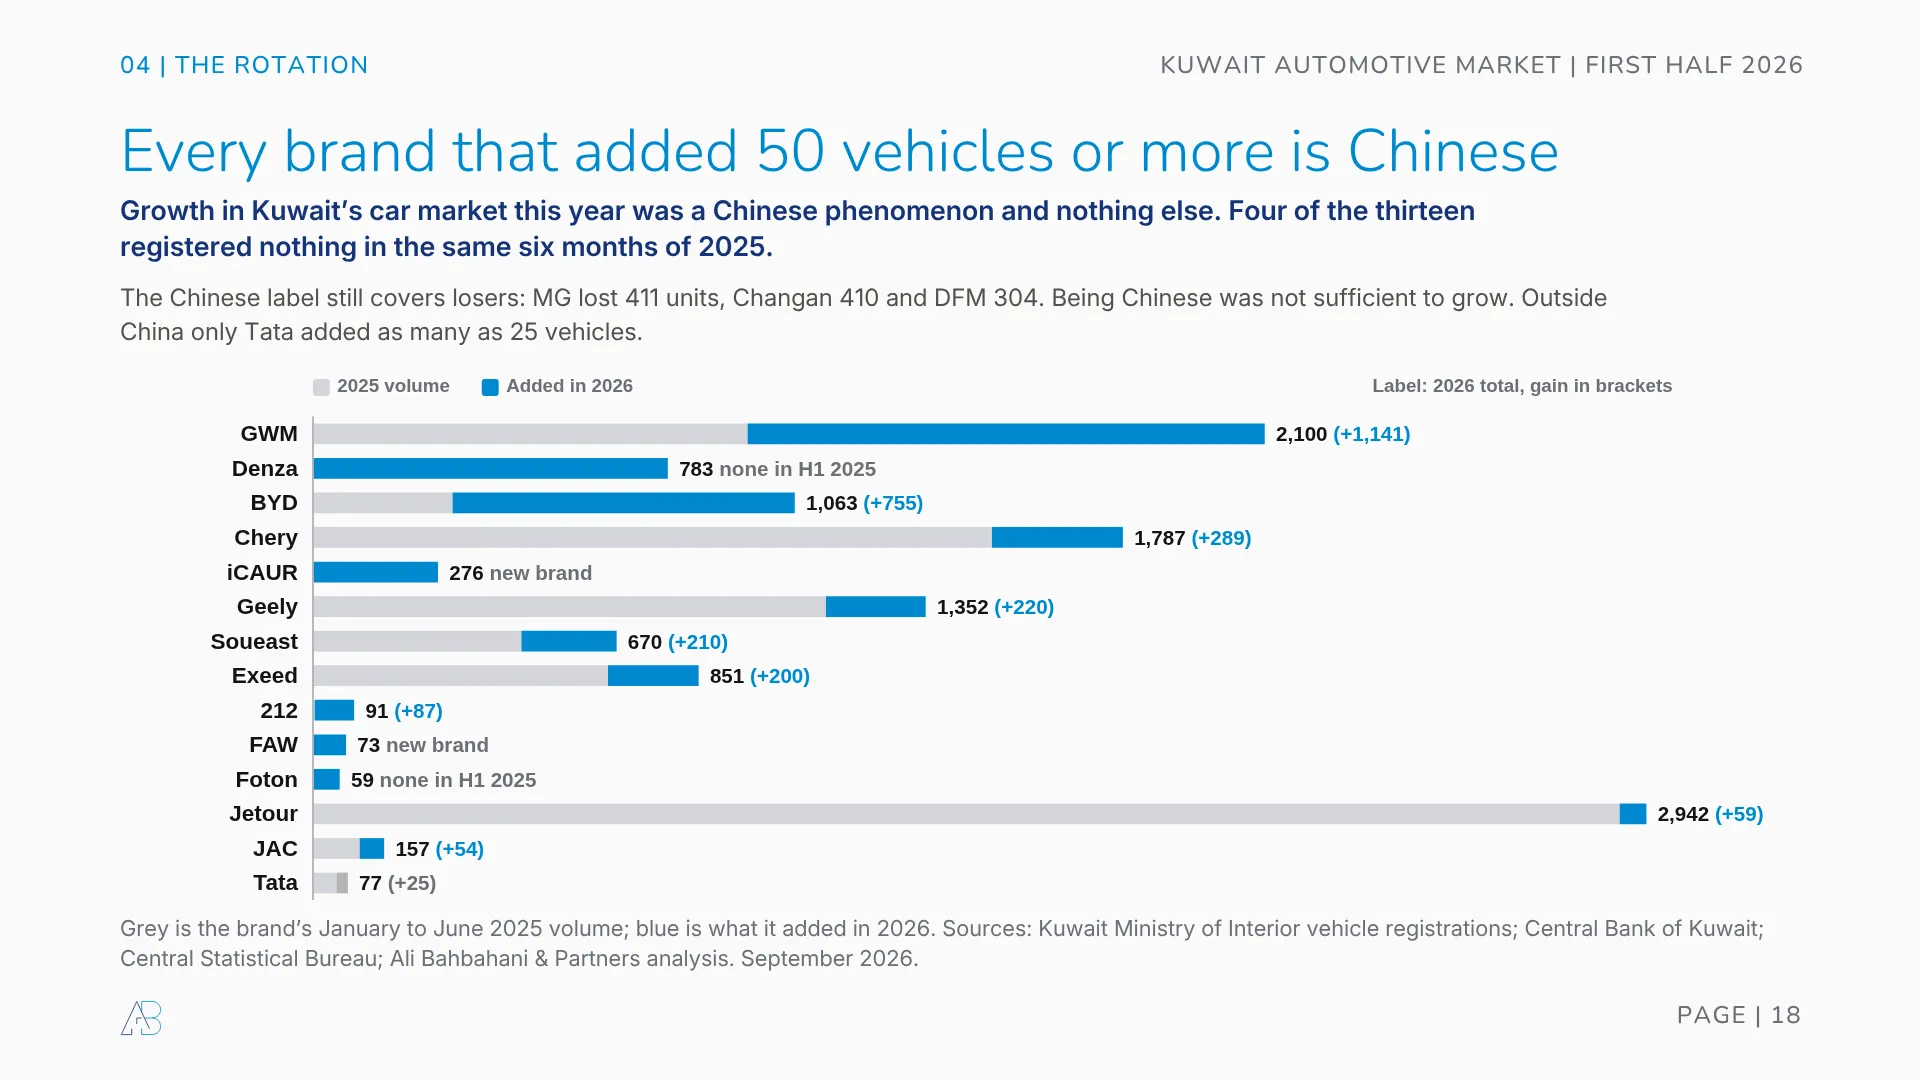
Thirteen brands added 50 vehicles or more this year. All thirteen are Chinese. GWM added 1,141, BYD 755, Denza 783 from nothing, Chery 289, iCAUR 276 as a new entrant, Geely 220, Soueast 210 and Exeed 200. Outside China, only Tata added as many as 25 vehicles.
Being Chinese was not sufficient, though. MG lost 411 units, Changan 410 and DFM 304. The label covers losers as well as winners.
Toyota is two problems, not one
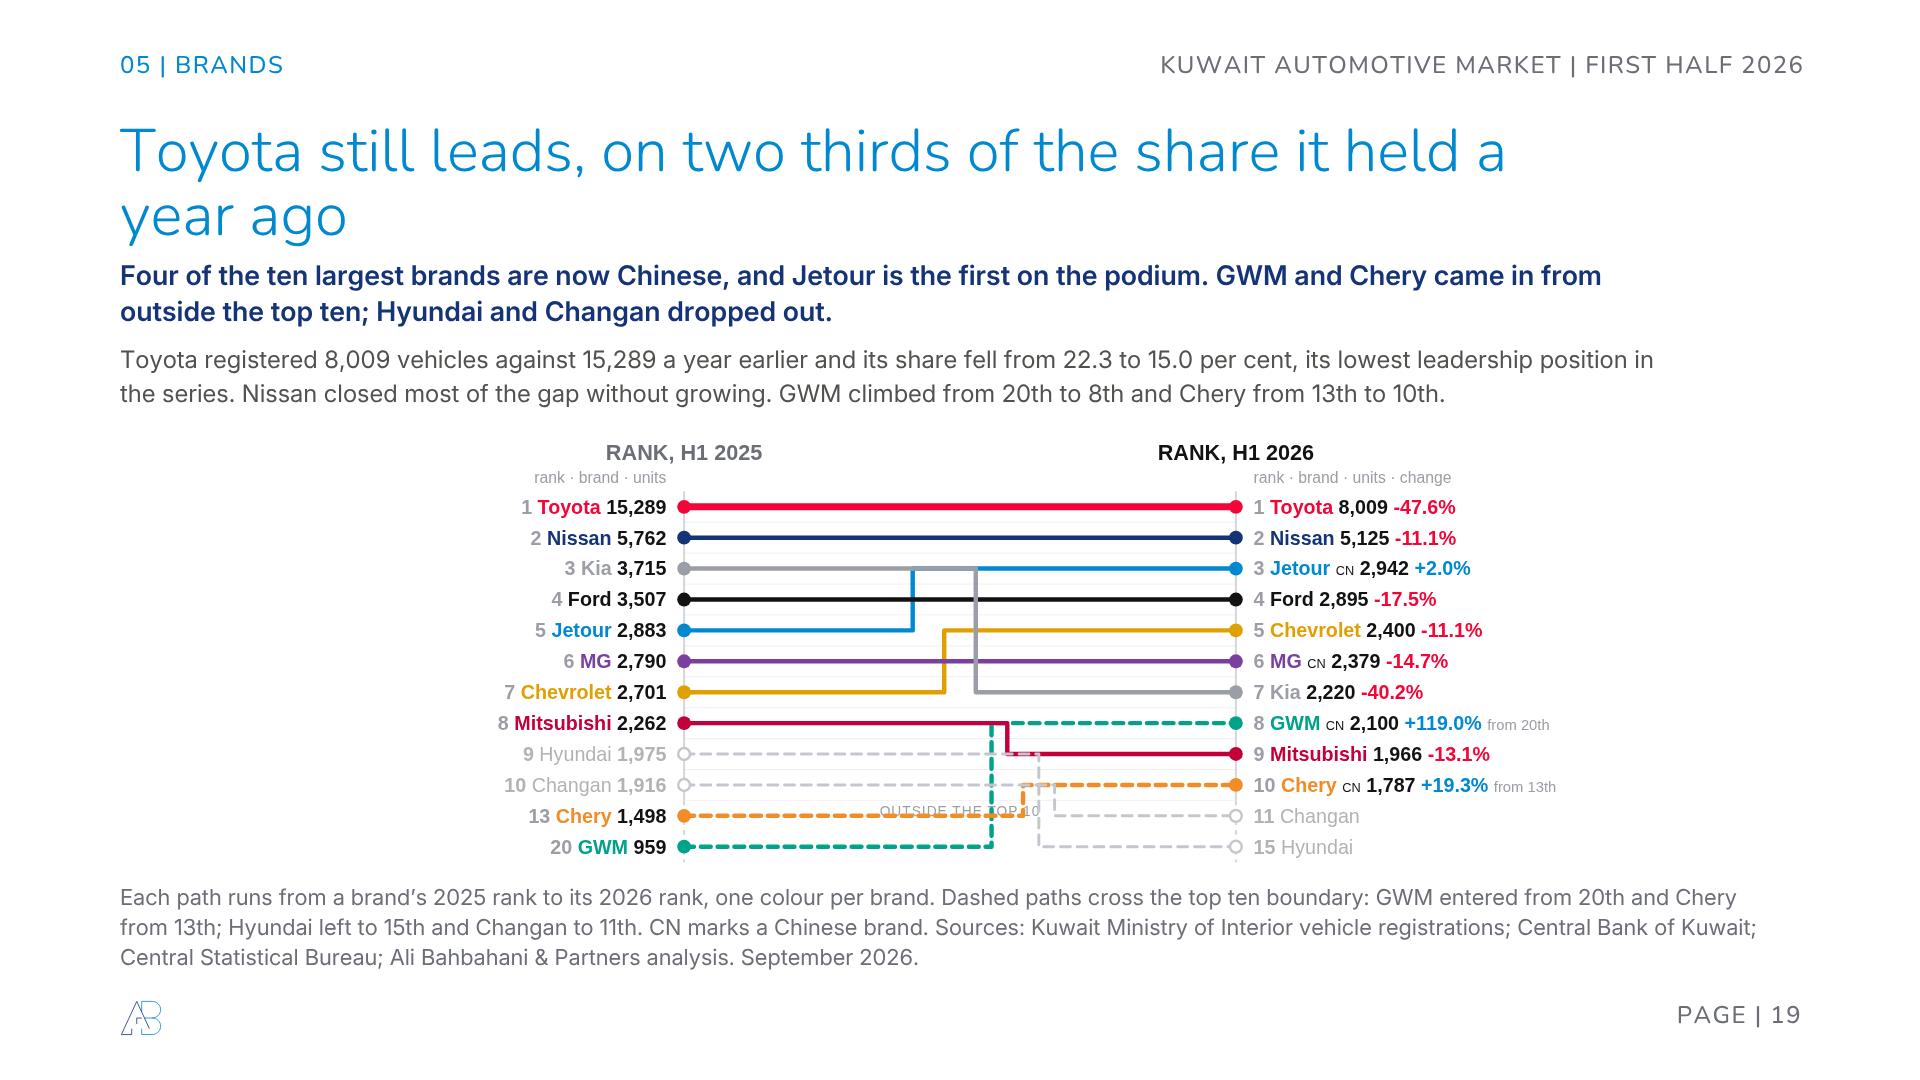
Toyota still leads Kuwait. It leads on two thirds of the share it held a year ago.
Toyota registered 8,009 vehicles against 15,289, and its share fell from 22.3 per cent to 15.0. That is its weakest leadership position in our series. Nissan closed most of the gap without growing, at 5,125 units and down 11.1 per cent. Jetour took third place at 2,942, the first Chinese brand on the Kuwaiti podium. GWM climbed from twentieth to eighth and Chery from thirteenth to tenth, while Hyundai fell to fifteenth and Changan to eleventh.
Four of the ten largest brands in Kuwait are now Chinese. A year ago, at the same point, we were still describing that as a trend to watch in the mid-2025 winners and losers review.
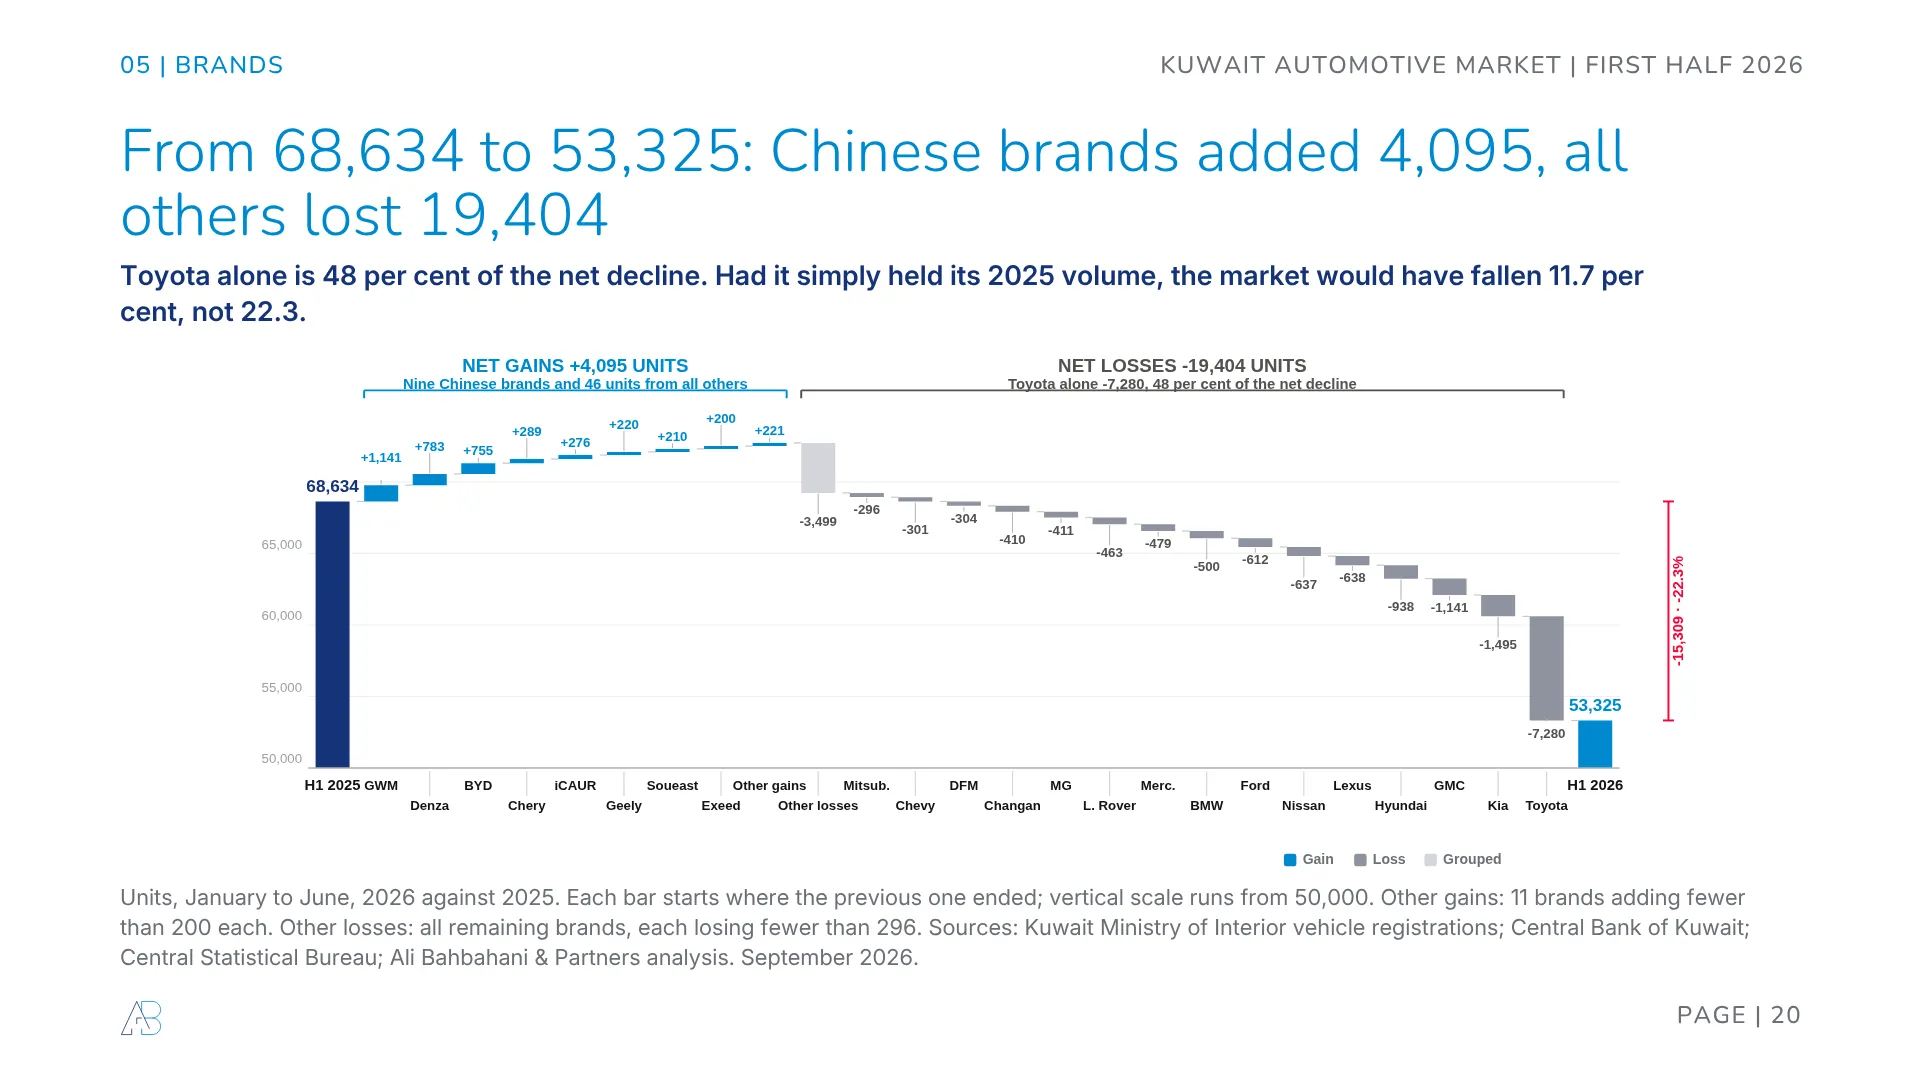
Decompose the 15,309 unit fall and the concentration is startling. Chinese brands added 4,095 units. Everybody else lost 19,404. Toyota alone accounts for 7,280 of that, which is 48 per cent of the entire net decline of the Kuwaiti car market.
Had Toyota simply held its 2025 volume, Kuwait would have reported a fall of 11.7 per cent rather than 22.3.
Which brings the question every distributor in Kuwait should be asking this quarter. How much of my fall reverses when the ships come back?
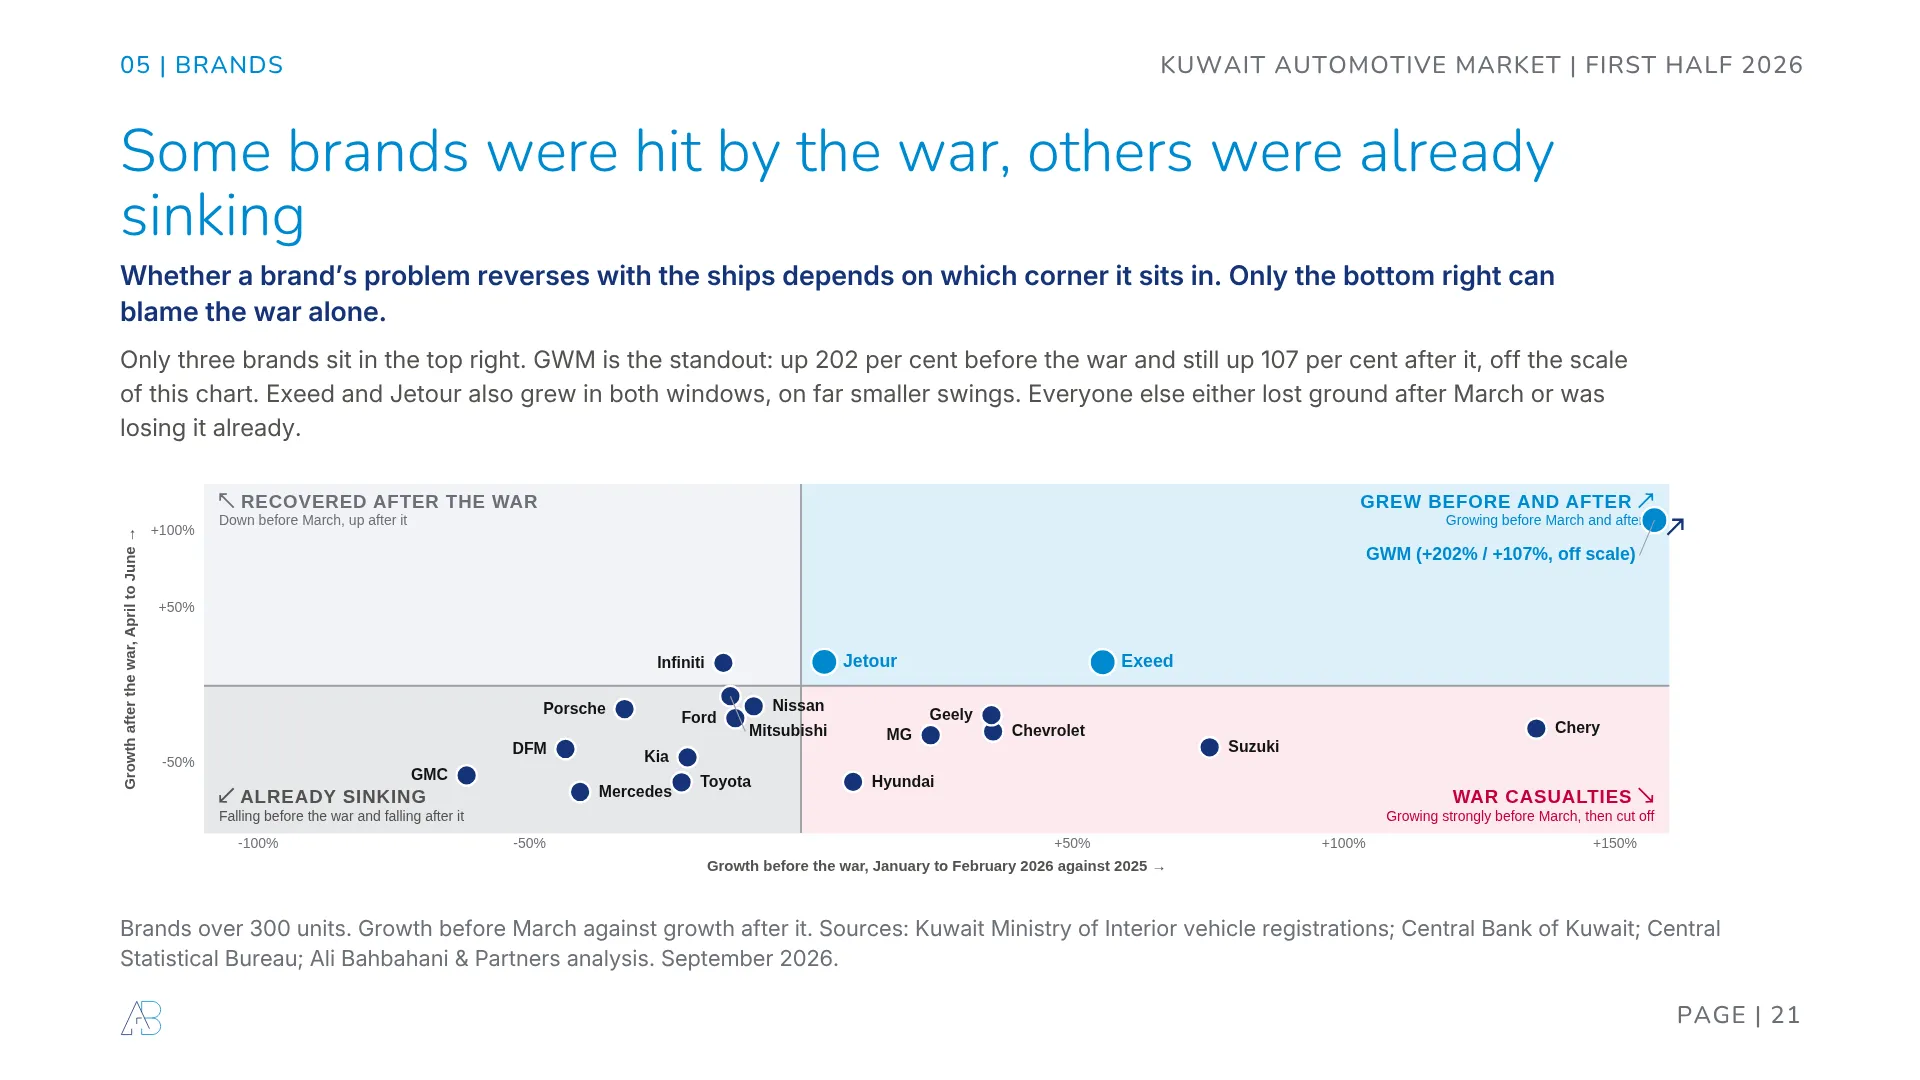
Plot growth before March against growth after it and each brand lands in one of four corners. Only the bottom right can blame the war alone. Only three brands sit in the top right, growing in both windows: GWM, up 202 per cent before and still up 107 per cent after, plus Exeed and Jetour on much smaller swings. Everyone else either lost ground after March or was already losing it.
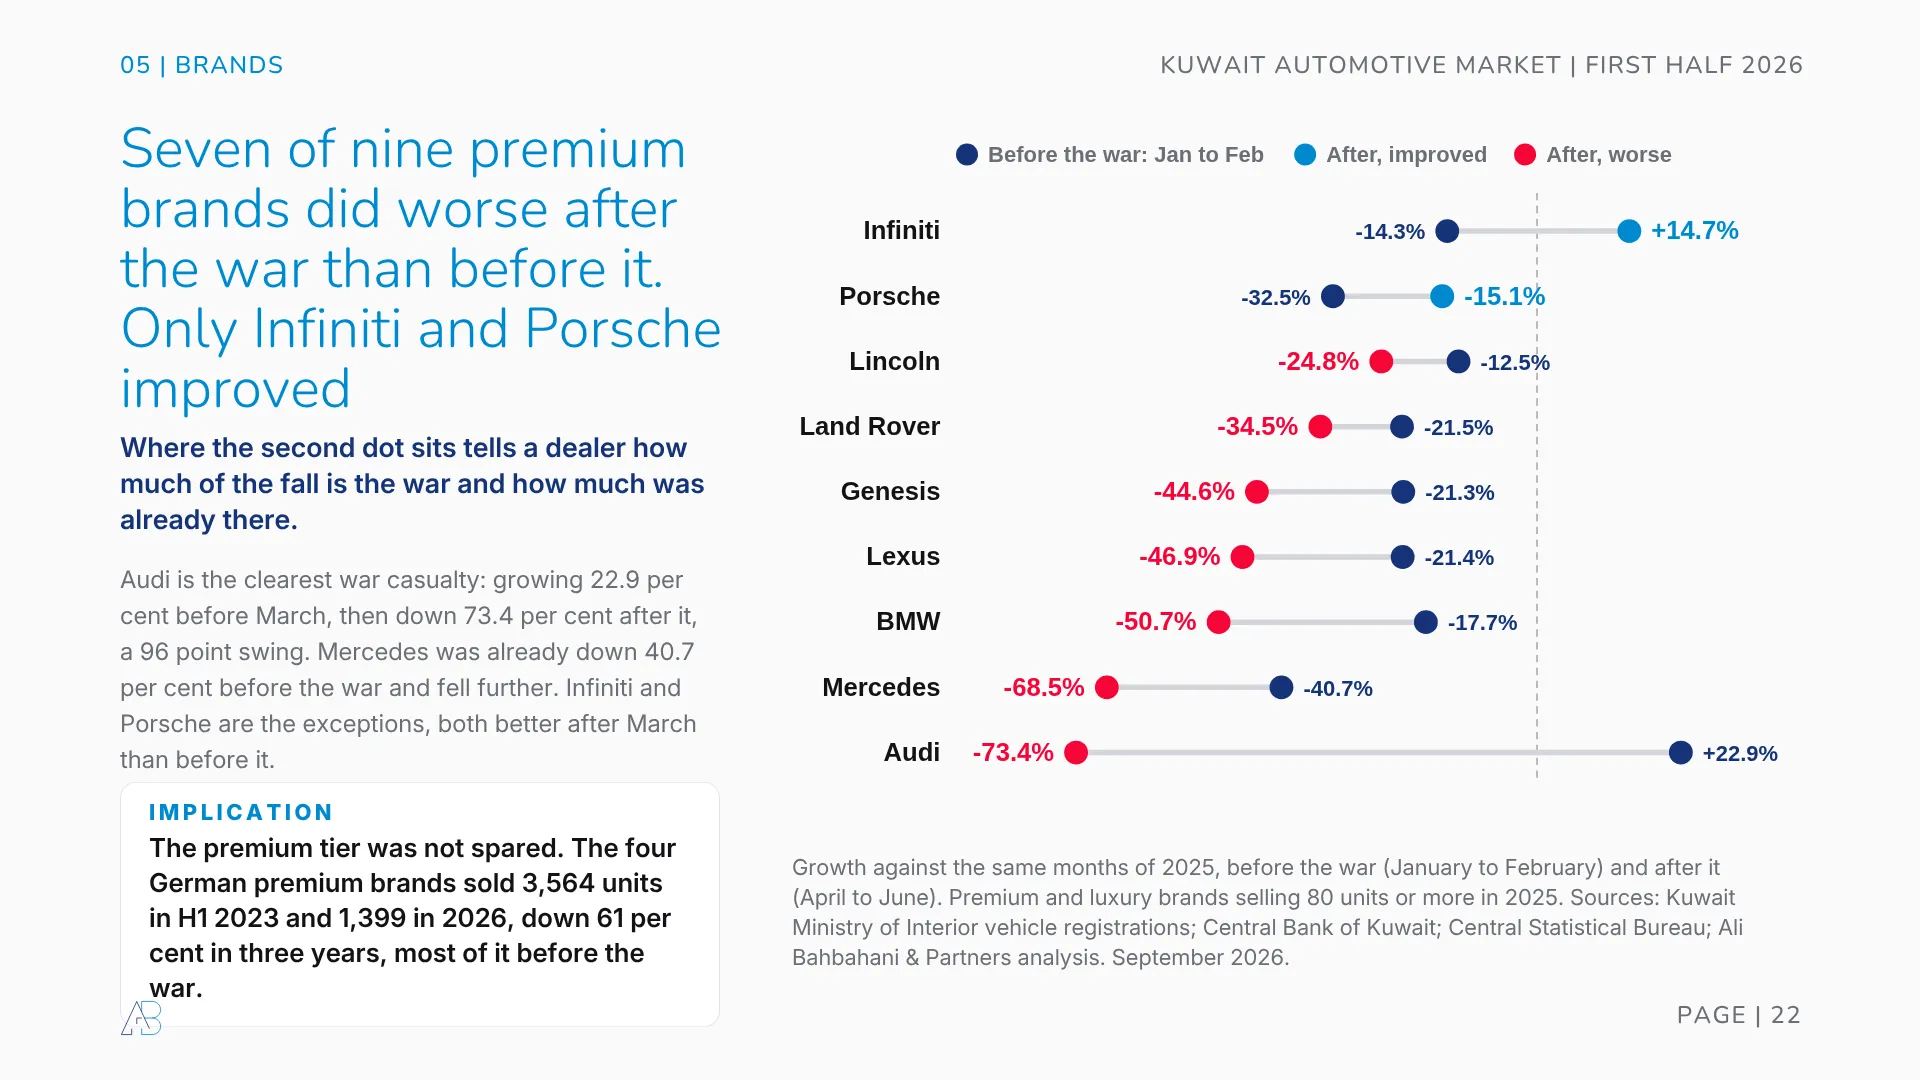
The premium end tells the same story with different names. Seven of the nine premium and luxury brands did worse after the war than before it. Audi is the clearest war casualty: growing 22.9 per cent before March, then down 73.4 after it, a swing of 96 points. Mercedes was already down 40.7 per cent before the war and fell further to 68.5. Only Infiniti and Porsche improved.
The longer view is harsher than the war view. The four German premium brands sold 3,564 vehicles in the first half of 2023 and 1,399 in 2026, down 61 per cent in three years, and most of that happened before anyone closed a strait. Kuwait’s appetite for expensive things has not gone, as our study of the Kuwaiti watch market shows. It has moved.
The structural change is fragmentation
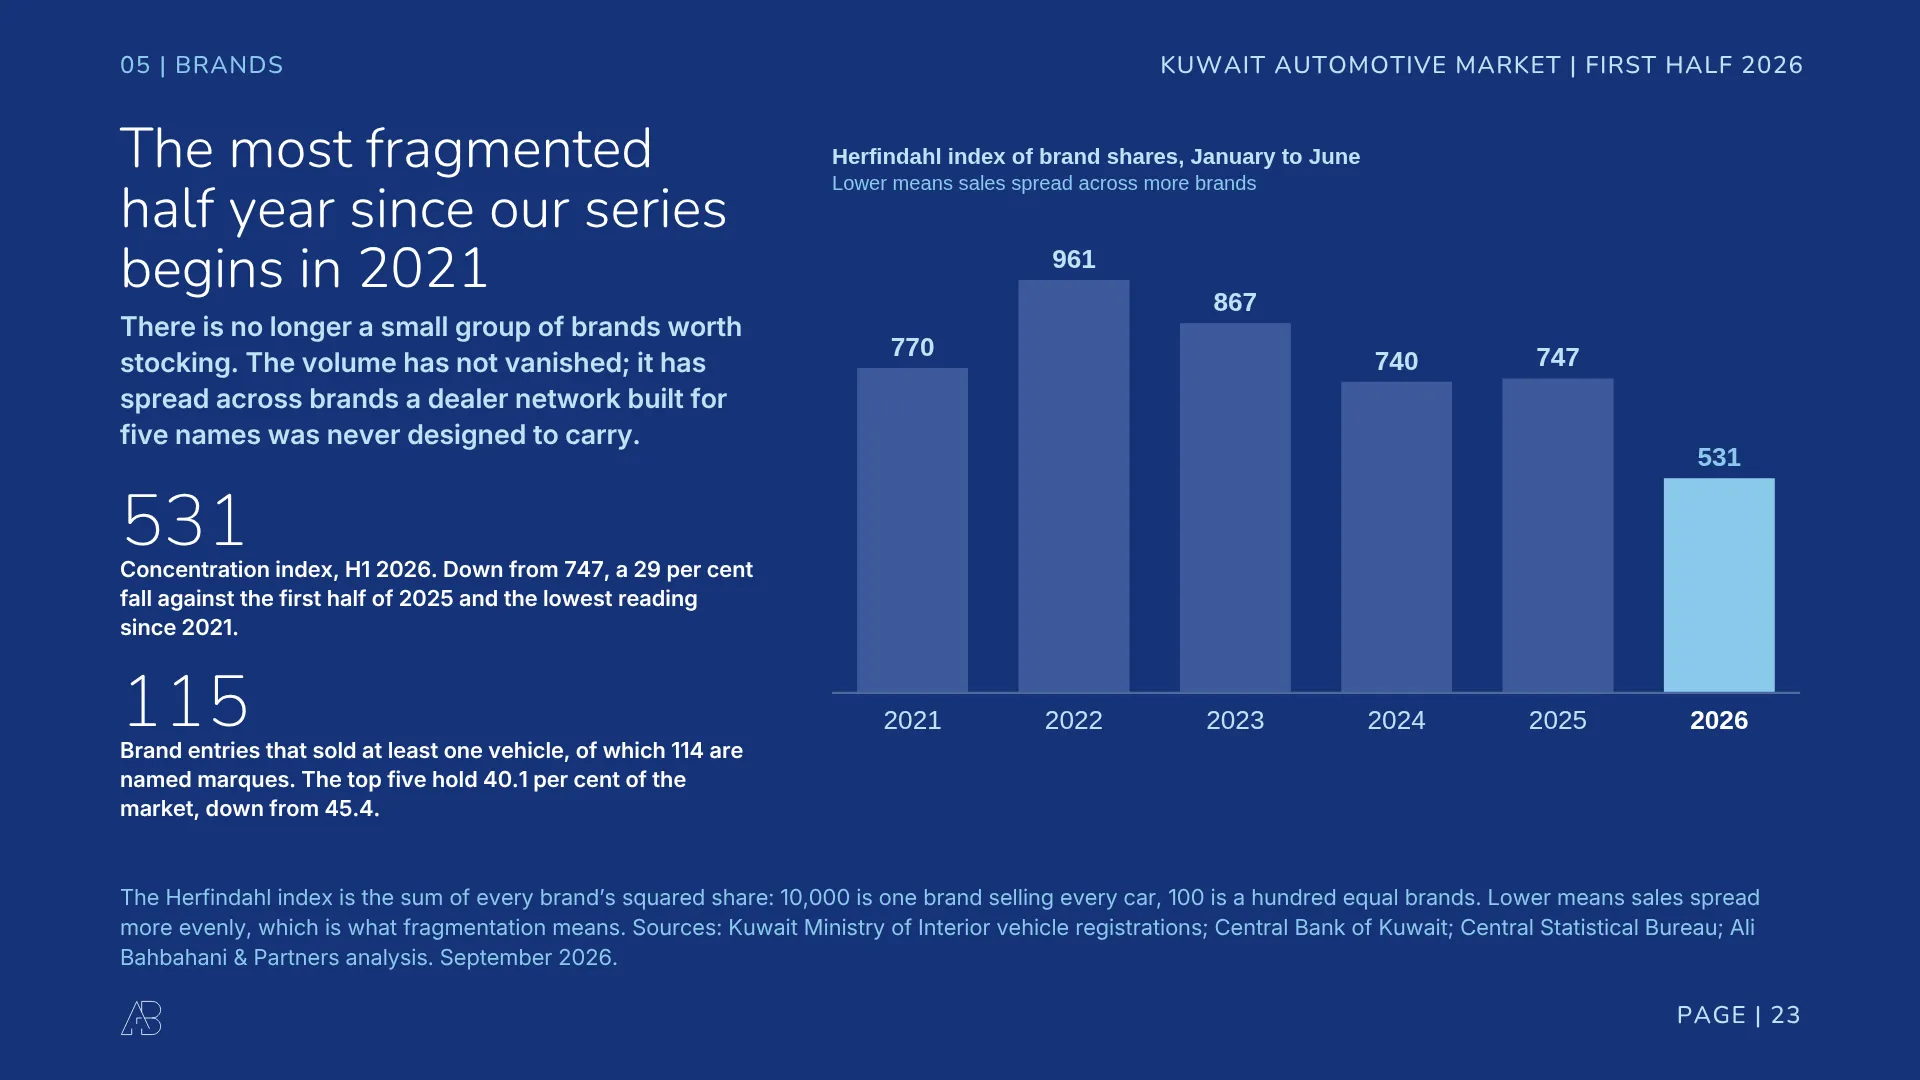
The Herfindahl index of brand shares, which is simply the sum of every brand’s squared share, fell from 747 to 531. That is a fall of 29 per cent and the lowest reading since our series begins in 2021. It peaked at 961 in 2022.
115 brand entries sold at least one vehicle in Kuwait this half year, of which 114 are named marques. The top five hold 40.1 per cent of the market, down from 45.4.
This is the change that does not reverse when shipping normalises. The volume has not vanished. It has spread across more brands than a Kuwaiti dealer network built around five names was ever designed to carry, and that has consequences for stocking, aftersales capacity and showroom economics that no import recovery will fix. A chart on how far individual brands now lean on a single nameplate is in the appendix.
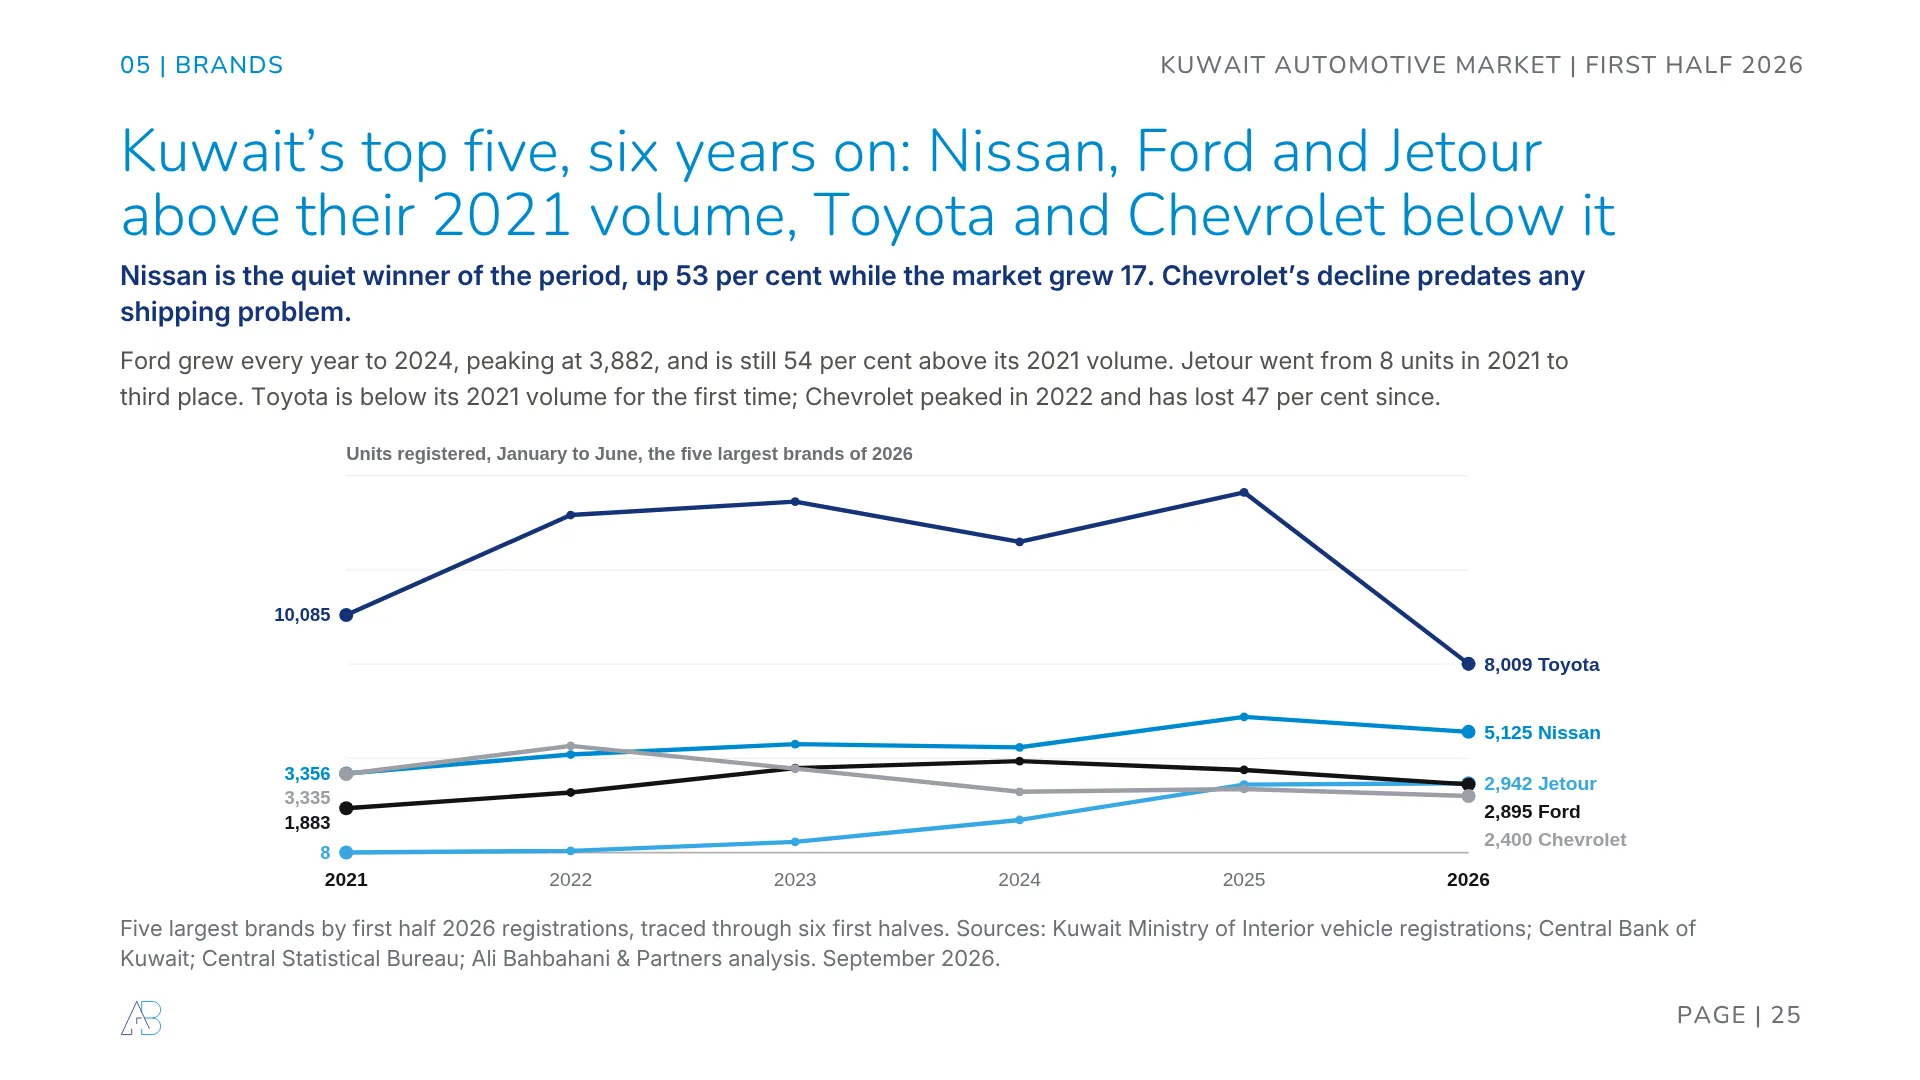
Trace the five largest brands of 2026 back through six first halves and the war stops looking like the main character. Nissan is the quiet winner of the period, up 53 per cent since 2021 while the market grew 17. Ford grew every year to 2024, peaked at 3,882 and is still 54 per cent above its 2021 volume. Jetour went from eight units in 2021 to third place. Toyota is below its 2021 volume for the first time. And Chevrolet peaked back in 2022 at 4,527 units and has lost 47 per cent since, a decline that started four years before anyone closed a strait.
And then there is the pipeline, which is the number we would put in front of any board that still thinks this is a shipping story.
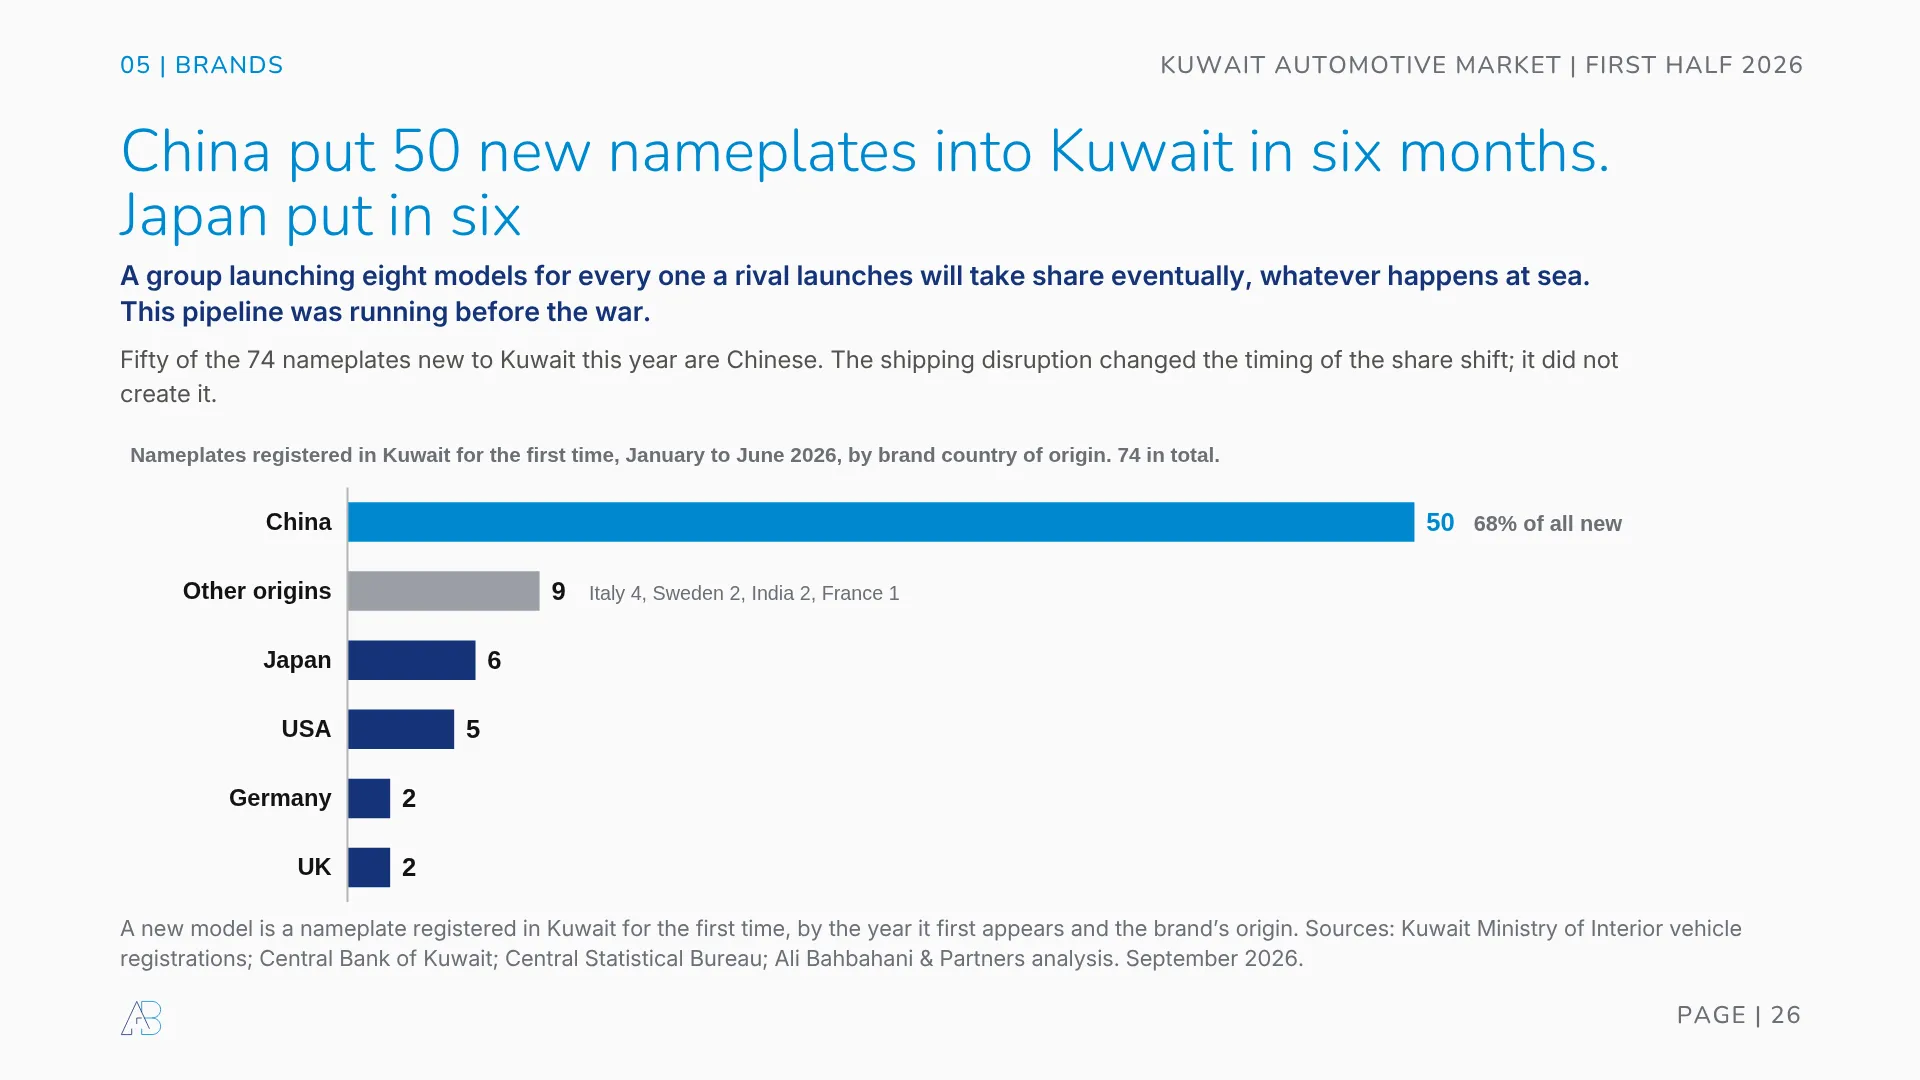
74 nameplates appeared in Kuwait for the first time in the first half of 2026. Fifty of them are Chinese. Japan launched six, the United States five, Germany two and Britain two.
A group launching eight models for every one a rival launches will take share eventually, whatever happens at sea. That pipeline was loaded before February, and it is not sensitive to insurance premiums or sailing slots. Product cadence and connected car features are where these brands compete hardest, which we covered in the race for car connectivity.
Down a size and out of luxury badges
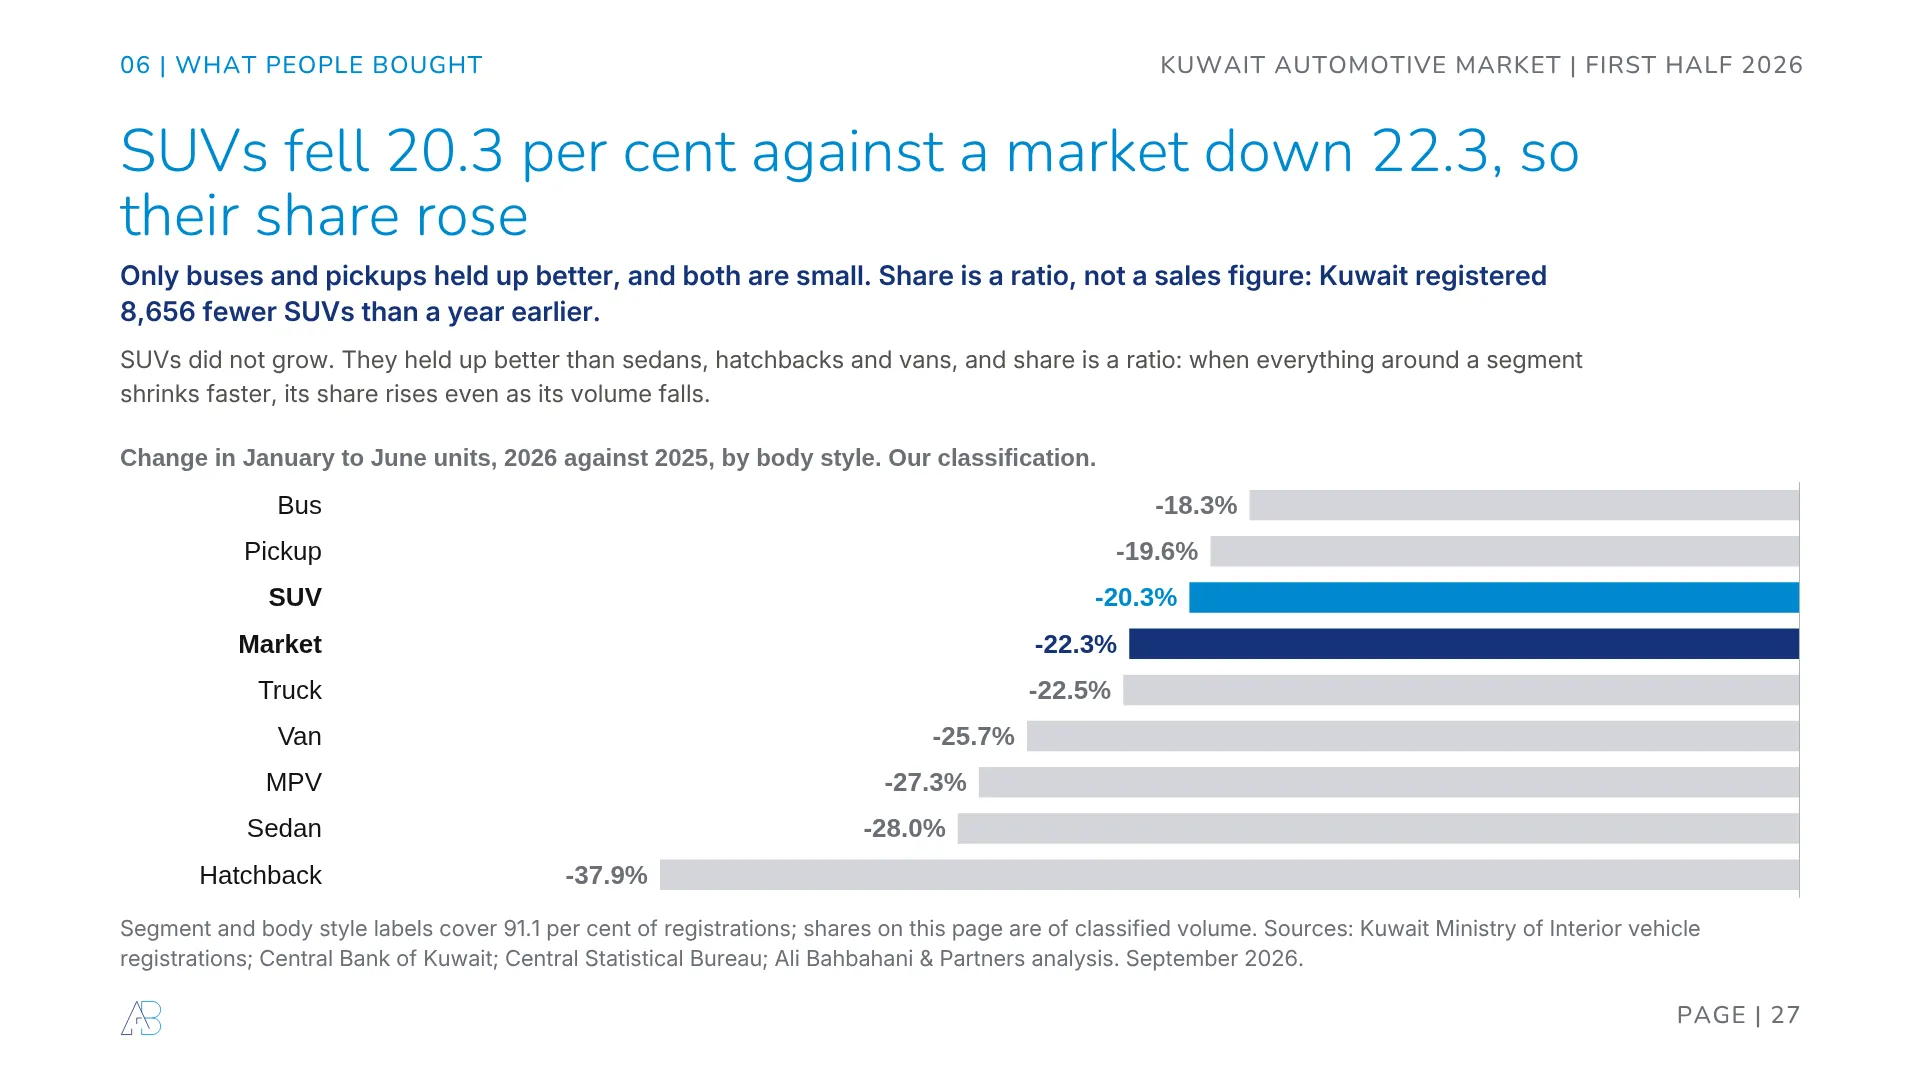
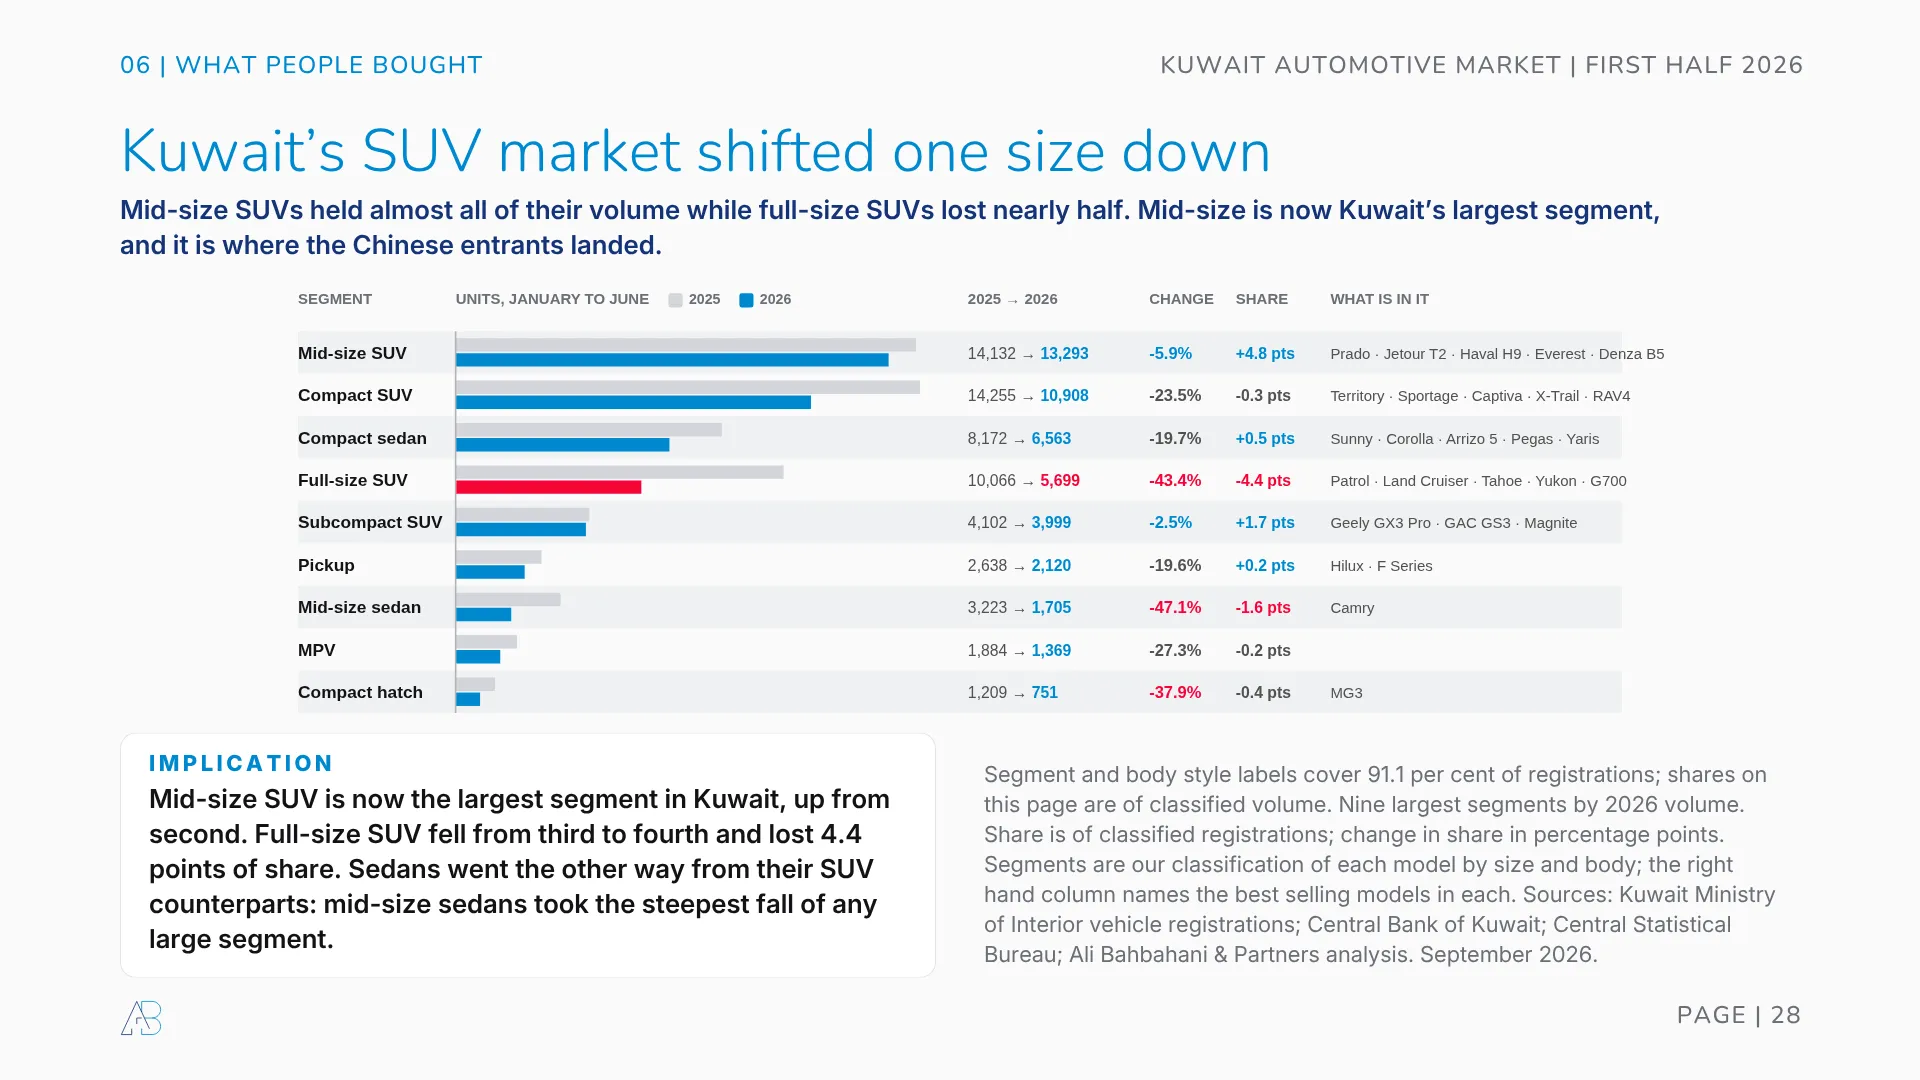
Start with the correction, because this is the statistic that gets repeated wrongly every year. SUVs fell 20.3 per cent against a market down 22.3, so their share rose. They did not grow. Kuwait registered 8,656 fewer SUVs than a year earlier. Share is a ratio, and when everything around a segment shrinks faster, its share rises even as its volume falls.
Only buses and pickups held up better, at down 18.3 and 19.6 per cent, and both are small. Hatchbacks took the worst of it at down 37.9.
Inside the SUV category, Kuwait shifted one size down. Mid-size SUVs held almost all of their volume, at 13,293 units and down 5.9 per cent. Full-size SUVs lost nearly half, at 5,699 and down 43.4. Mid-size SUV is now the largest segment in Kuwait, up from second, and it is exactly where the Chinese entrants landed.
Sedans went the other way from their SUV counterparts. Mid-size sedans took the steepest fall of any large segment at 47.1 per cent, while compact sedans fell only 19.7 and gained share.
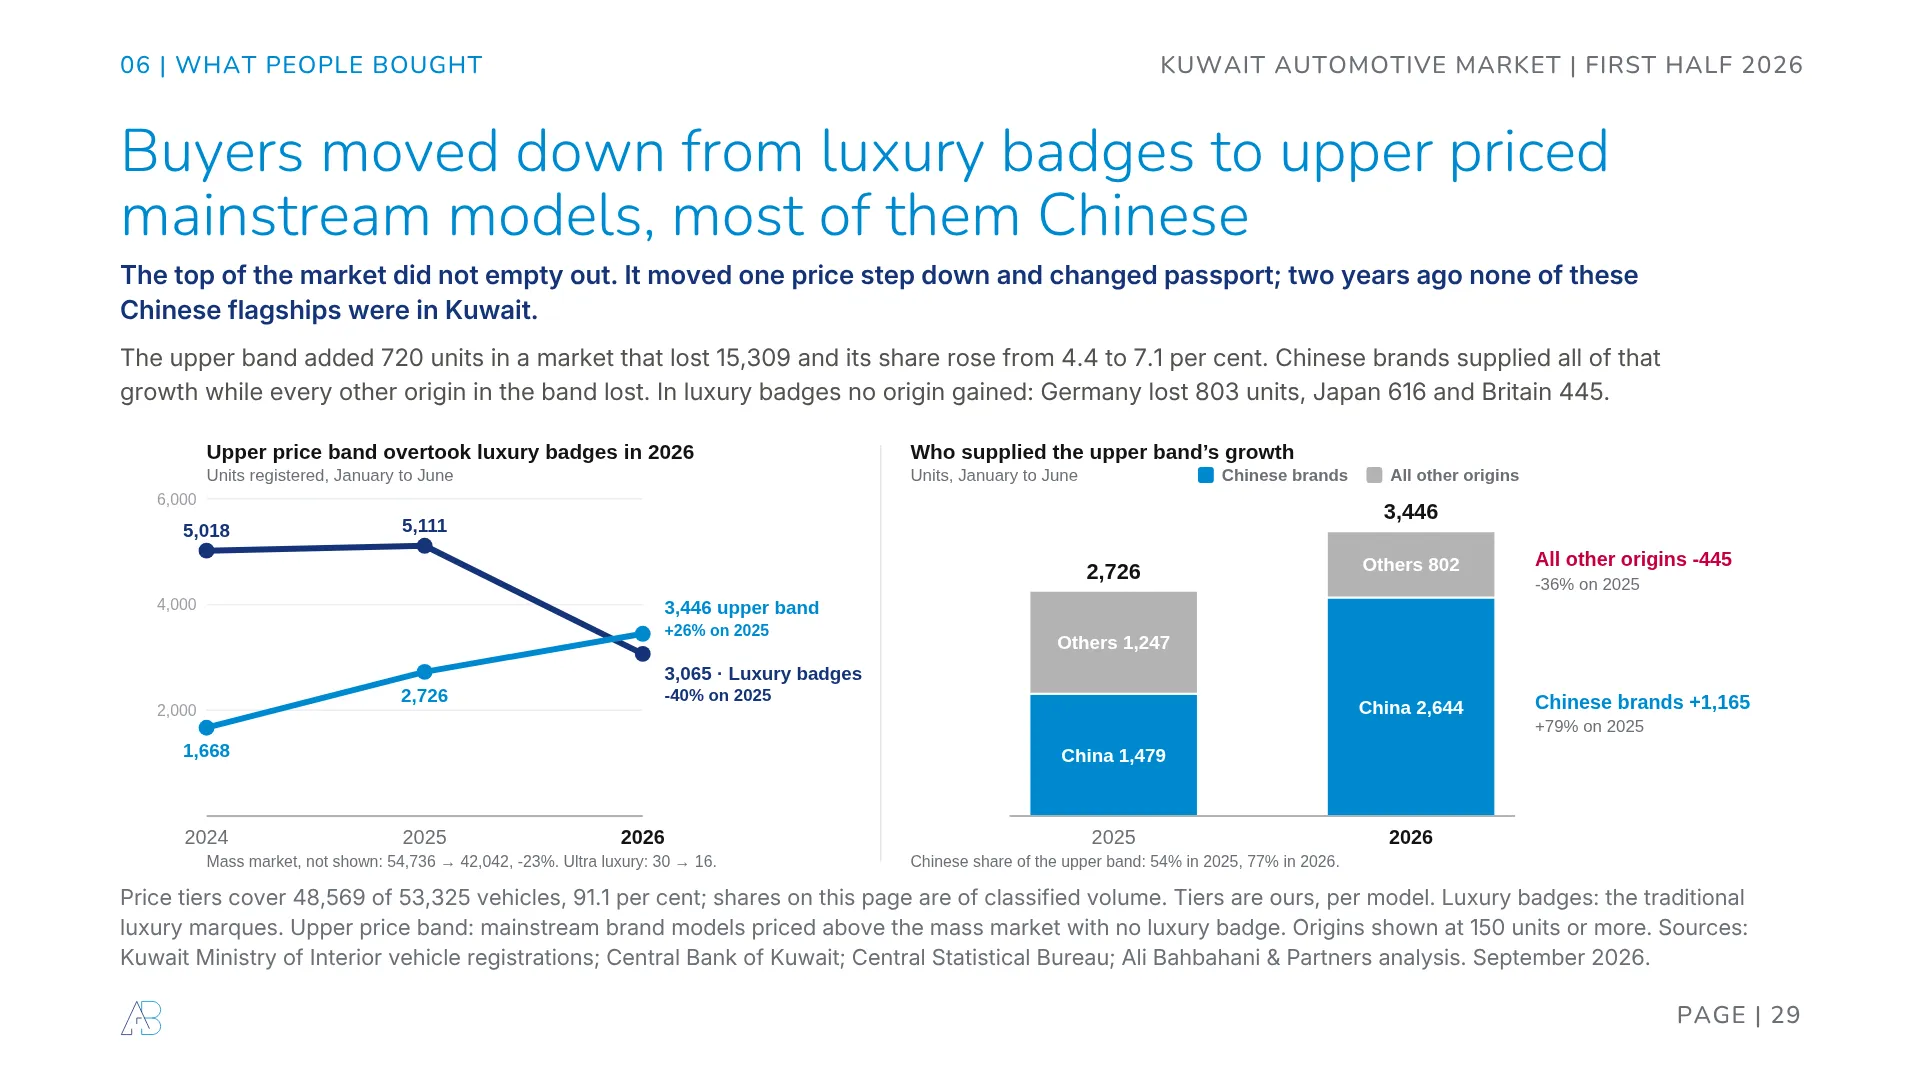
The price tier picture is the one that will surprise people who assume a downturn empties the top of the market.
The upper price band added 720 units in a market that lost 15,309. It reached 3,446 vehicles, up 26 per cent, and its share rose from 4.4 per cent to 7.1. Luxury badges fell 40 per cent to 3,065. For the first time, upper priced mainstream cars outsold luxury badges in Kuwait.
Chinese brands supplied all of that growth: 1,479 units in 2025 became 2,644 in 2026, up 79 per cent, taking their share of the band from 54 per cent to 77. Every other origin in the band lost. In luxury badges no origin gained at all: Germany lost 803 units, Japan 616 and Britain 445. Two years ago none of these Chinese flagships were on sale in Kuwait.
The Patrol outsold the Land Cruiser
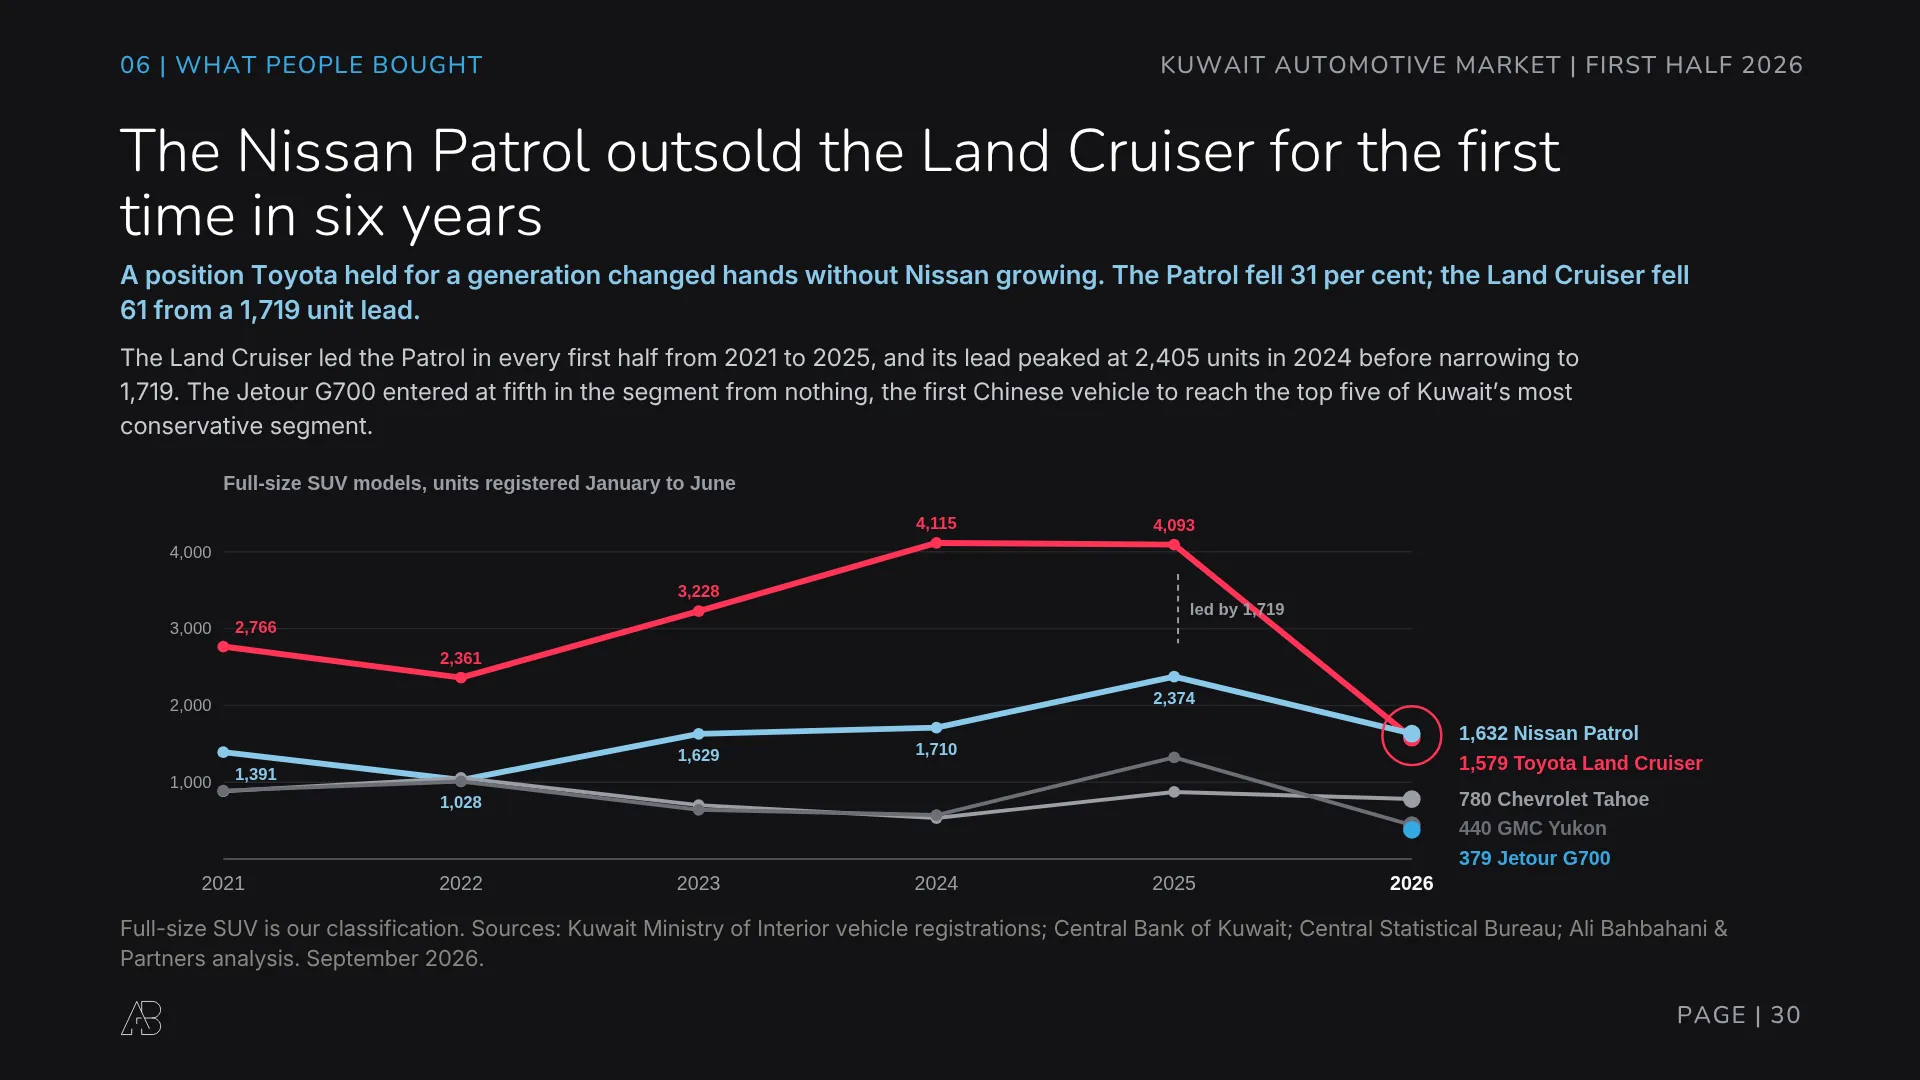
A position Toyota held for a generation changed hands, and Nissan did not have to grow to take it. The Patrol registered 1,632 units, down 31 per cent. The Land Cruiser registered 1,579, down 61 per cent from 4,093.
The Land Cruiser had led the Patrol in every first half from 2021 to 2025, and its lead peaked at 2,405 units in 2024 before narrowing to 1,719. The other new fact in this segment is the Jetour G700, which entered at fifth from nothing, the first Chinese vehicle to reach the top five of Kuwait’s most conservative segment.
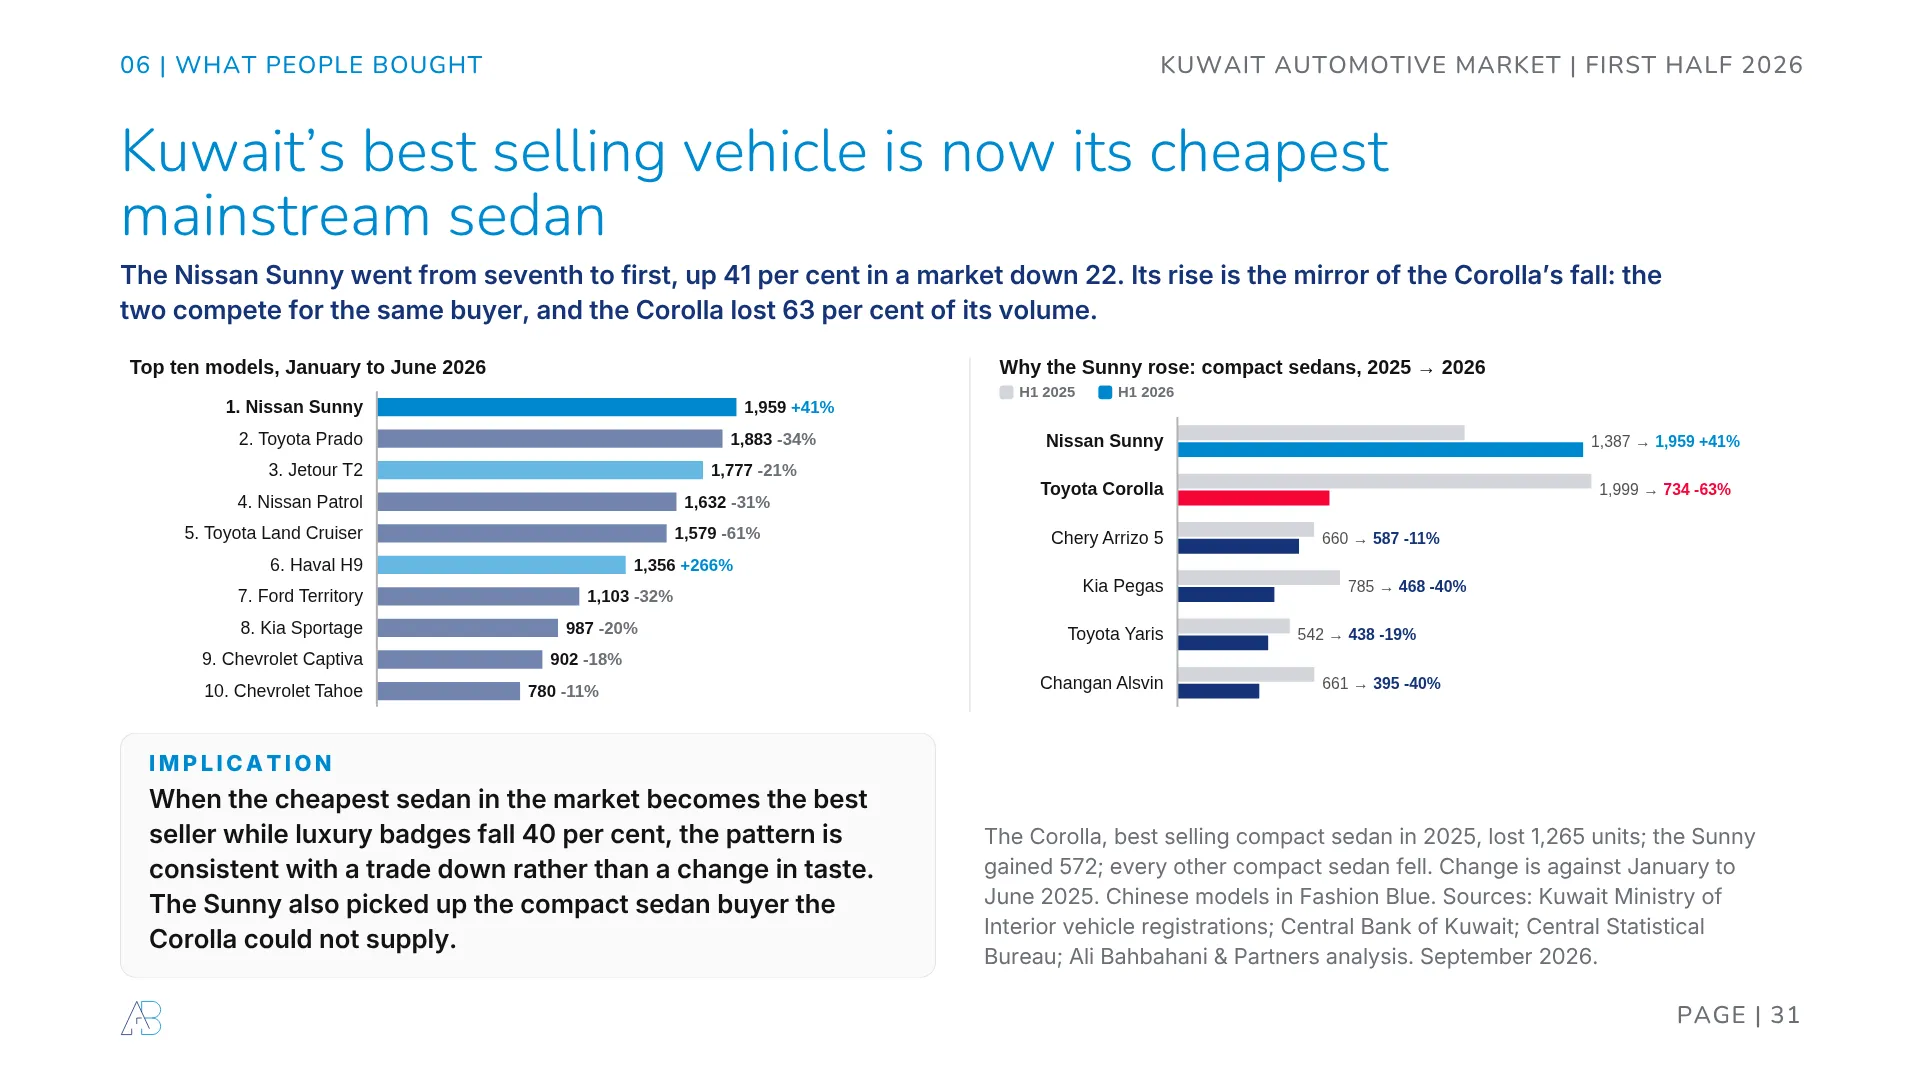
At the very top of the table, Kuwait’s best selling vehicle is now its cheapest mainstream sedan. The Nissan Sunny went from seventh to first, up 41 per cent to 1,959 units, in a market down 22.
Its rise is the mirror image of the Corolla’s fall. The two compete for the same buyer, and the Corolla lost 63 per cent of its volume, from 1,999 to 734. Every other compact sedan fell: the Arrizo 5 by 11 per cent, the Pegas by 40, the Yaris by 19, the Alsvin by 40. The Sunny was the only one that grew while the segment’s biggest seller lost 1,265 units, which is the shape you would expect if that buyer moved rather than left.
When the cheapest sedan in the market becomes the best seller while luxury badges fall 40 per cent, the pattern is consistent with a trade down rather than a change in taste. It matches what we found about household budgets in the Kuwaiti dream, priced.
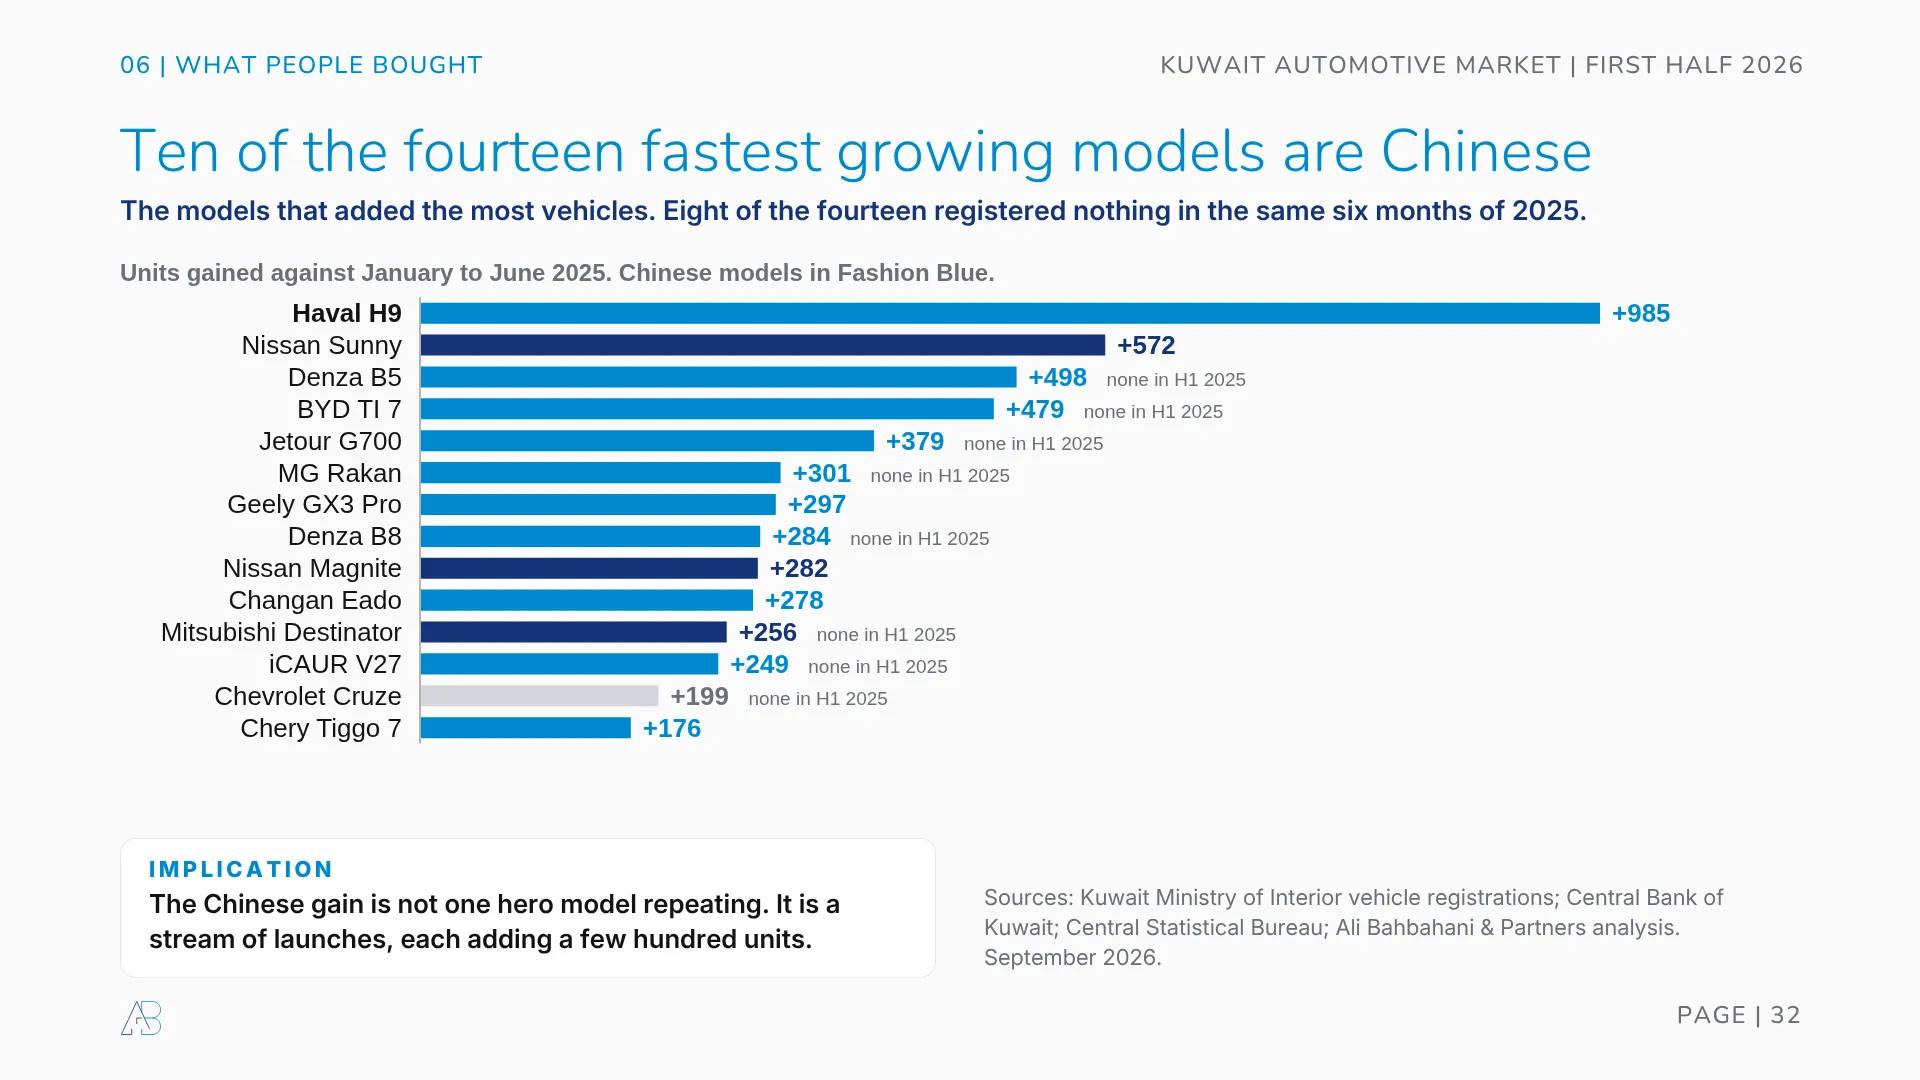
Ten of the fourteen fastest growing models in Kuwait are Chinese, and eight of the fourteen registered nothing at all in the same six months of 2025. The Haval H9 added 985 units, the Denza B5 498, the BYD TI 7 479, the Jetour G700 379.
Note the shape of that list. The Chinese gain is not one hero model repeating. It is a stream of launches, each adding a few hundred units, which is a far harder thing for an incumbent to defend against.
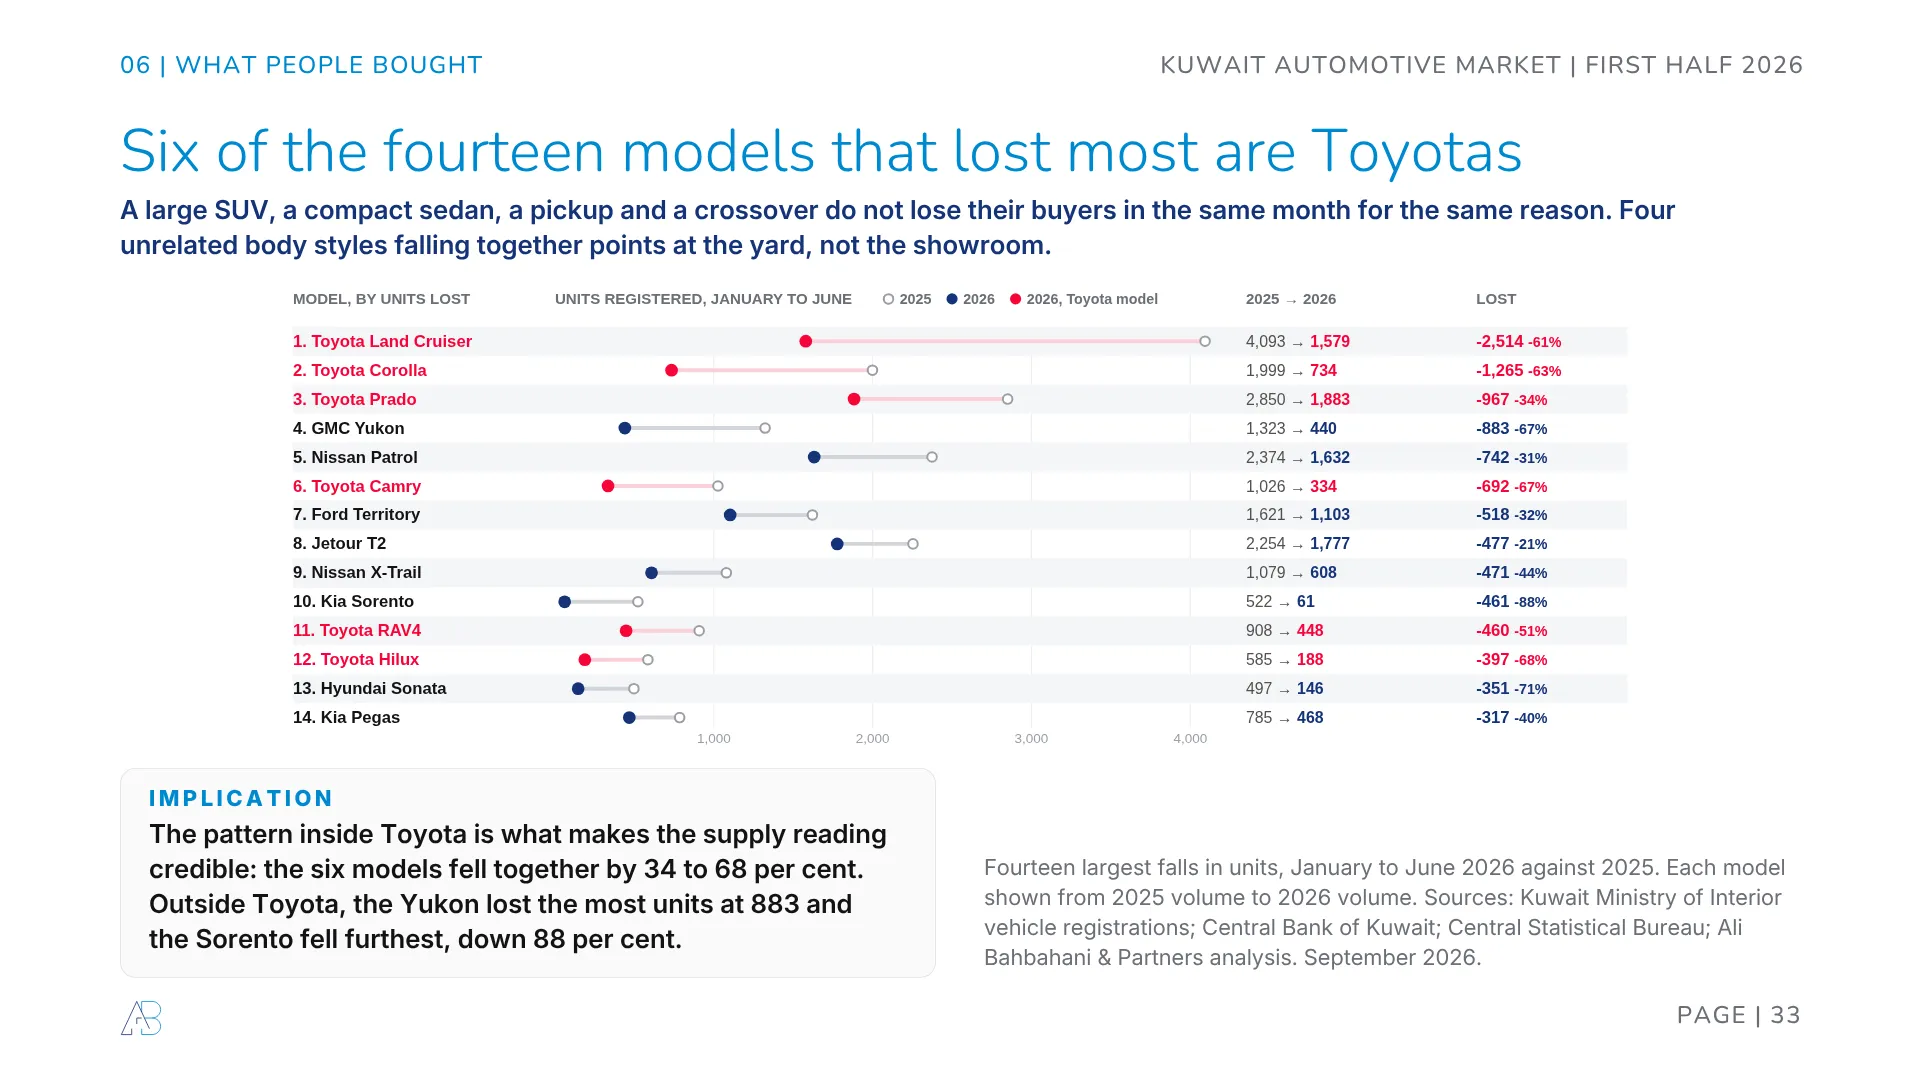
On the other side of the ledger, six of the fourteen models that lost most are Toyotas.
The Land Cruiser lost 2,514 units, the Corolla 1,265, the Prado 967, the Camry 692, the RAV4 460 and the Hilux 397. Outside Toyota, the GMC Yukon lost the most units at 883, and the Kia Sorento fell furthest, down 88 per cent to 61 vehicles.
Here is why that matters for the supply reading. A large SUV, a compact sedan, a pickup and a crossover do not lose their buyers in the same month for the same reason. Four unrelated body styles falling together, by 34 to 68 per cent, points at the yard rather than the showroom.
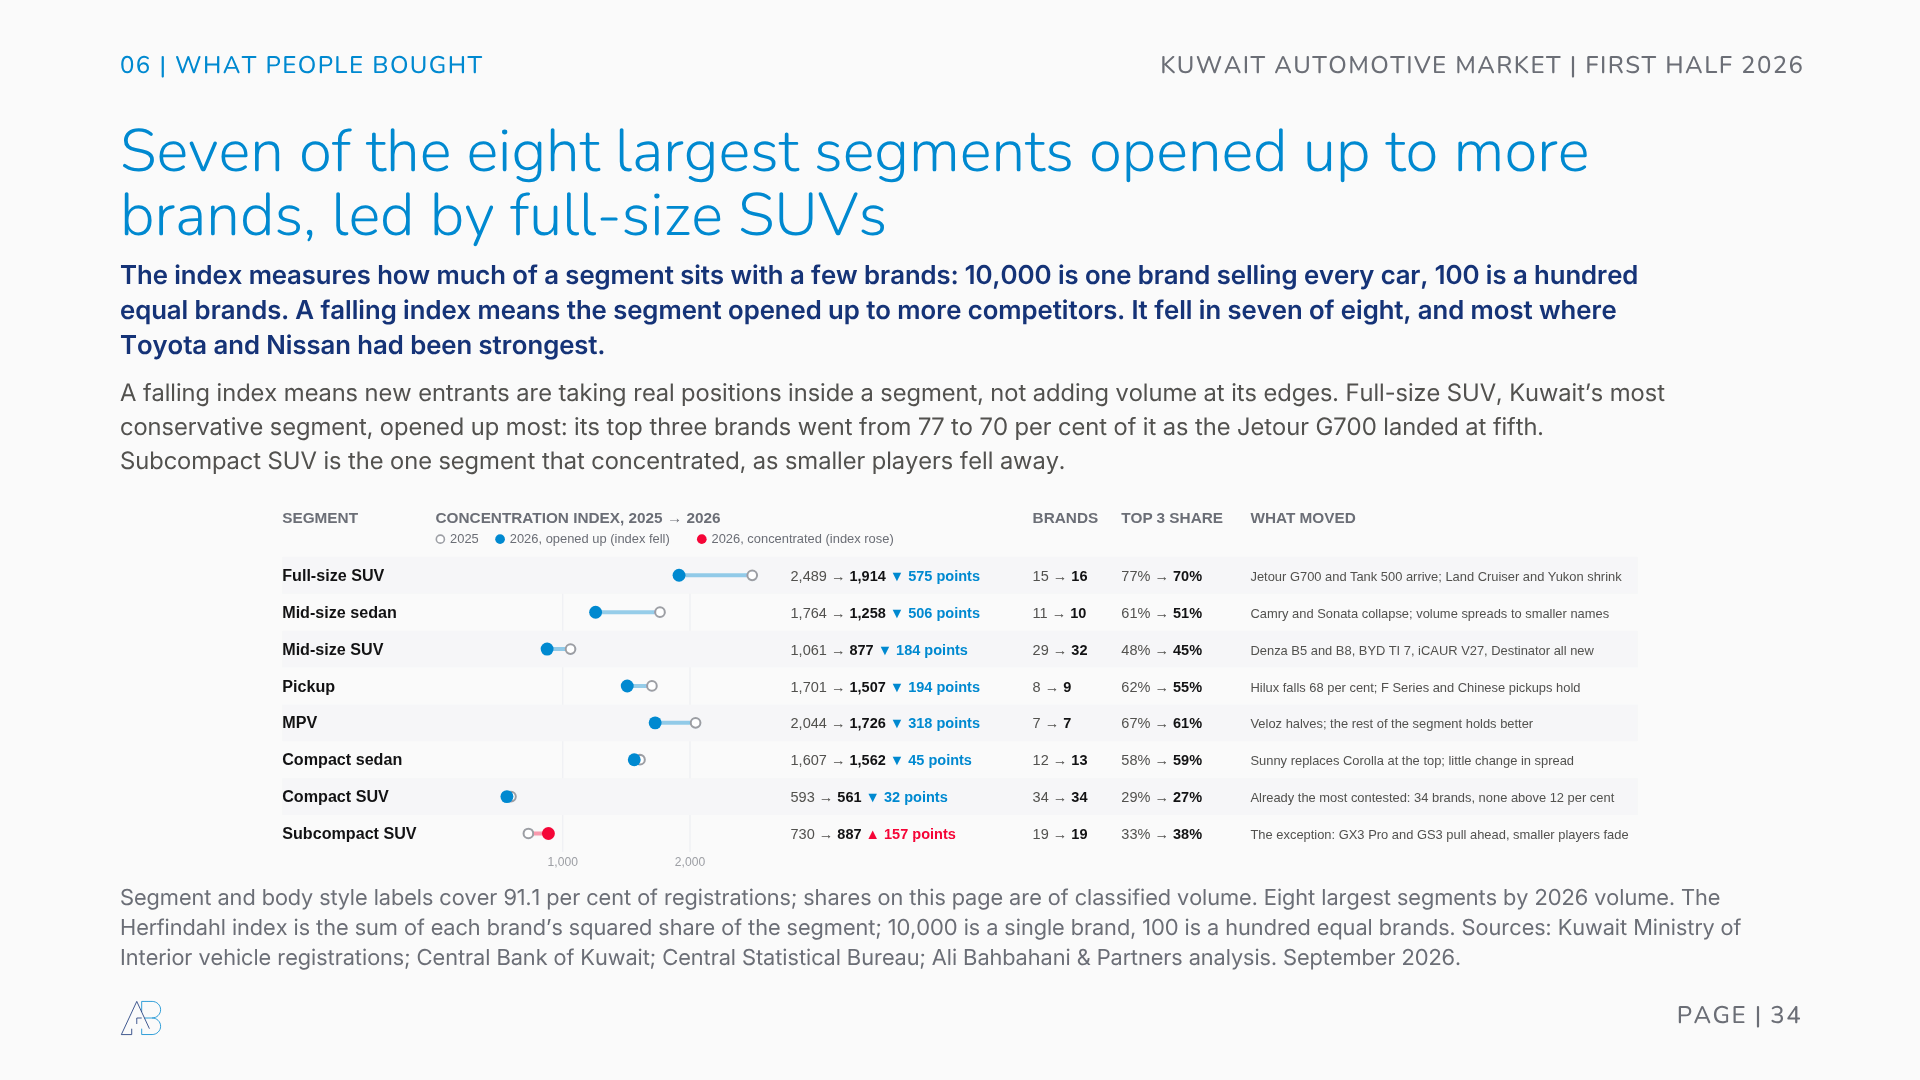
Underneath the model table, seven of the eight largest segments opened up to more brands. The concentration index fell most in full-size SUV, Kuwait’s most conservative segment, where the top three brands went from 77 per cent of it to 70 as the Jetour G700 and the Tank 500 arrived. Mid-size SUV went from 29 brands to 32. Subcompact SUV is the single exception, concentrating as smaller players fell away. The segment by segment table is in the appendix, and the regional version of the same pattern is in the GCC car rankings.
One last cut, and it is the one that needs no classification of ours, because the category is written on the licence by the Ministry of Interior.
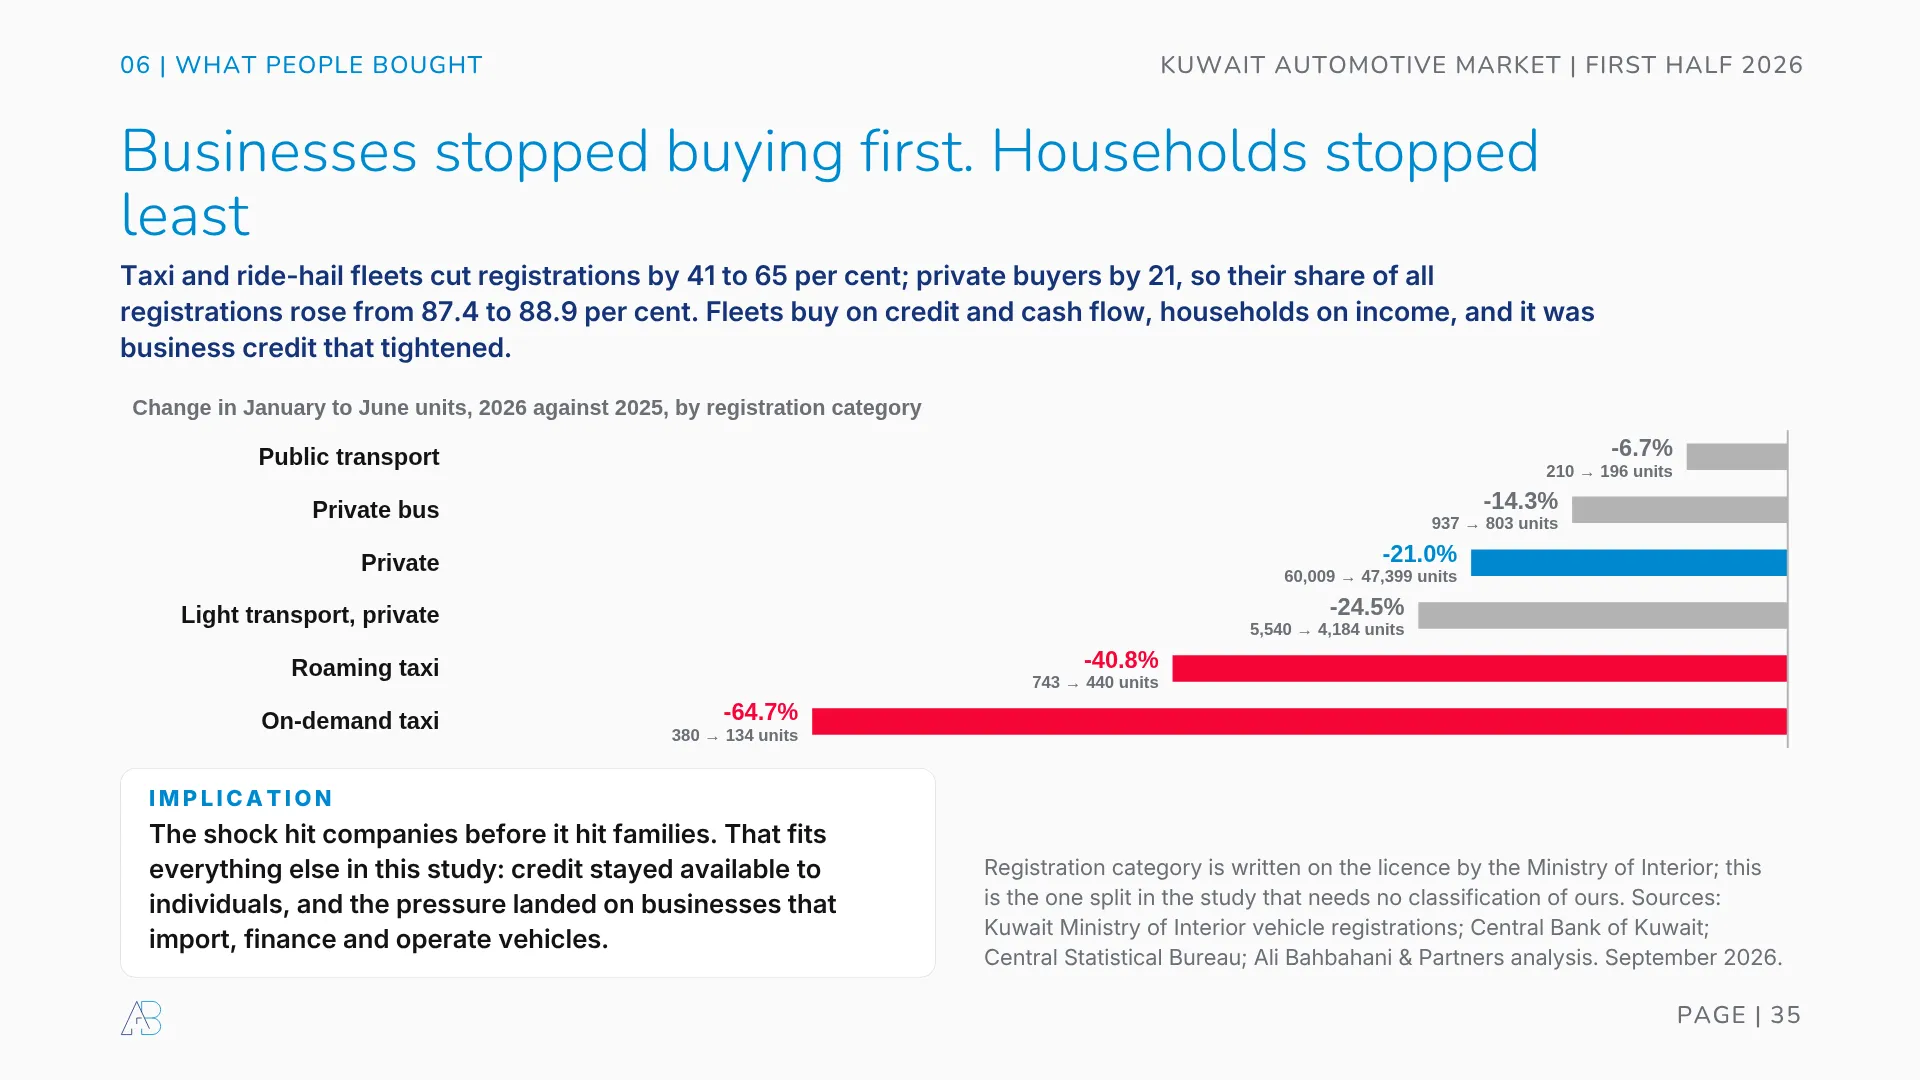
Businesses stopped buying first. On-demand taxi registrations fell 64.7 per cent and roaming taxis 40.8. Light transport for private use fell 24.5. Private registrations fell 21.0, the smallest fall of any meaningful category, and the private share of all registrations rose from 87.4 per cent to 88.9.
Fleets buy on credit and cash flow. Households buy on income. It was business credit that tightened, and it was businesses that had to carry the insurance and the three month float.
What holds, and the two numbers to watch
Eight things survive the analysis.
- The market lost a year, not a decade. 53,325 units sits just below the 2022 level, and June recovered to a fall of 20.9 per cent from May’s 36.9. The direction at the half year line is up.
- The rotation was already running. Chinese brands grew 36.3 per cent before the war. Expecting the old order to return is a mistake.
- The constraint was shared, the starting position was not. 24 of 30 comparable brands lost growth after March. Chinese brands lost more of it and still finished up.
- Growth is now entirely Chinese. Thirteen brands added 50 units or more. All thirteen.
- Down a size and out of luxury badges. Full-size SUVs fell 43 per cent, mid-size 6. Luxury badges fell 40 while the upper price band grew 26, all of it Chinese.
- Toyota is two problems, not one. 48 per cent of the decline. The shipping half reverses with the ships. The 22 per cent it was already carrying does not.
- Fragmentation is the structural change. The concentration index fell 29 per cent. 114 named marques sold at least one vehicle. A network built for five brands holding 45 per cent is not built for this.
- The buyer never left. Card spending held, consumer credit held, and the pressure landed on the businesses that import, finance and operate vehicles.
Now the honest limit. Registration data cannot separate a buyer who chose not to buy from a buyer who found nothing to buy. Every supply claim above is a hypothesis supported by converging evidence, not a proven finding. Two indicators will settle it, and they are the two we would watch instead of trying to forecast a 2027 volume.
Monthly import payment orders, watching for a return towards KD 600m. The pre-war run rate was KD 665m to 690m a month. June read KD 59m. Goods arriving again will show here first, weeks before any registration figure moves, and this is the indicator that tells you the sailing slot problem is easing.
Toyota’s 22 per cent pre-war decline. The 40 point swing after March should reverse when shipping normalises. Whatever part of Toyota’s decline still sits near 22 per cent once it does was never supply, and that is the number that decides how Kuwait’s largest franchise plans 2027.
A blocked strait defers registrations. It does not delete buyers.
What a dealer, importer or lender should do with this
Three decisions follow from the data rather than from the mood.
Separate your war loss from your structural loss before you plan 2027. The resilience chart above is the crude version of that split. The proper version needs your own order book, your landed inventory and your pre-February trend by model. If the answer is mostly war, you have a working capital problem, and the KD 600 a car and the three month float tell you roughly how big. If it is mostly structure, you have a portfolio problem. Those need opposite responses. This is the sort of question our feasibility work is built to answer with numbers rather than assertion.
Stock for 114 marques, not five. Fragmentation is the change that survives the shipping recovery. Parts depth, technician training, trade-in valuation and showroom floor economics were all sized for a market where the top five held 45 per cent. They hold 40 now, and the direction is one way. Redesigning that operating model is what strategic growth work normally starts with.
Fix the part of the funnel that has nothing to do with ships. A buyer who walked into a showroom in April and found nothing to deliver had every reason to look at another brand. In a market this short of stock, availability becomes part of the product. Knowing where that handover broke is a customer journey question, and we have written about the Kuwaiti version of it in mastering the automotive customer journey in Kuwait.
Three more cuts of the same data
These did not need to interrupt the argument, but they answer questions a dealer or a lender will have.
The sedan reversal is the striking part: up 7.4 per cent before March, down 47.3 after it, against SUVs at 24.8.
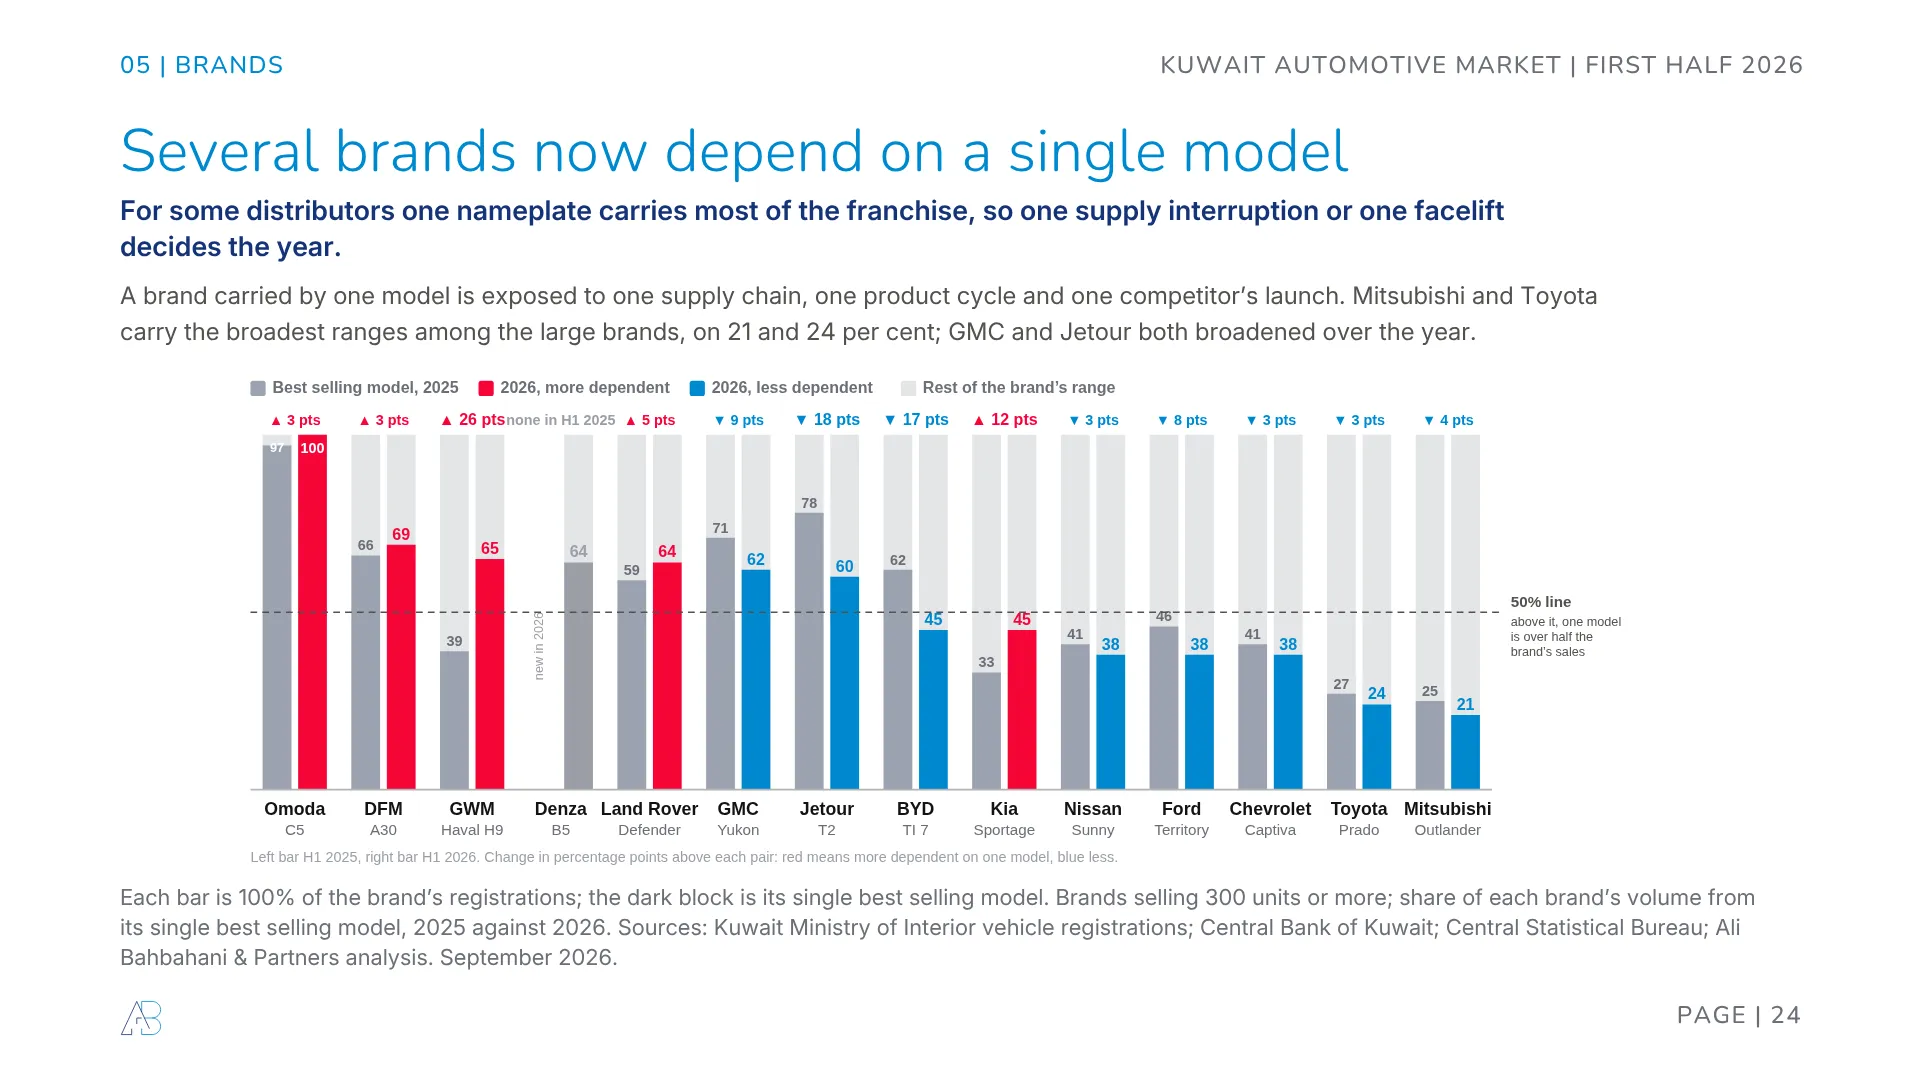
How far each brand leans on one nameplate. Omoda takes 100 per cent of its volume from the C5 and DFM 69 per cent from the A30. Mitsubishi and Toyota carry the broadest ranges among the large brands, on 21 and 24 per cent. One supply interruption or one facelift decides the year for anyone above that 50 per cent line.
Which segments opened up. Seven of the eight largest fell on the concentration index, meaning new entrants took real positions inside them rather than adding volume at the edges.
Questions people are asking
How many cars were sold in Kuwait in the first half of 2026?
Kuwait registered 53,325 vehicles between January and June 2026, down 22.3 per cent and 15,309 units on the same period of 2025. That is the weakest half year since 2021 and slightly below the 2022 level.
Why did car sales fall in Kuwait in 2026?
Mostly supply. The Strait of Hormuz closed to normal traffic on 28 February 2026 and the customs value of Kuwait’s vehicle imports fell 73.3 per cent in March, a steeper fall than any other import chapter. Bank payment orders for goods that had arrived fell 91 per cent between February and June while letters of credit for goods not yet shipped rose 19 per cent. Card spending inside Kuwait and consumer credit both held, so the fall is hard to read as households pulling back. We estimate the shock deferred about 10,815 registrations between March and June.
Which car brand sells most in Kuwait?
Toyota, with 8,009 vehicles in the first half of 2026 and a 15.0 per cent share, down from 22.3. Nissan is second on 5,125 and Jetour third on 2,942, the first Chinese brand to reach the Kuwaiti podium. Four of the top ten brands are now Chinese.
What was the best selling car in Kuwait in 2026?
The Nissan Sunny, on 1,959 units, up 41 per cent and up from seventh place a year earlier. The Toyota Prado was second on 1,883 and the Jetour T2 third on 1,777. The Toyota Corolla, which the Sunny competes with directly, lost 63 per cent of its volume.
Are Chinese cars taking over the Kuwait market?
They lead it on a half year basis for the first time. Chinese brands took 37.3 per cent of registrations against 36.1 for Japanese brands, having trailed by 35.8 points five years ago. Every brand that added 50 vehicles or more this year is Chinese, and 50 of the 74 nameplates new to Kuwait in 2026 are Chinese. Japan may still finish the full year ahead.
Did the Nissan Patrol outsell the Toyota Land Cruiser in Kuwait?
Yes, for the first time in six years. The Patrol registered 1,632 units and the Land Cruiser 1,579. Neither grew: the Patrol fell 31 per cent and the Land Cruiser 61, from a lead of 1,719 units in 2025.
How much did the shipping disruption add to the cost of a car in Kuwait?
War risk insurance alone has been running up to KD 600 a vehicle, and the wait for a sailing slot went from roughly one month to roughly three, with fewer cars carried per slot. Those are our own figures from the trade rather than published statistics, and other importers will have seen different numbers. Most of it has been absorbed by distributors so far, which is why list prices have not moved to match.
Method and sources
Sources. Ministry of Interior vehicle registration records. Credit, import finance and card data from the Central Bank of Kuwait Monthly Monetary Statistical Bulletin. Customs data from the Central Statistical Bureau Foreign Trade Statistics, January to March 2026, which is as far as the release runs. That is why the import chapter stops at March while registrations run to June.
Classification. Every brand origin, segment, body style and price tier here is ours, applied model by model, not taken from any supplier field. Segment and body labels cover 91.1 per cent of registrations and price tiers cover 48,569 of 53,325 vehicles, so shares on those exhibits are of classified volume. Registration category is the one split that needs no classification of ours, because the Ministry writes it on the licence.
What is estimated, and what is not audited. The 10,815 shortfall is modelled from the January and February run rate and the 2021 to 2025 month shape. Back-tested on 2022 through 2025 the method missed the actual outcome by at most nine per cent, so treat it as an estimate with that band around it, not a count. The KD 600 war risk premium and the change in sailing slot waits are our own observations from the trade, not published figures, and other importers will have seen different numbers. Registration records show what was plated, not what was wanted, which is why the supply argument rests on card, credit and customs data rather than on registrations alone. Not audited.
For the wider context this sits in, see our work on how Kuwait absorbed the war in March, on Kuwait’s economic potential, on the role of IPOs in Boursa Kuwait, and the orientation piece for anyone new to the market, the CEO’s guide to Kuwait. On the card data specifically: the credit card revolution, fifteen years of card spending growth and the revolution of spending.