How Kuwait Went from Cash to Digital in Ten Years

.webp)
Between 2015 and 2025, Kuwait’s payment system was completely rewired. Cash lost its dominance, online spending rose from a rounding error in 2019 to KD 17.5 billion, a new instant-transfer system captured 16 per cent of the market in twelve months, and total spending nearly tripled to KD 54.7 billion. This is the story the data tells.
Executive Synthesis
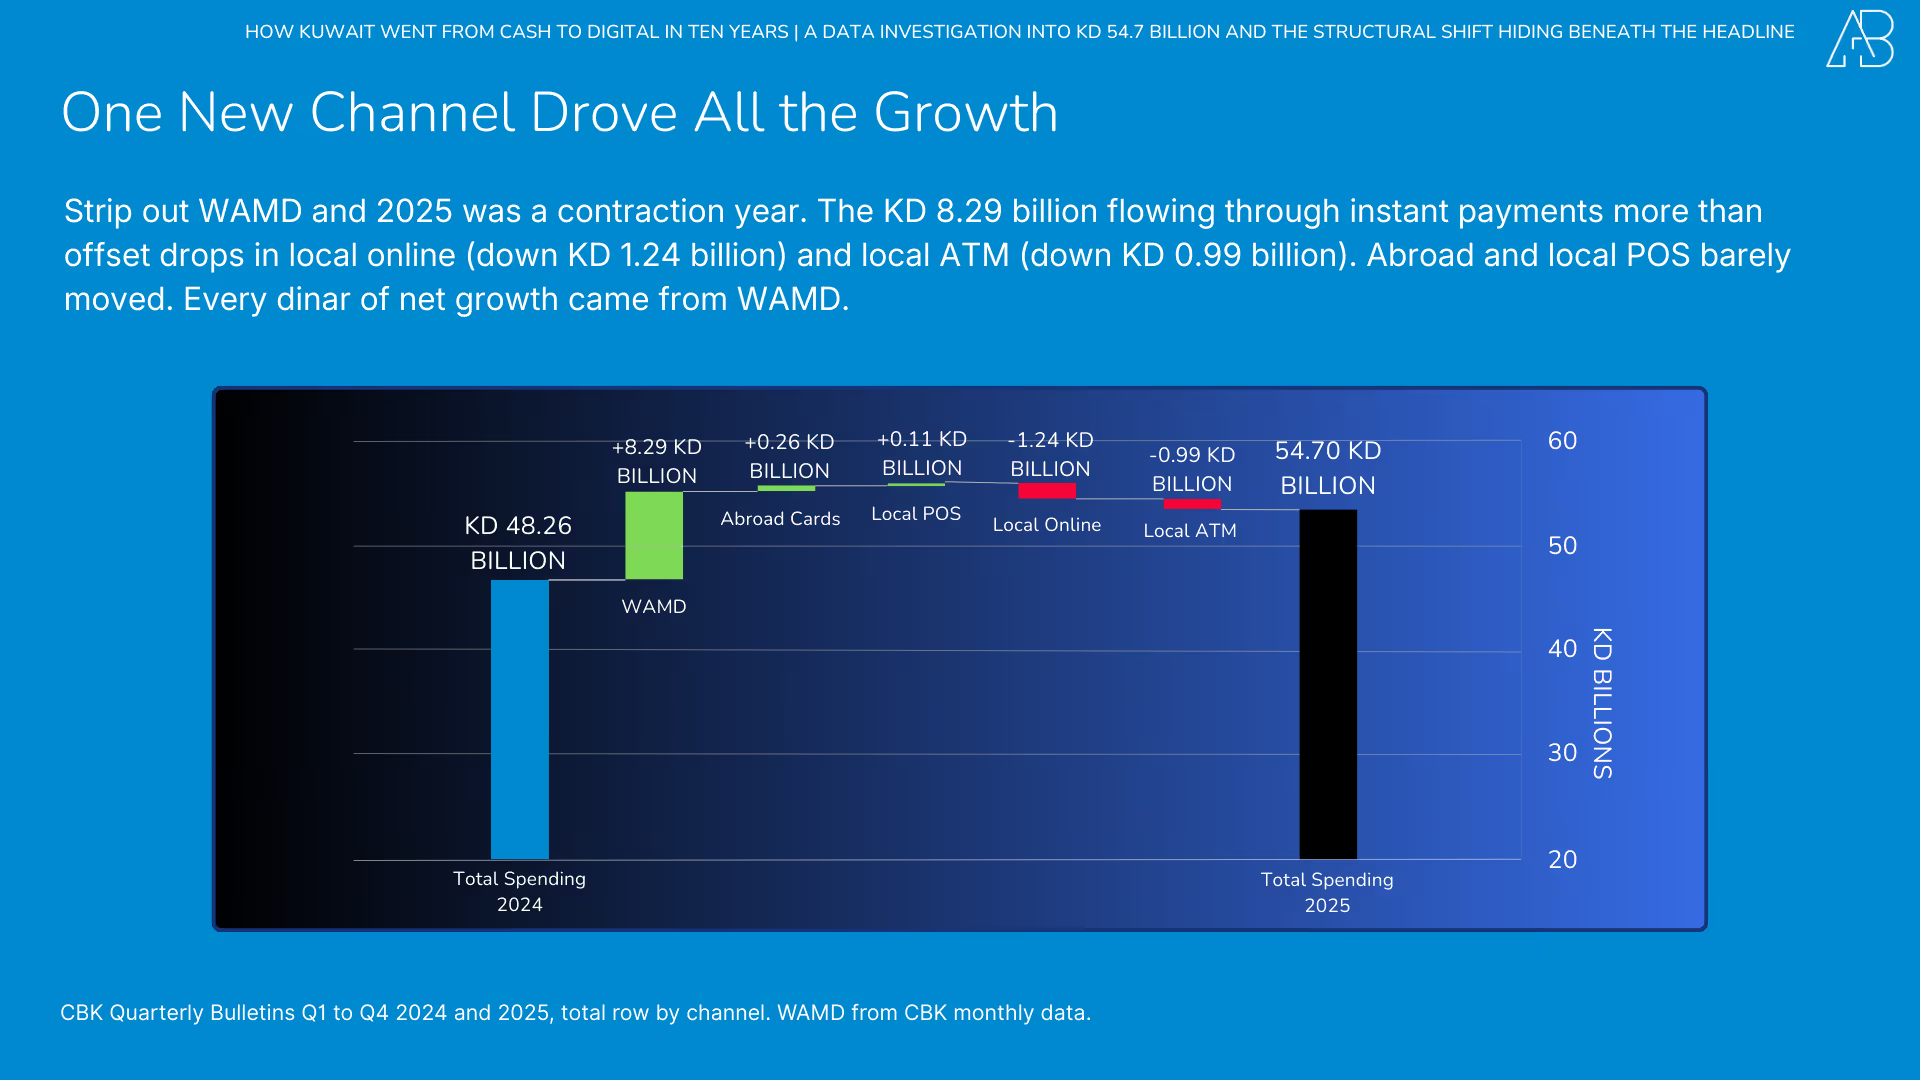
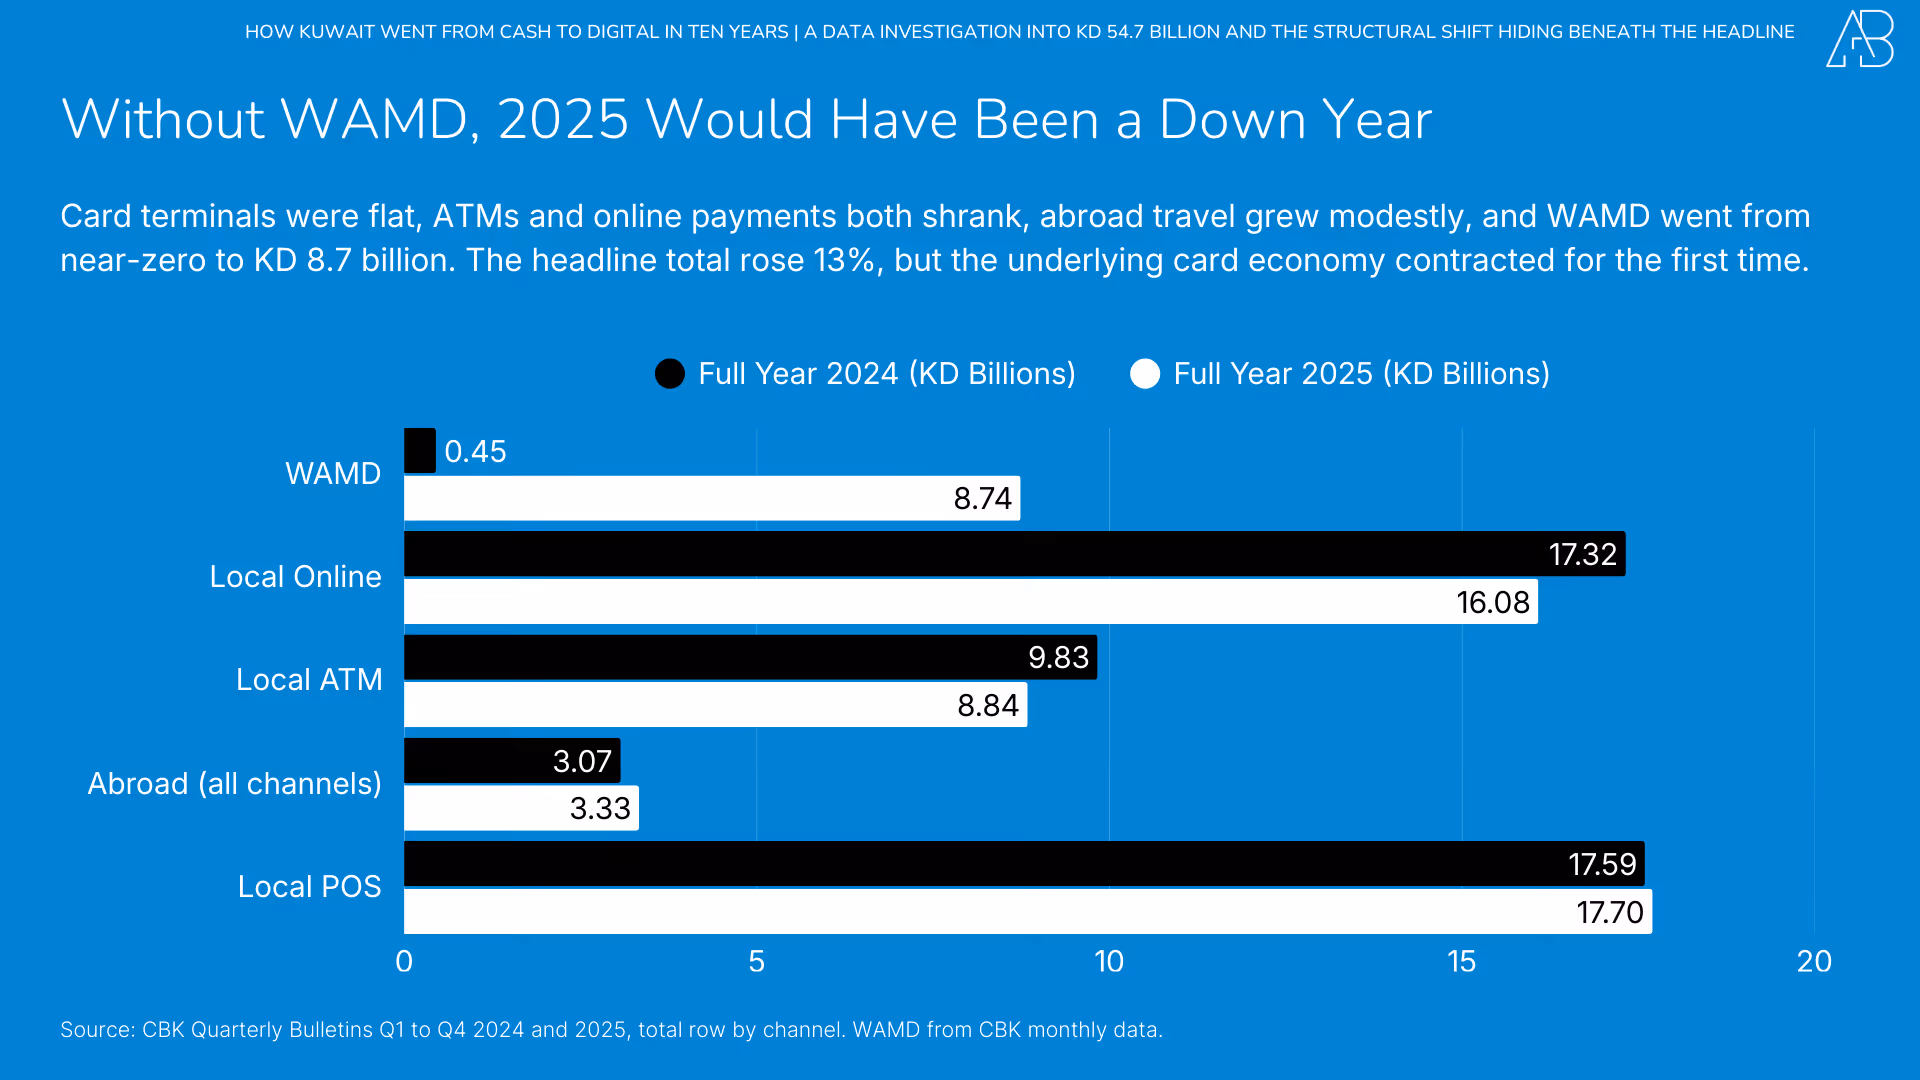
Total spending hit an all-time record, but traditional retail contracted. Kuwaitis spent KD 54.7 billion in 2025, up 13 per cent. Strip out WAMD instant transfers, and card-only spending fell 3.9 per cent. The headline and the high-street reality are both correct; they measure different things.
Cash lost its dominance in a single decade. ATM withdrawals fell from 57 per cent of local spending to 17 per cent. Online payments went from zero to KD 17.5 billion. WAMD captured 16 per cent of the market in its first twelve months.
KD 3.3 billion now leaves the country every year. Abroad spending nearly tripled, driven by cross-border e-commerce and year-round travel. The average overseas transaction fell from KD 77 to KD 24, the Shein and Temu effect, visible in Central Bank of Kuwait (CBK) data, years before the newspaper headlines.
The average transaction halved while frequency more than quadrupled. Card transactions per person rose from 8 per month to 35 per month. Every aspect of daily life has been digitised, from KD 1.5 coffees to KD 3 parking fees, thereby reducing average transaction value and altering the economics of every card machine in the country.
Kuwait is not just going digital. It is shifting to credit. Credit cards’ share of local spending more than doubled from 3.7 to 8.2 per cent. Credit has become the lifestyle card; debit, the everyday workhorse.
I. The KD 54 Billion Paradox
Something doesn’t add up in Kuwait’s economy.
In November 2025, Al-Qabas reported that consumer spending had fallen KD 1.68 billion in the first nine months of the year, a 4.7 per cent decline. NBK called consumer spending “one weak spot” in an otherwise improving economy. At the UAE-Kuwait Economic Forum in Dubai, Mohammed Alshaya warned that Chinese e-commerce platforms Shein and Temu are delivering 28,000 parcels per day to Kuwait, thereby threatening traditional retail without employing any Kuwaiti citizens or paying any municipal fees.
An apparel retailer in Avenues Mall put it bluntly: customers who used to buy one branded shirt now buy four shirts of unknown Chinese brands for the same price. They browse the display, take photos, and place orders via Temu in the parking lot. He still has foot traffic. He just doesn’t have sales.
That anecdote is part of a broader pattern. Merchants across sectors describe the same thing: customers who compare more, commit less, and treat physical stores as showrooms for decisions made elsewhere. Discount campaigns that once ran for a weekend now stretch into weeks.
Then you open the Central Bank of Kuwait’s full-year 2025 payment statistics, and this is what you find:
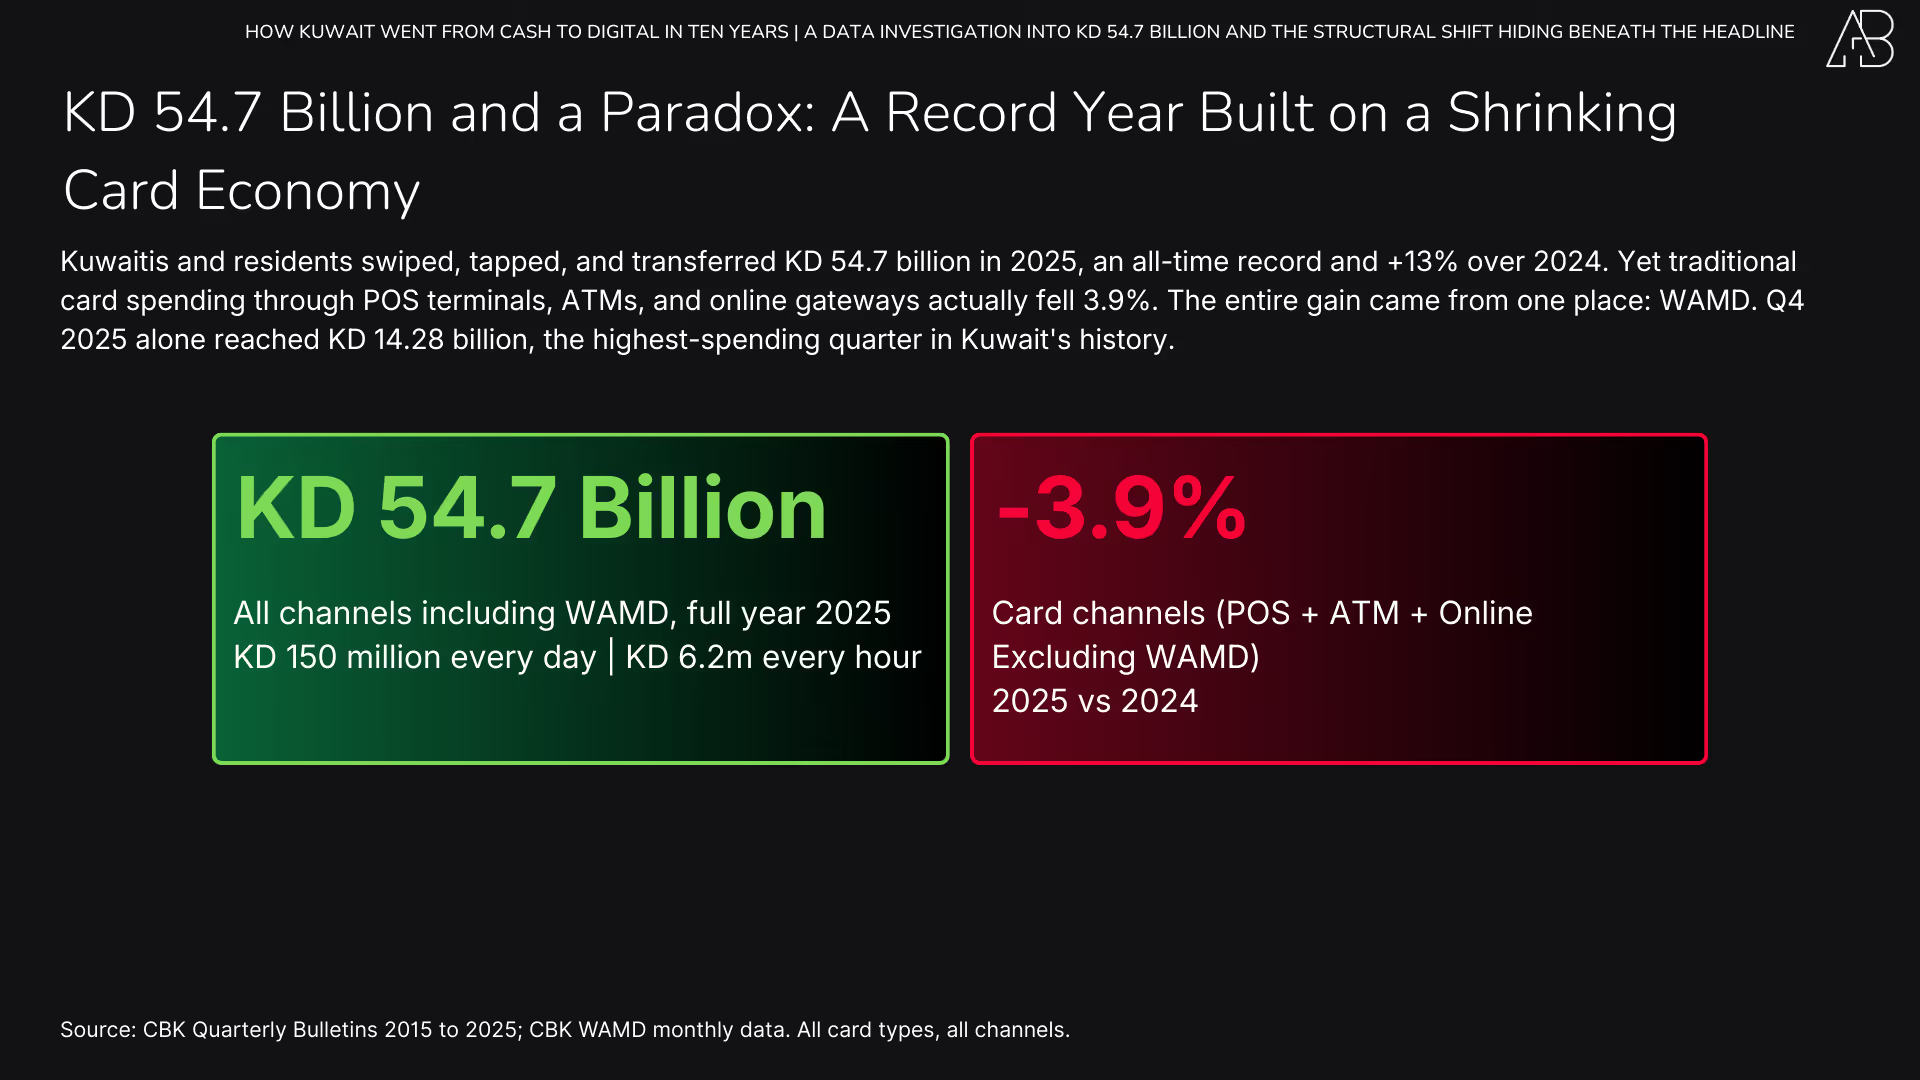
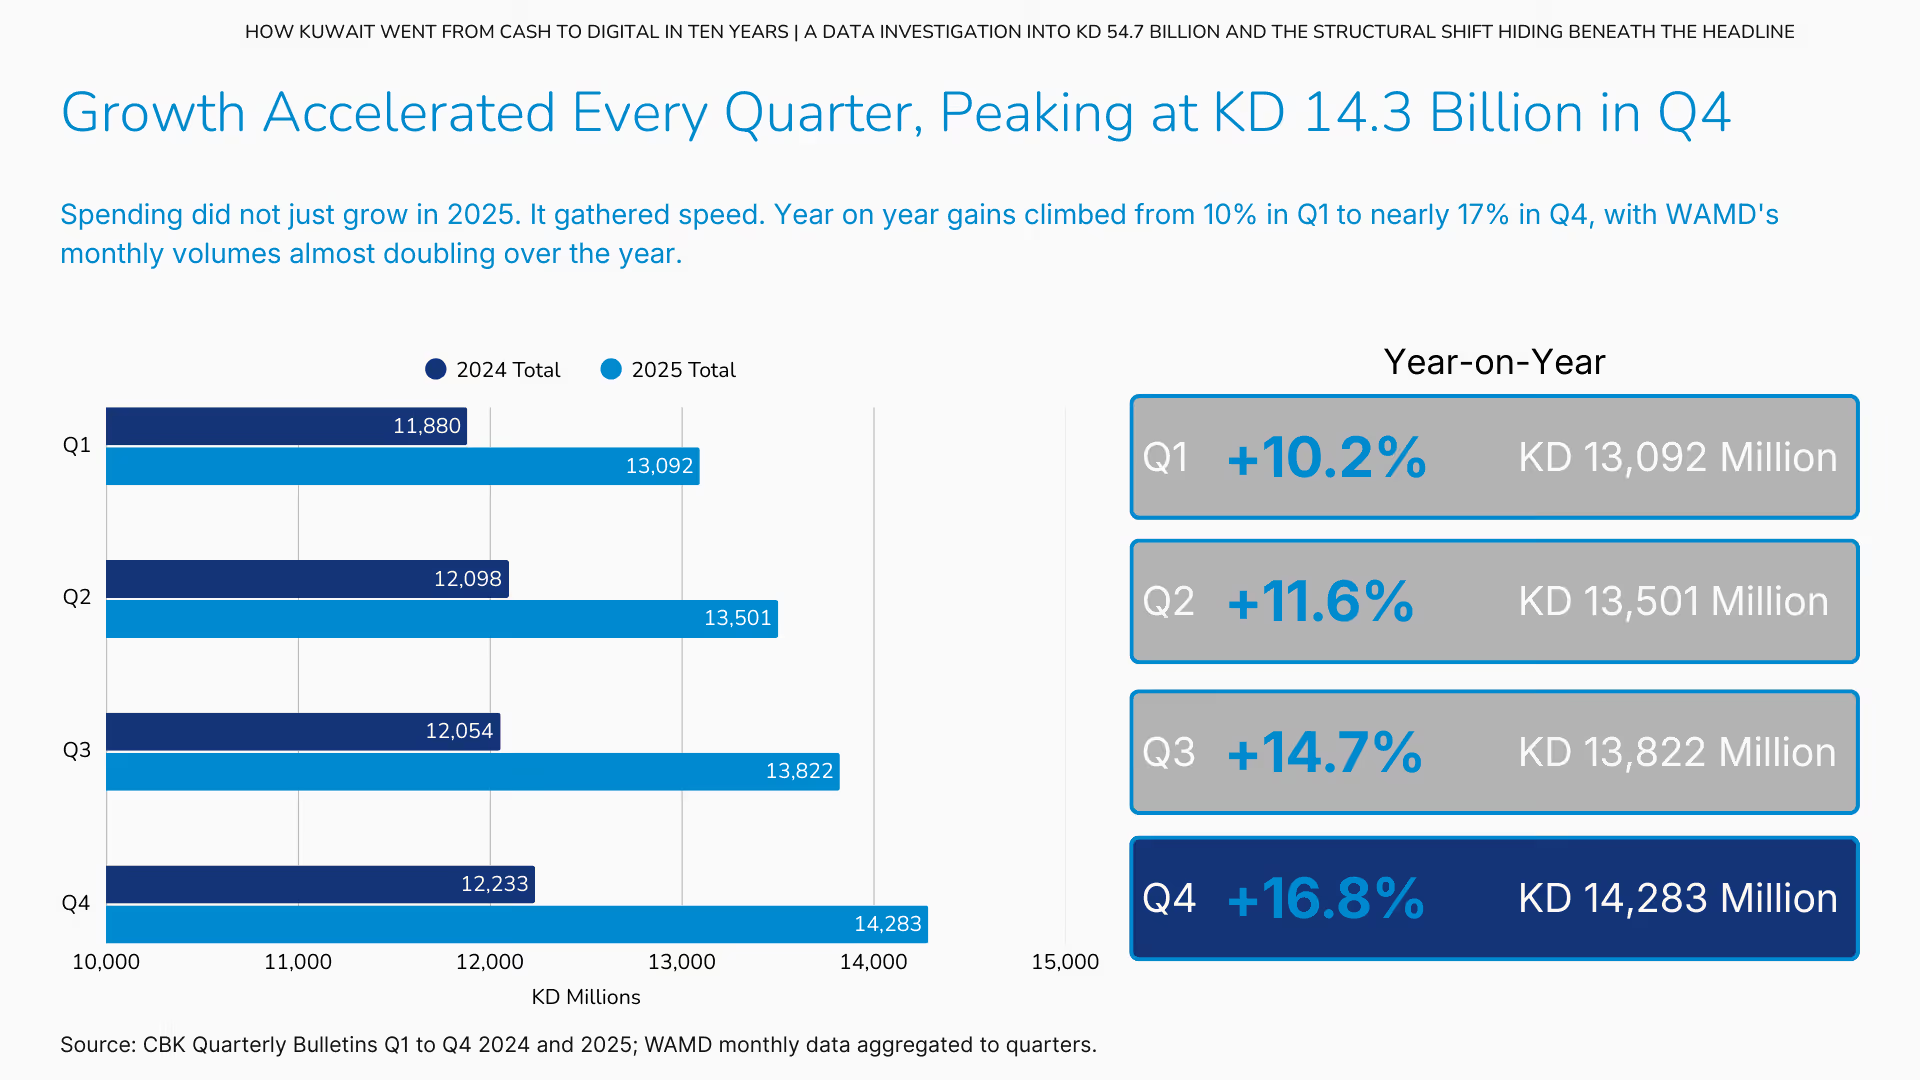
KD 54.7 billion. Not a decline. Not stagnation. An all-time record, and a 13 per cent jump over 2024. Kuwaitis collectively spent KD 150 million per day in 2025, or KD 6.2 million per hour. That is not what a contracting economy looks like.
A note on scope. That KD 54.7 billion includes all card spending (point-of-sale terminals, ATM withdrawals, and online purchases) as well as WAMD instant transfers, a new payment rail introduced in late 2024. Throughout this article, when we refer to “retail-relevant spending” or “cards only,” we mean POS + ATM + Online, excluding WAMD. That distinction matters because without it, the headline number and the retail reality cannot be reconciled.
Both stories are correct. Total spending reached a new peak. Traditional retail is struggling. The gap between the two is a structural shift, not a statistical error.
Resolving it requires analyzing ten years of Central Bank data, separating local from foreign, cash from digital, POS from online, and tracking a payment channel that did not exist before December 2024.
II. A Decade in Numbers: 2015–2025
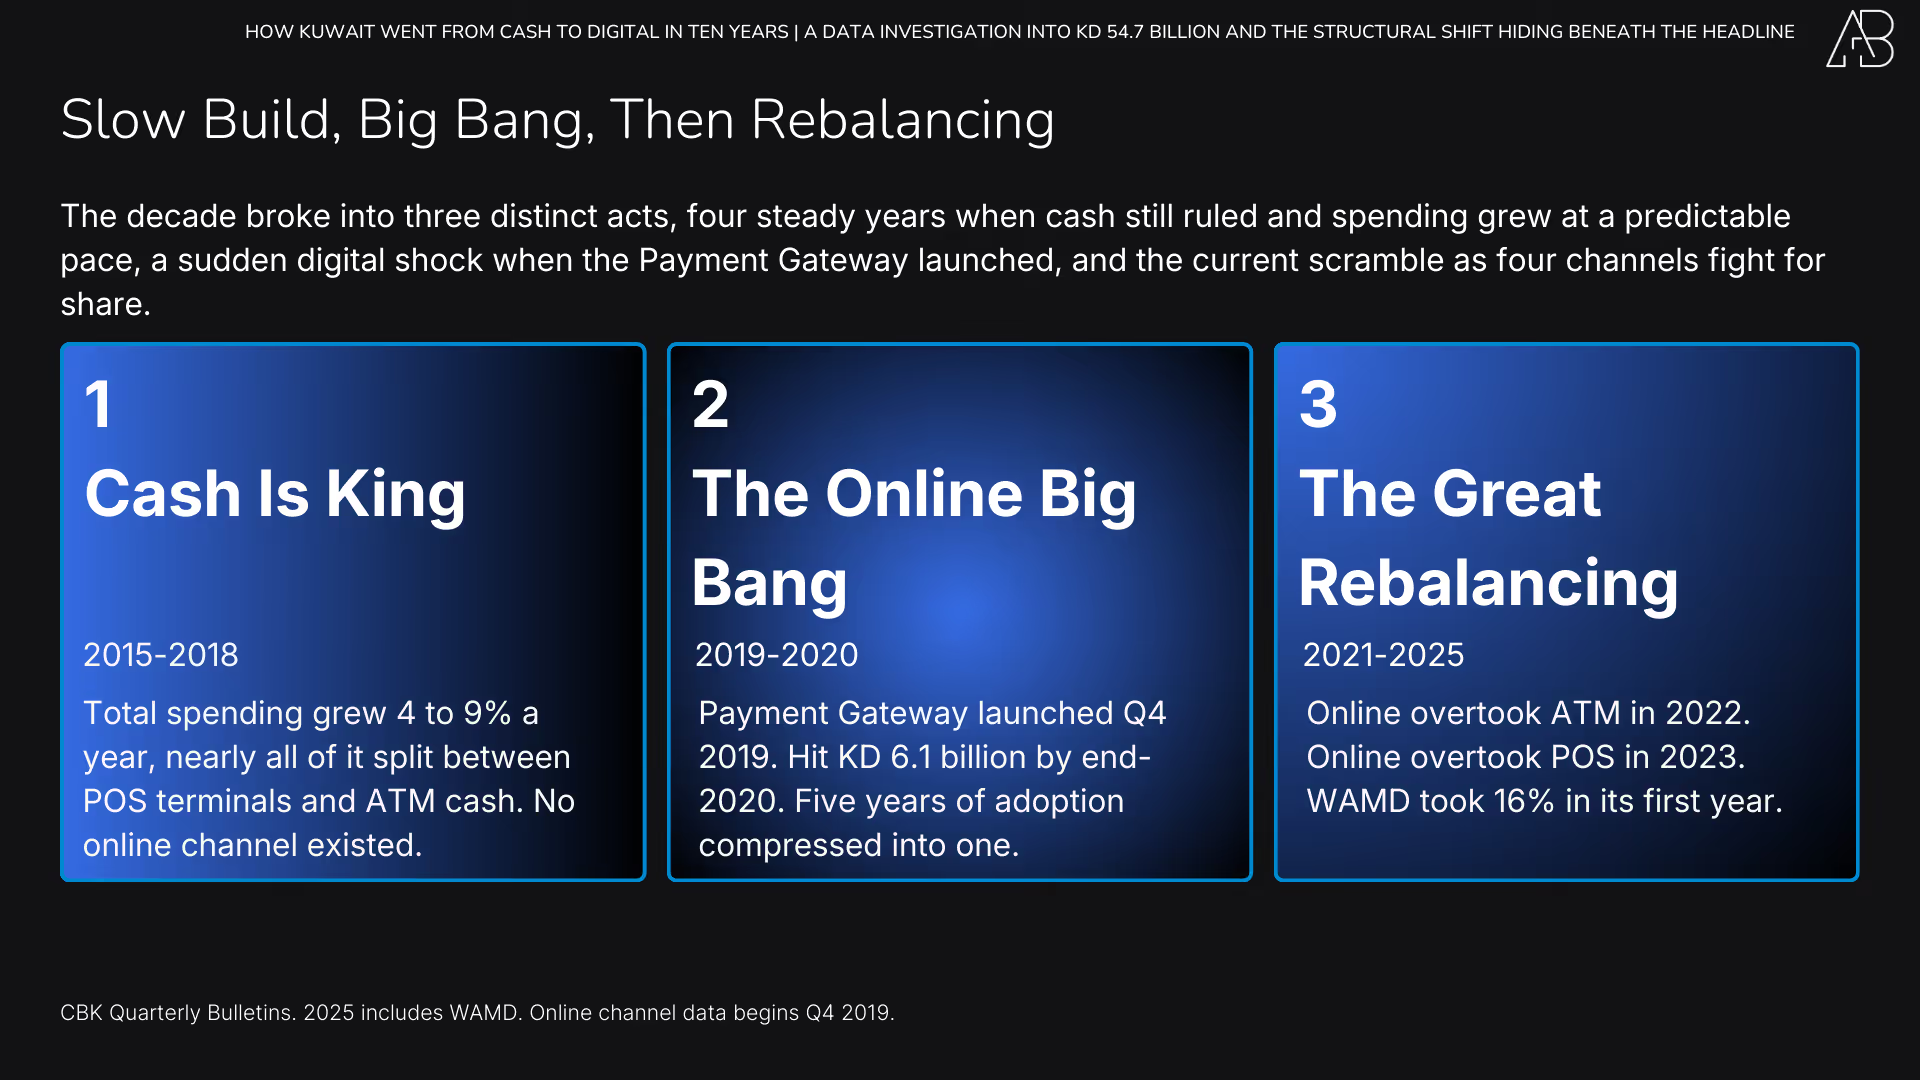
The best way to understand where Kuwait’s payment system stands today is to trace its origins. In 2015, the entire card payment market operated through two channels: point-of-sale (POS) terminals and ATMs. There was no payment gateway, no online spending category in the CBK data, and no instant transfers. A shopper either swiped a card at a store or withdrew cash from a machine. That was the full picture.
By Q4 2019, the CBK introduced the “Payment Gateway” category, capturing online card transactions for the first time. By December 2024, a new instant mobile transfer service, WAMD, was launched. By the end of 2025, four channels coexisted, and the old two-channel world was unrecognisable.
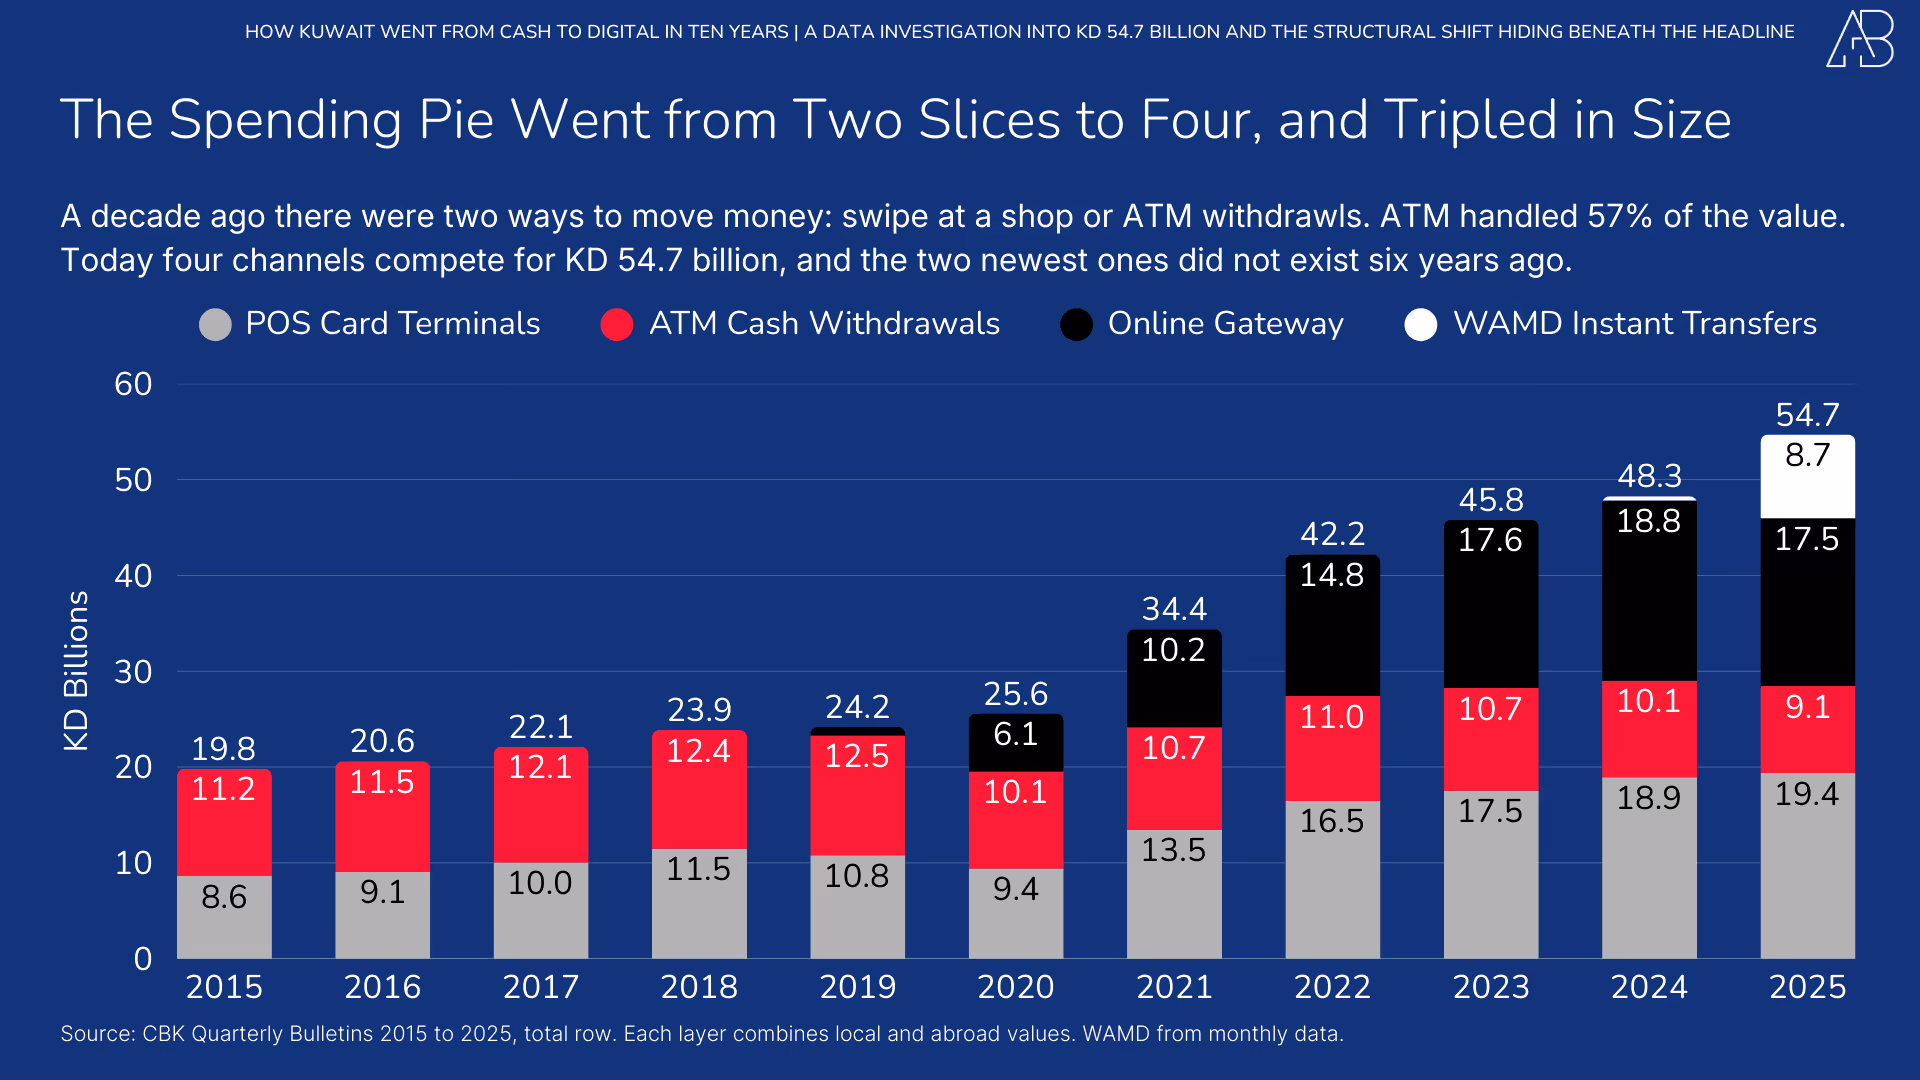
The growth trajectory breaks into three distinct phases. From 2015 to 2018, the market grew steadily at 4–9 per cent per year, driven almost entirely by POS expansion as more merchants accepted cards. ATM withdrawals continued to rise, peaking at KD 12.5 billion in 2019 (including abroad). The two channels moved roughly in parallel.
Then came 2020. The pandemic lockdowns compressed years of digital adoption into months. Online card spending, which had recorded just KD 0.9 billion in its first partial year (2019, starting Q3), exploded to KD 6.1 billion in 2020. POS and ATM transactions both declined, but total spending still rose due to a surge in online spending.
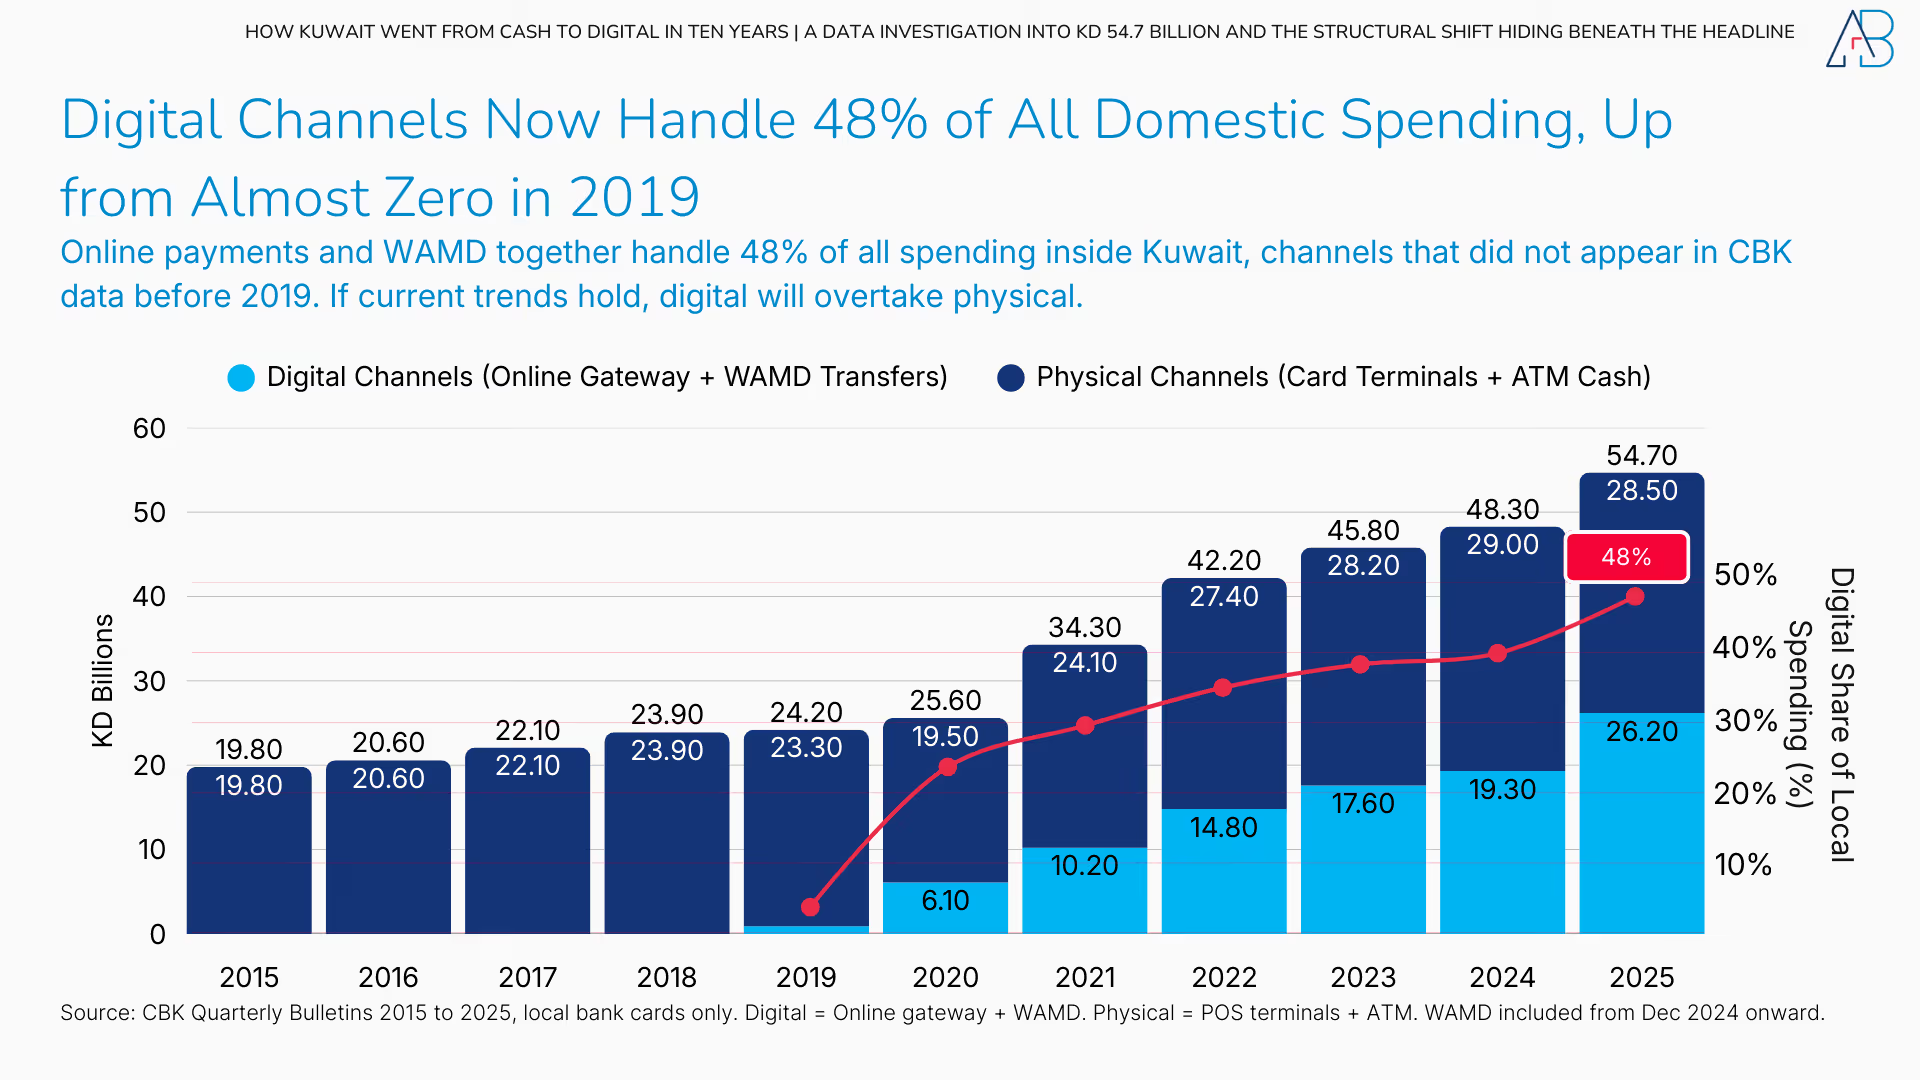
The third phase, 2021 to 2025, has been defined by the maturation of online and the arrival of WAMD. Online spending rose from KD 10.2 billion to KD 18.8 billion, then dipped to KD 17.5 billion in 2025 as WAMD absorbed part of the flow. WAMD itself grew from nothing in November 2024 to KD 8.7 billion in its first full calendar year. Together, these two digital channels accounted for 48.5 per cent of all spending in 2025.
III. The Channel Revolution: From Cash to Digital
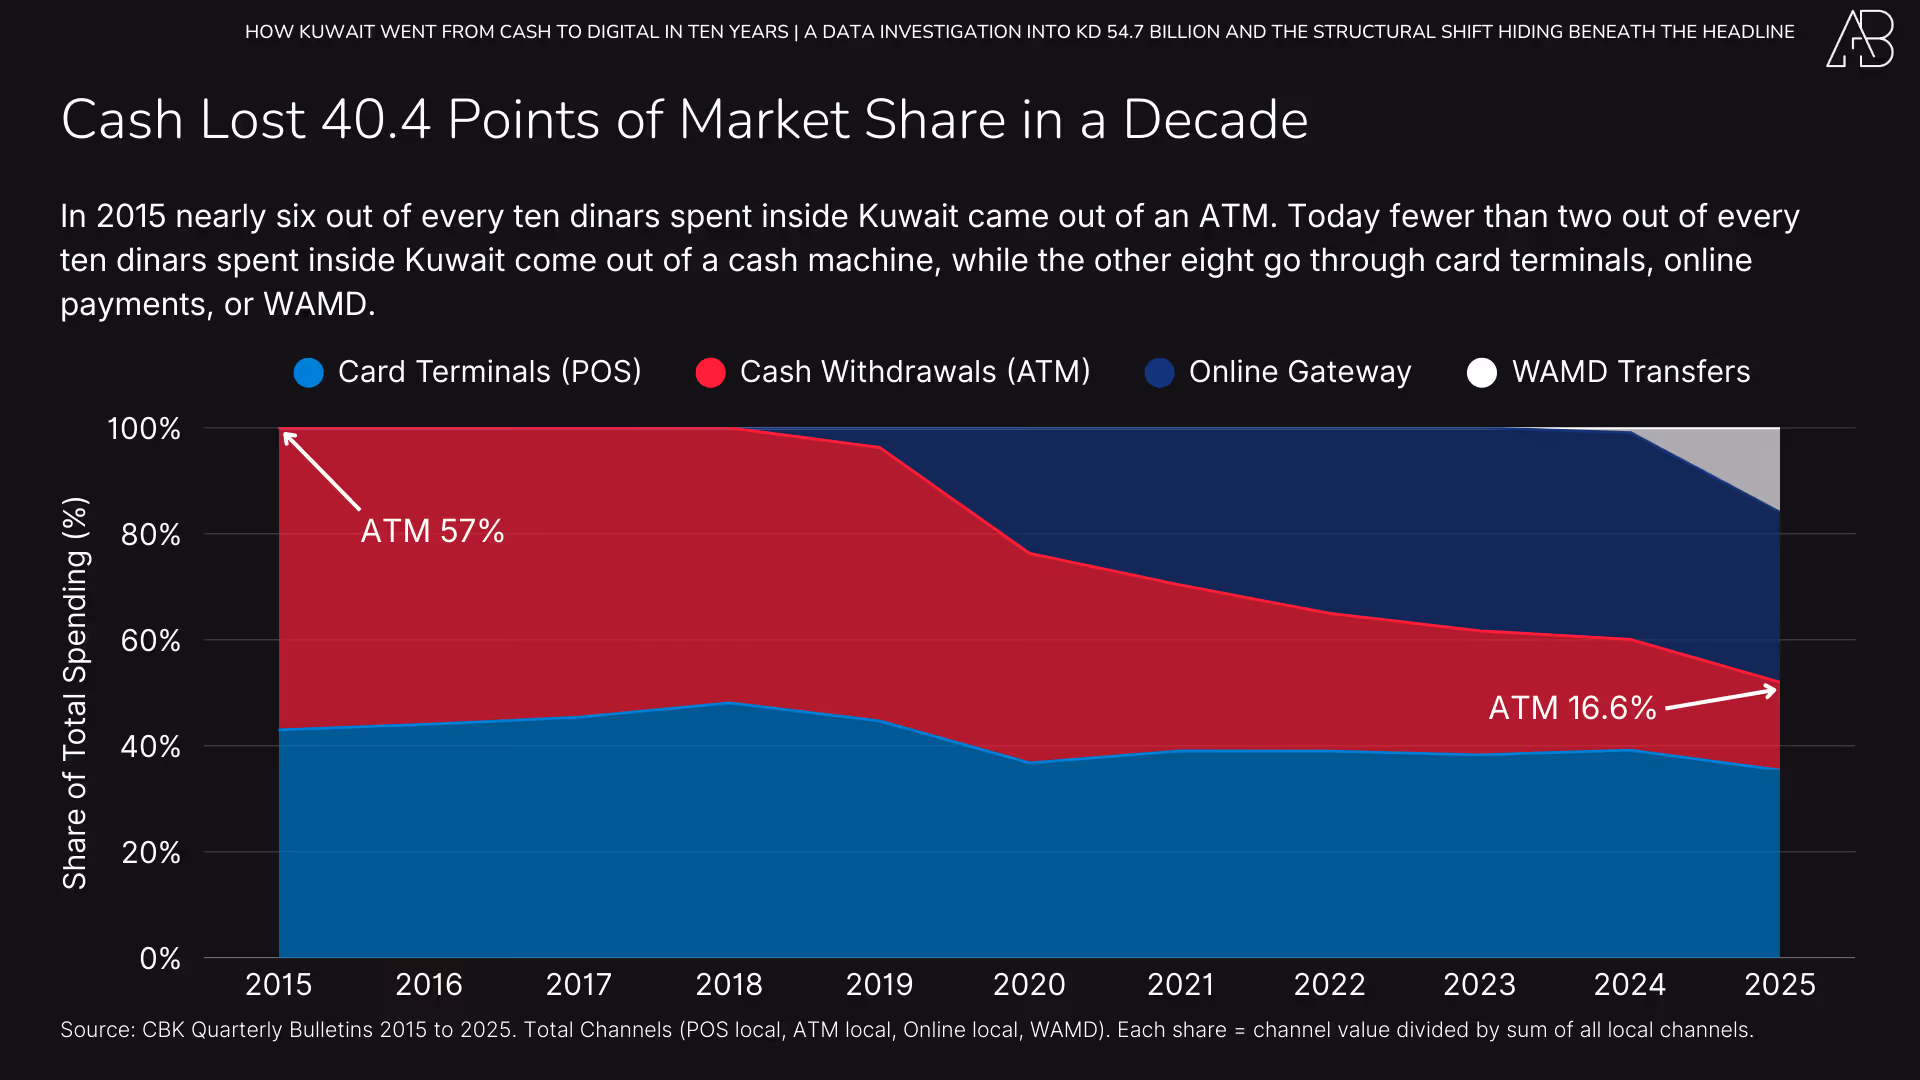
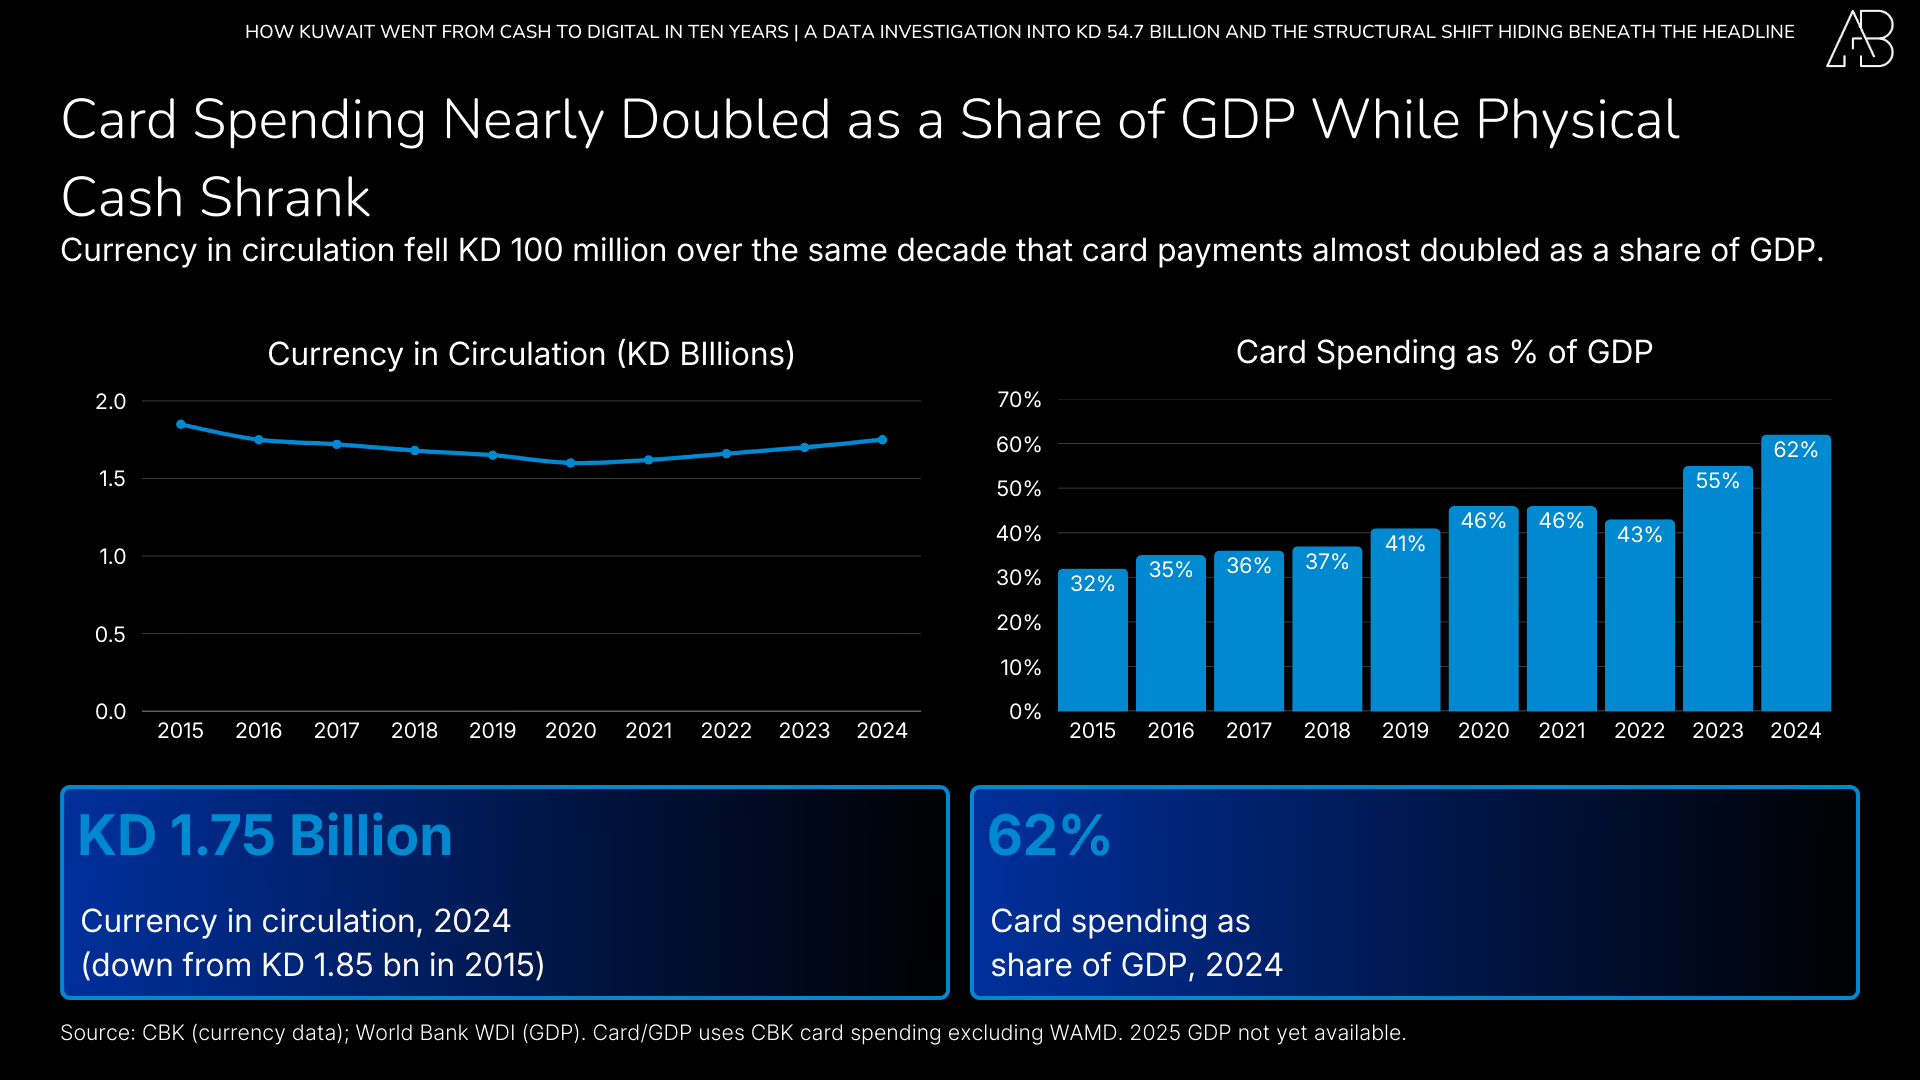
The shift is best captured by looking at channel shares. In 2015, ATM cash withdrawals accounted for roughly 57 per cent of all local spending, POS terminals for about 43 per cent, and online did not exist. By 2025, the picture had been completely redrawn: POS at 34 per cent, Online at 31 per cent, ATM and WAMD at 17 per cent each.
What’s particularly striking is how rapidly the ATM share collapsed. It remained above 50 per cent through 2019, dropped to 39 per cent in 2020 (as the pandemic drove online spending), and then fell steadily year after year. By 2025, ATM’s share was less than one-third of what it had been a decade earlier.
The shift has a compound nature. Each channel’s story is distinct. POS terminals have continued to grow in absolute value nearly every year, reaching KD 19.4 billion in 2025. Their share declined only because the pie grew faster through other channels. ATM withdrawals peaked in 2019 and have fallen every year since. Online spending increased from zero to KD 18.8 billion over five years, then declined slightly in 2025. WAMD emerged unexpectedly, becoming a KD 8.7 billion channel in its first full year.
IV. The Collapse of ATM Cash
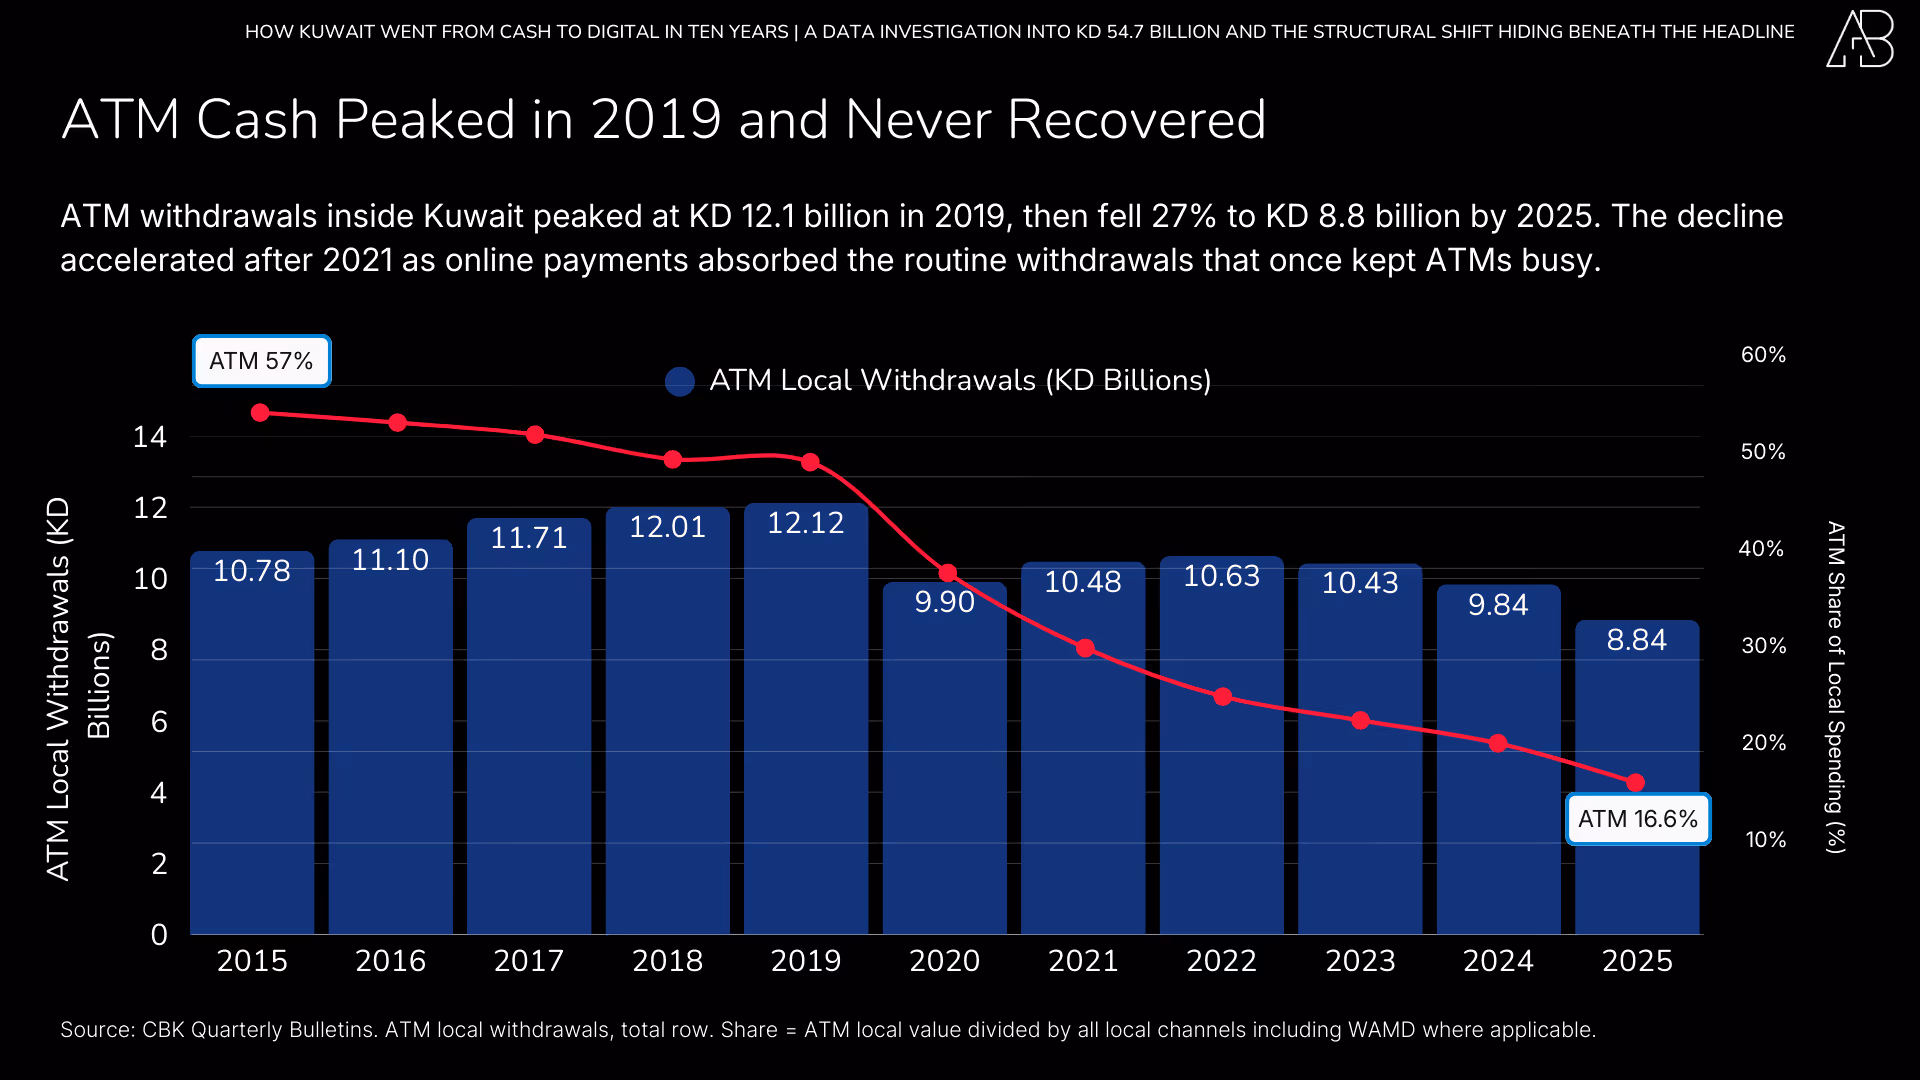
No single metric captures Kuwait’s payment transformation more completely than the decline of ATM withdrawals. In 2015, Kuwaitis withdrew KD 10.78 billion from ATMs in the country, representing about 57 per cent of all local spending. A decade later, local ATM withdrawals had fallen to KD 8.84 billion, and their share of local spending had collapsed to just 17 per cent.
The decline was not linear. ATM values actually continued to rise through 2019, reaching their domestic peak of KD 12.12 billion. The early years of the decade were about growth for everyone, including cash. Then 2020 broke the pattern. Lockdowns shut down physical cash circulation. ATM withdrawals dropped to KD 9.90 billion. When the economy reopened in 2021, most spending categories recovered. ATM did not. It has fallen every year since, from KD 10.44 billion in 2021 to KD 8.84 billion in 2025.
The acceleration in 2024 and 2025 is sharp. The 2025 decline was the largest annual drop since the pandemic year, and this time the cause was not a lockdown but a substitute: WAMD.
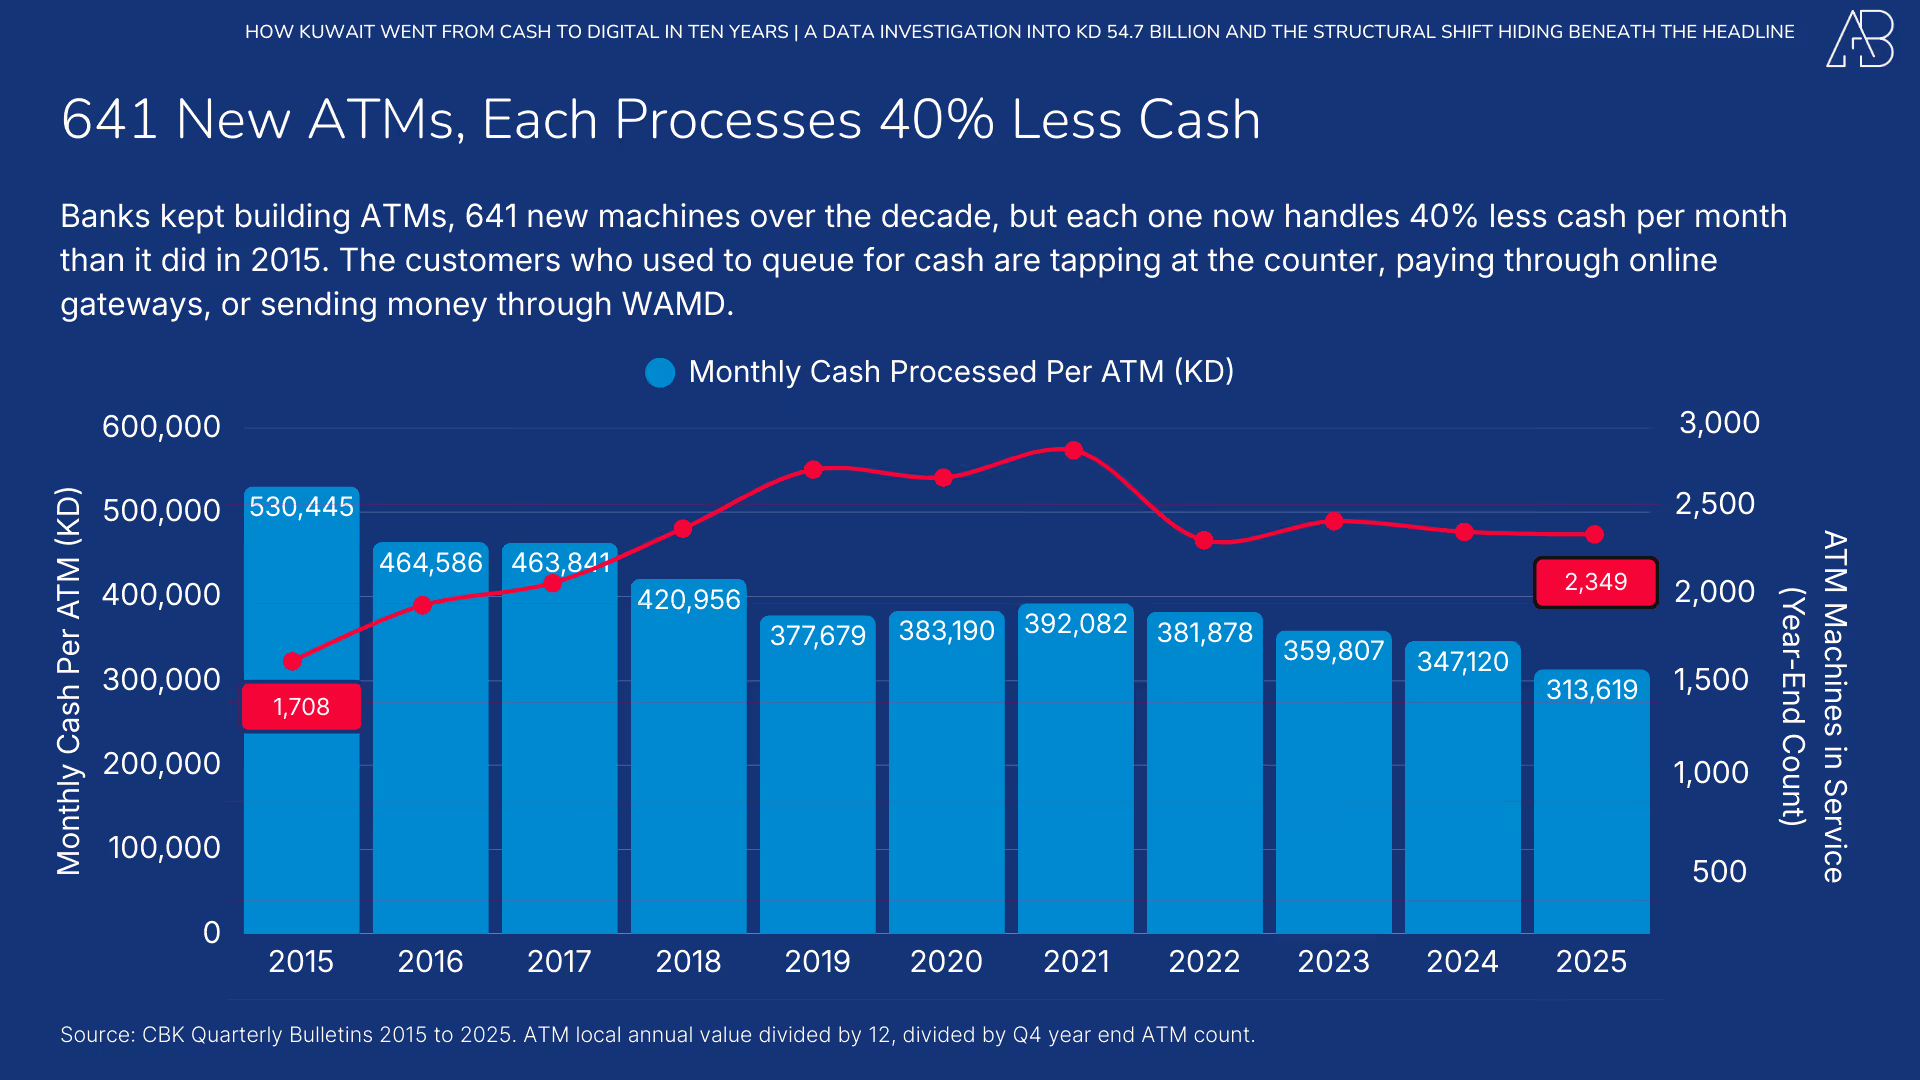
Yet Kuwait still has 2,349 ATM machines, up from 1,708 in 2015. The infrastructure has continued to expand even as usage contracts. The average ATM now processes KD 314,000 per month, down from KD 526,000 in 2015 – a 40 per cent drop.
What replaced ATM cash? Three things, roughly in order of impact: online card payments (for purchases that previously required cash), WAMD instant transfers (for peer-to-peer payments and small business payments), and POS expansion into categories that were cash-only a decade ago (parking, government services, small kiosks).
V. The Online Surge
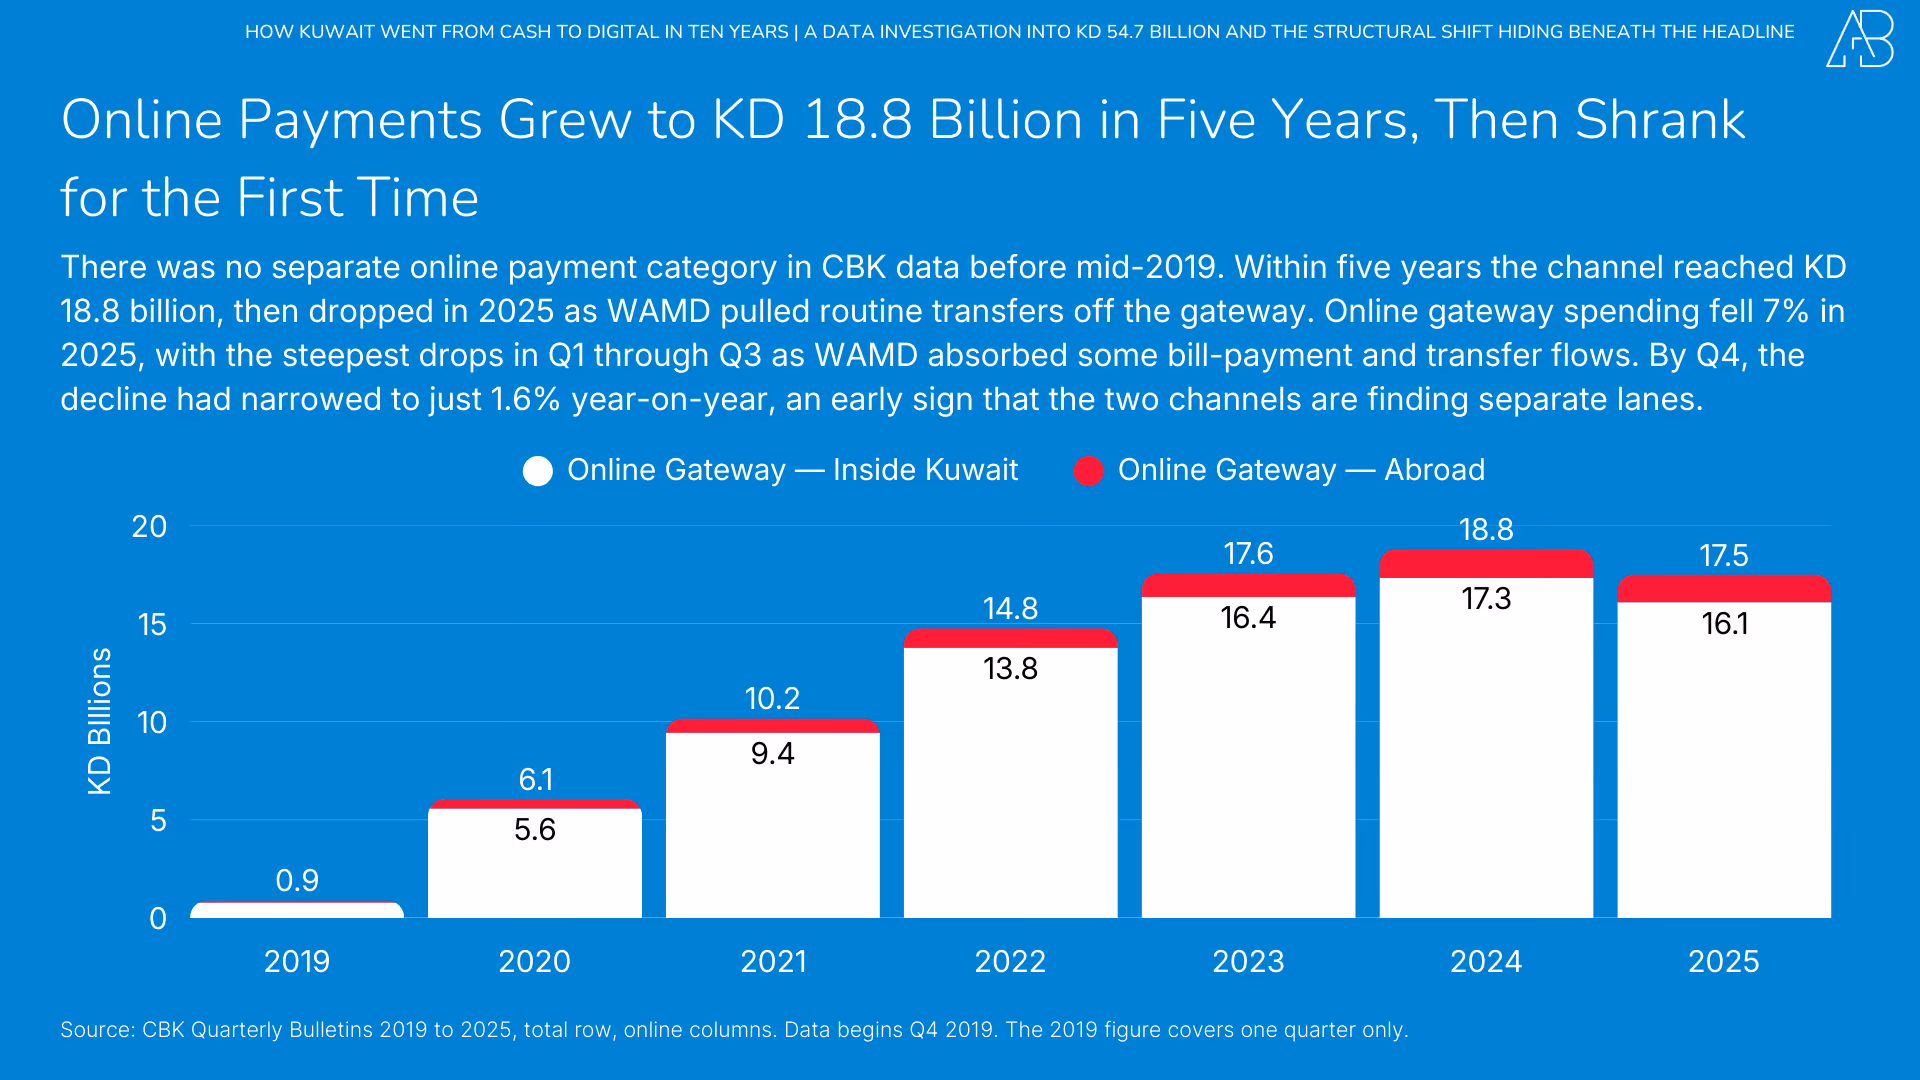
The CBK began tracking online card transactions (labelled “Payment Gateway” in the data) from mid-2019. In that partial year, KD 0.9 billion was spent online. No prior benchmark existed; the channel simply appeared in the statistics.
What happened next was the fastest growth of any payment channel in Kuwait’s history. Online spending reached KD 6.1 billion in 2020 (including the pandemic lockdown acceleration), then KD 10.2 billion in 2021, KD 14.8 billion in 2022, and KD 18.8 billion in 2024, its peak year. In 2025, it dipped to KD 17.5 billion – a 7 per cent decline – as WAMD absorbed some of the flow.
The 2025 decline deserves careful interpretation. It does not mean Kuwaitis are shopping less online. A portion of the previously captured activity under “online” was migrated to WAMD. A customer who paid a small business via a payment link in 2023 generated an online debit transaction. The same customer sending money via WAMD in 2025 shows up under a different heading. The underlying economic activity is similar; the classification changed.
Online abroad spending tells a different story. It has risen every year since tracking began, reaching KD 1.41 billion in 2025. This is the Shein and Temu effect that Alshaya warned about: Kuwaitis buying from international e-commerce platforms using their cards. It now accounts for 42 per cent of all overseas spending, up from 0 per cent six years ago.
VI. WAMD: The New Force That Rewrote the Rules
WAMD is an instant payment service operated by KNET (the national payment switch) that launched in December 2024. The name itself is an Arabic word meaning “flash.” Its mechanism is simple: a sender enters the recipient’s mobile phone number, and the money moves bank-to-bank in seconds. No IBAN required. No card details. No waiting.
That simplicity changed the market faster than anyone expected. In its launch month, December 2024, WAMD processed KD 450 million across 5.4 million transactions. By December 2025, monthly volumes had doubled to KD 903 million. Over its first full calendar year, WAMD moved KD 8.74 billion, nearly matching the ATM channel's value while processing 1.7 times as many transactions (119.8 million versus 68.9 million for ATMs).
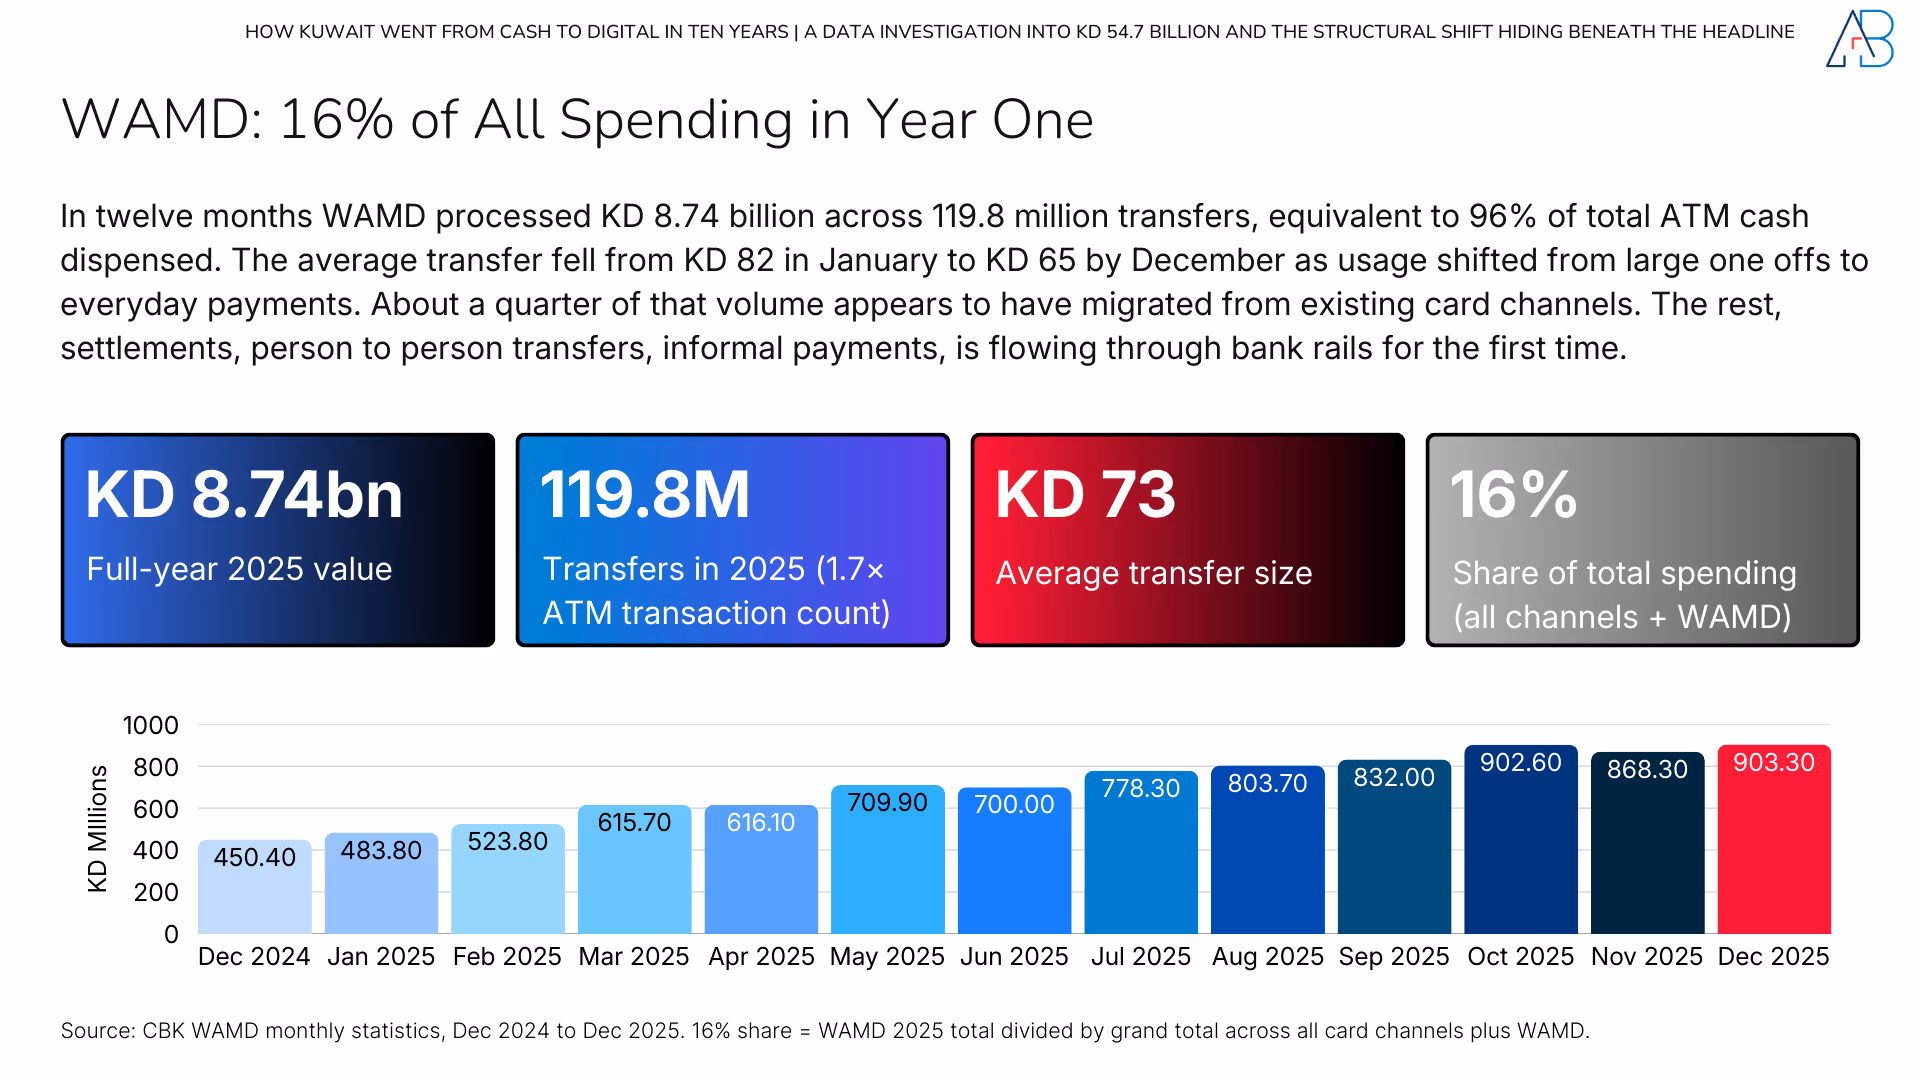
The average transfer fell from KD 82 in January to KD 66 by December, a positive signal: smaller, more routine use. That pattern suggests WAMD is spreading beyond one-off large transfers to everyday payments, splitting restaurant bills, paying the plumber, and settling small debts.
WAMD did not create new spending out of thin air. It absorbed transactions that previously occurred through three channels. First, ATM cash withdrawals for peer-to-peer transfers: before WAMD, if you owed a friend KD 50, you went to an ATM, withdrew the cash, and handed it over. WAMD replaced that with a phone number and a tap. Second, online payment links for small businesses: home-based food businesses and Instagram sellers previously collected money via online payment links (counted as online debit transactions). WAMD replaced many of these flows. Third, traditional bank transfers: transfers requiring IBANs are slow and error-prone; WAMD’s mobile-number lookup eliminates both problems.
Local card spending fell KD 2.1 billion in 2025, the first domestic decline in years, so roughly a quarter of WAMD’s volume migrated from existing channels. The rest represents cash-economy activity, including settlements, informal payments, and person-to-person transfers that are moving through the banking system for the first time.
VII. Kuwait Abroad: KD 3.3 Billion, 139 Million Transactions
Kuwaitis spent KD 3.33 billion abroad in 2025 across 139 million transactions, averaging KD 9.13 million every day. That figure is 2.75 times what it was in 2015, when abroad spending totalled KD 1.21 billion (KD 3.31 million per day).
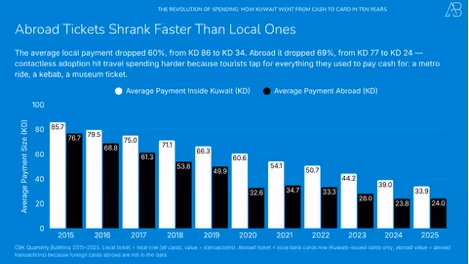
But the headline value growth understates what happened beneath the surface. Abroad transactions increased from 15.8 million in 2015 to 138.9 million in 2025, a 781 percent increase. Value, by contrast, grew 176 per cent. The inevitable result: the average transaction abroad collapsed from KD 76.7 in 2015 to KD 24.0 in 2025, a 69 per cent decline. Kuwaitis are spending more abroad, but in radically smaller increments.
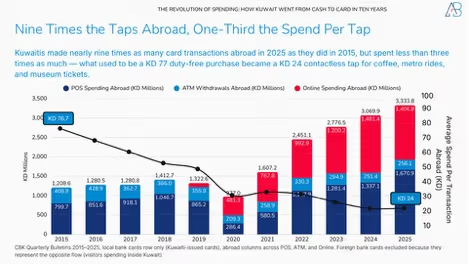
This is the Shein and Temu story. Cross-border e-commerce platforms from China turned a KD 100+ purchase into a KD 5–15 parcel. The average POS transaction abroad tells the same story from a different angle: KD 66 in 2015, falling to KD 20 in 2025. Even physical transactions abroad got smaller as tap-to-pay replaced cash at every coffee shop and transit terminal from London to Bangkok.
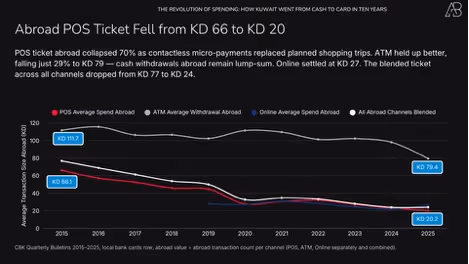
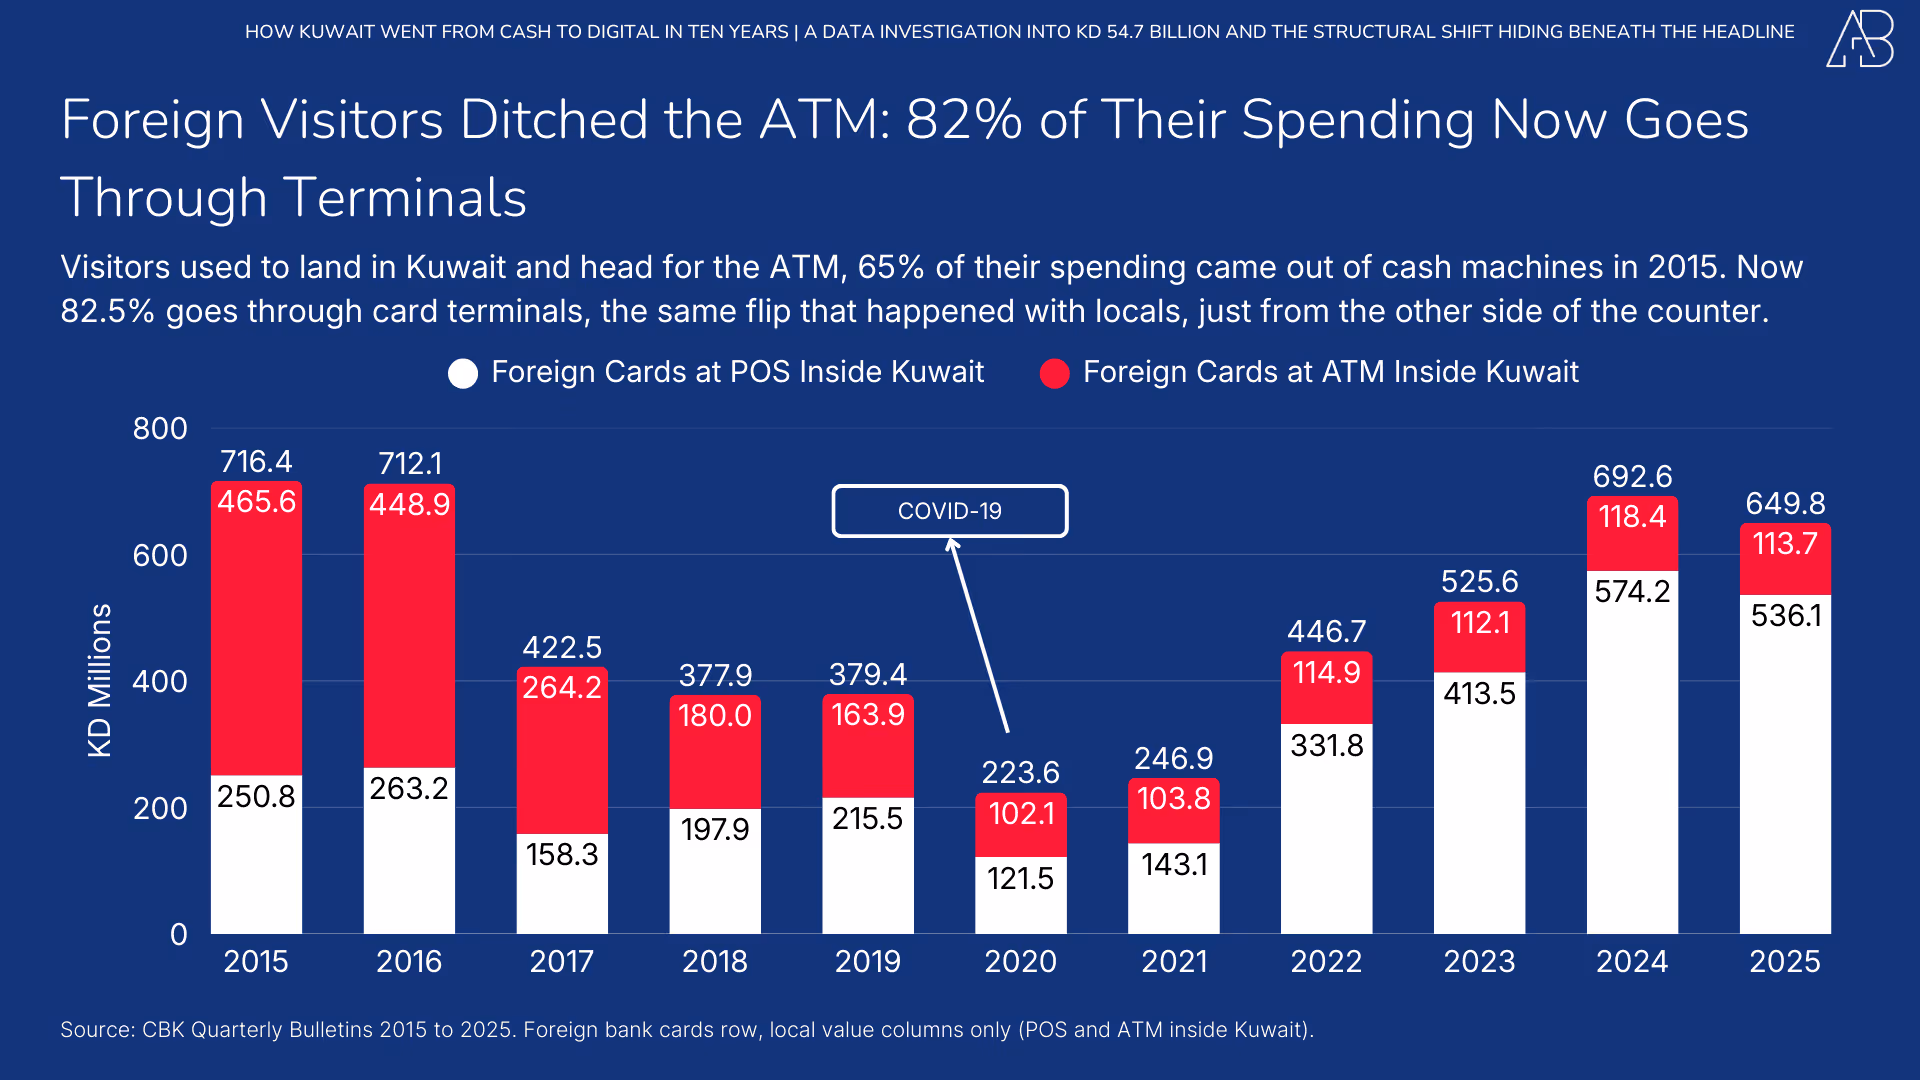
The channel composition of abroad spending shifted as dramatically as domestic spending. In 2015, every dirham spent abroad was processed via POS terminals (66 per cent) or ATM cash withdrawals (34 per cent). By 2025, three channels split the pie: POS at KD 1.67 billion (50 per cent), Online at KD 1.41 billion (42 per cent), and ATM cash at KD 0.26 billion (8 per cent). The traveller of 2025 taps a card at every restaurant and books every hotel online; the ATM is an afterthought.
VIII. The Summer Exodus: Q3 Peak and Quarterly Seasonality
Every summer, outbound travel surges. Temperatures above 50°C make the country hard to tolerate for those who can afford to leave. The school calendar aligns. Flights fill up. The data track the exodus precisely through Q3 in overseas spending.
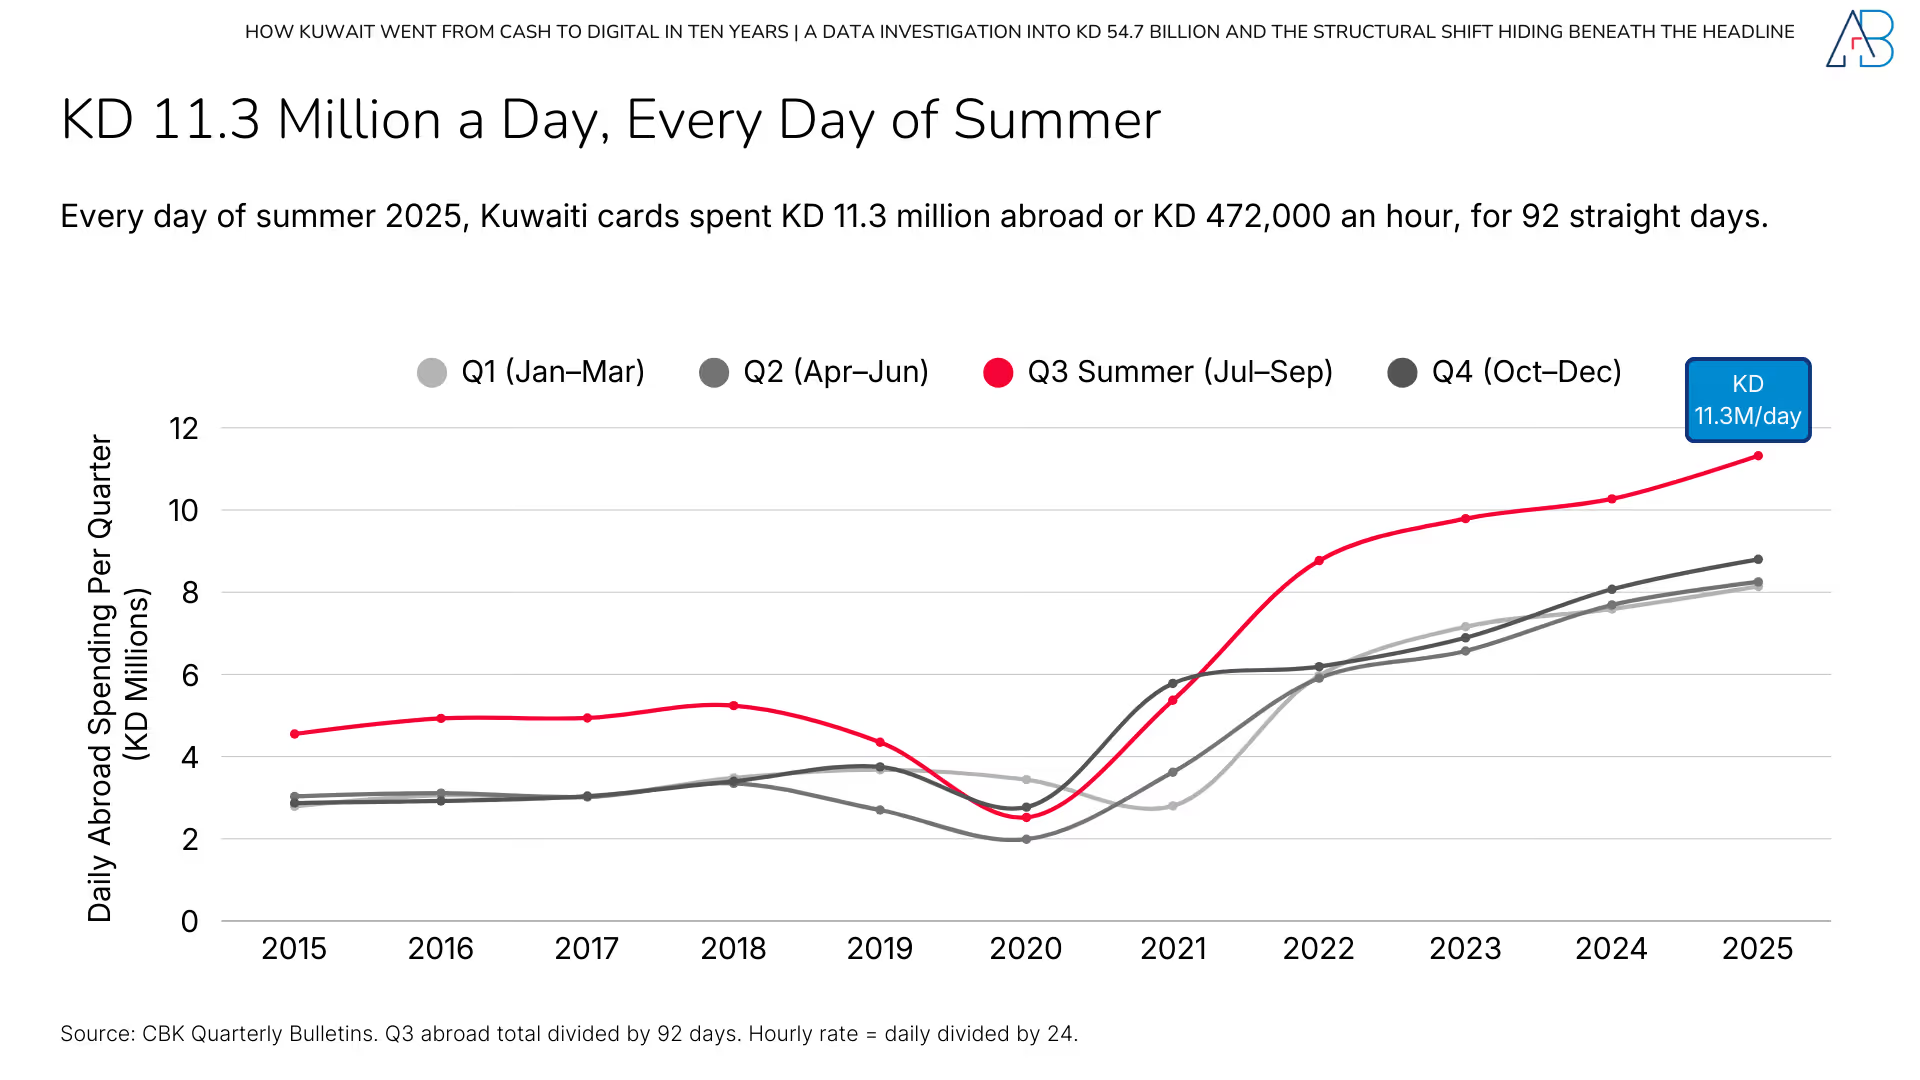
In Q3 2025, Kuwaitis spent KD 1.04 billion abroad, the first time a single quarter crossed the billion-dinar mark, averaging KD 11.3 million per day. That is 2.5 times the 2015 Q3 figure of KD 418 million.
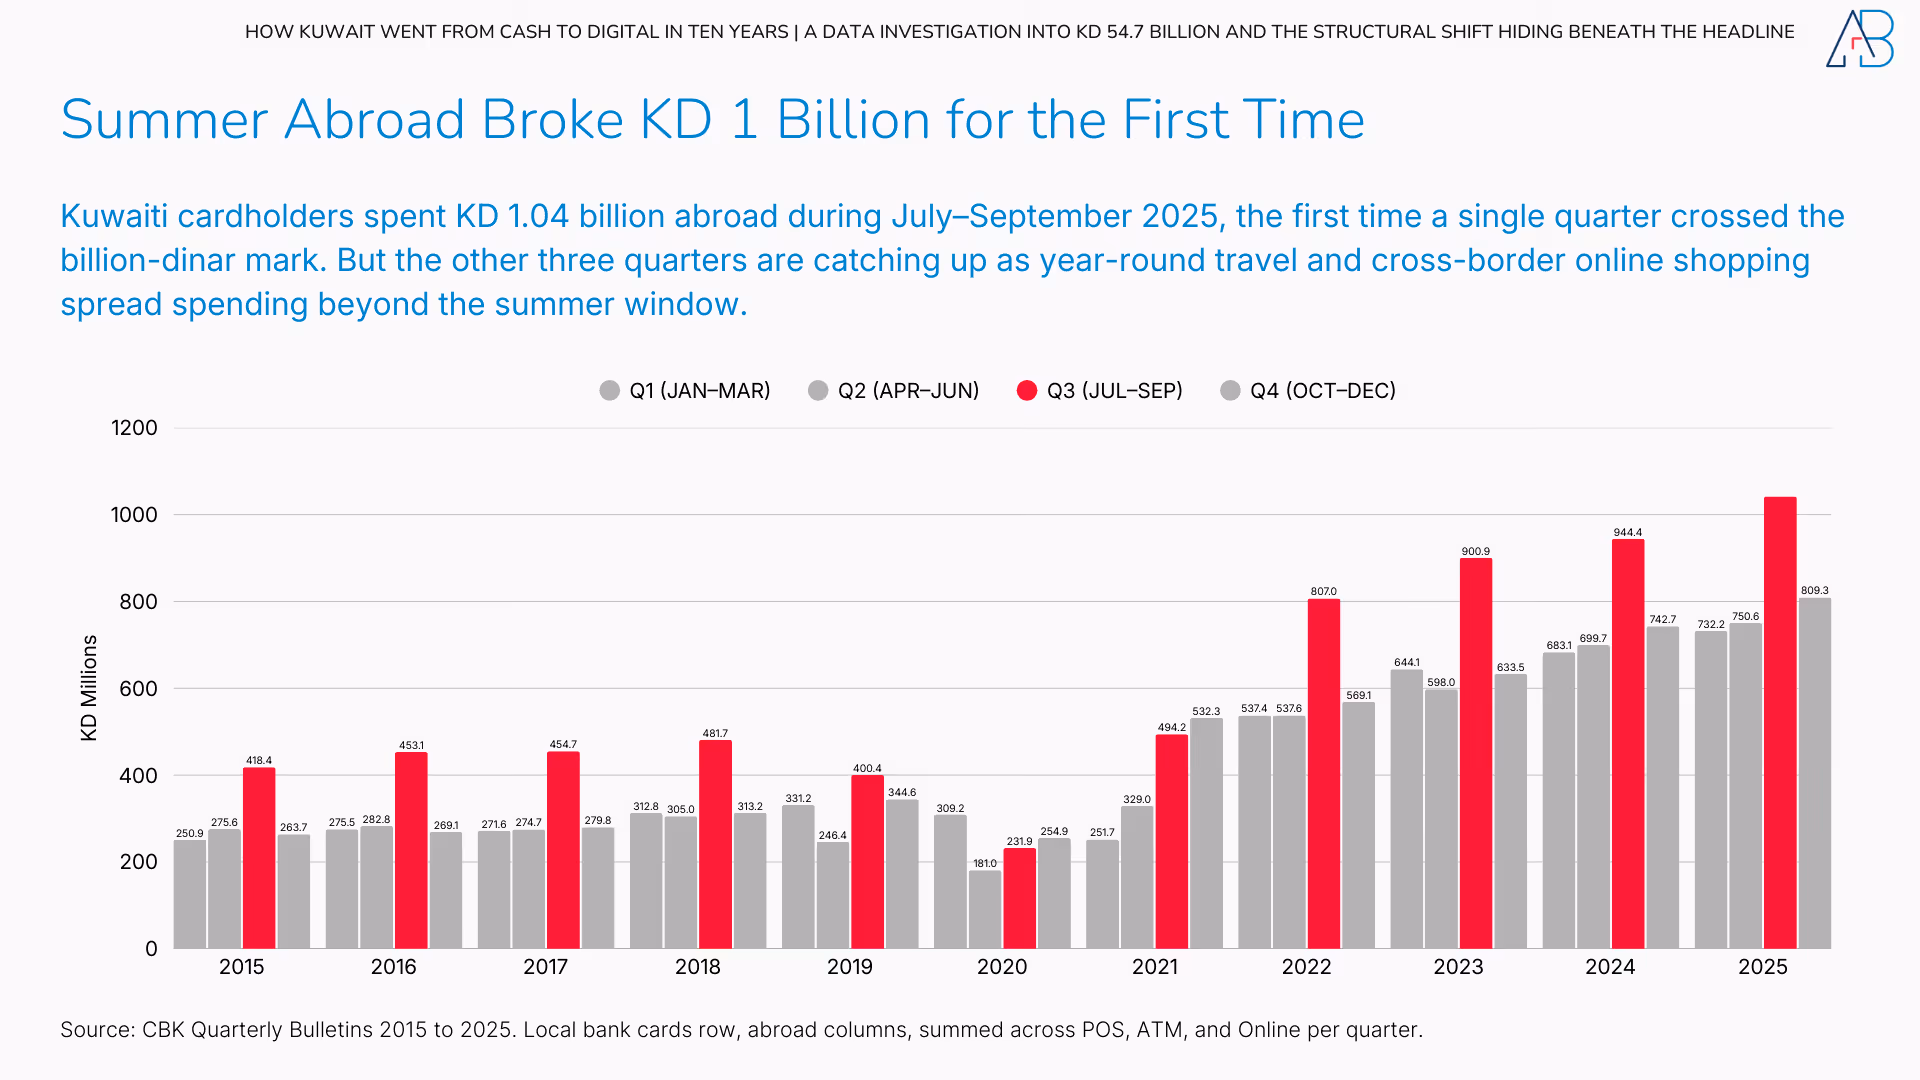
But the summer peak does not exist in isolation. Q3 abroad spending consistently runs 1.3 to 1.7 times the average of the other three quarters – a reliable seasonal pulse.
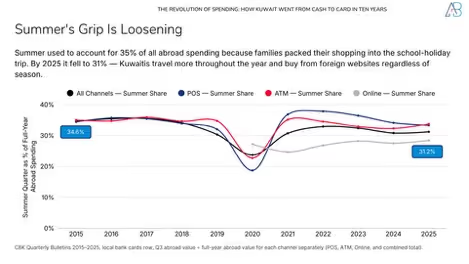
What’s changing is that the rest of the year is catching up. Each non-summer quarter roughly doubled its abroad spending over the decade, outpacing Q3’s own 149 per cent rise. Summer used to account for 35 per cent of annual overseas spending; by 2025, it fell to 31 per cent. Kuwaitis are travelling and spending abroad year-round, not just when the temperature rises above 50.
At KD 11.3 million per day during the summer of 2025, Kuwaitis collectively drained more than KD 1 billion from the domestic economy in a single quarter. That money was spent on hotels in London, restaurants in Istanbul, shopping in Milan, and Booking.com reservations billed in foreign currencies. The summer exodus is no longer just physical travel, it is a quarterly capital outflow.
IX. Infrastructure: 110,000 Terminals and Counting
While the digital channels grew from nothing, the physical payment infrastructure continued to expand. POS terminals more than doubled from 43,322 in 2015 to 110,423 in 2025, a 155 per cent increase. ATM machines grew more modestly, from 1,708 to 2,349, a 38 per cent increase. Cards in circulation rose from 4.22 million to 7.57 million, up 79 per cent.
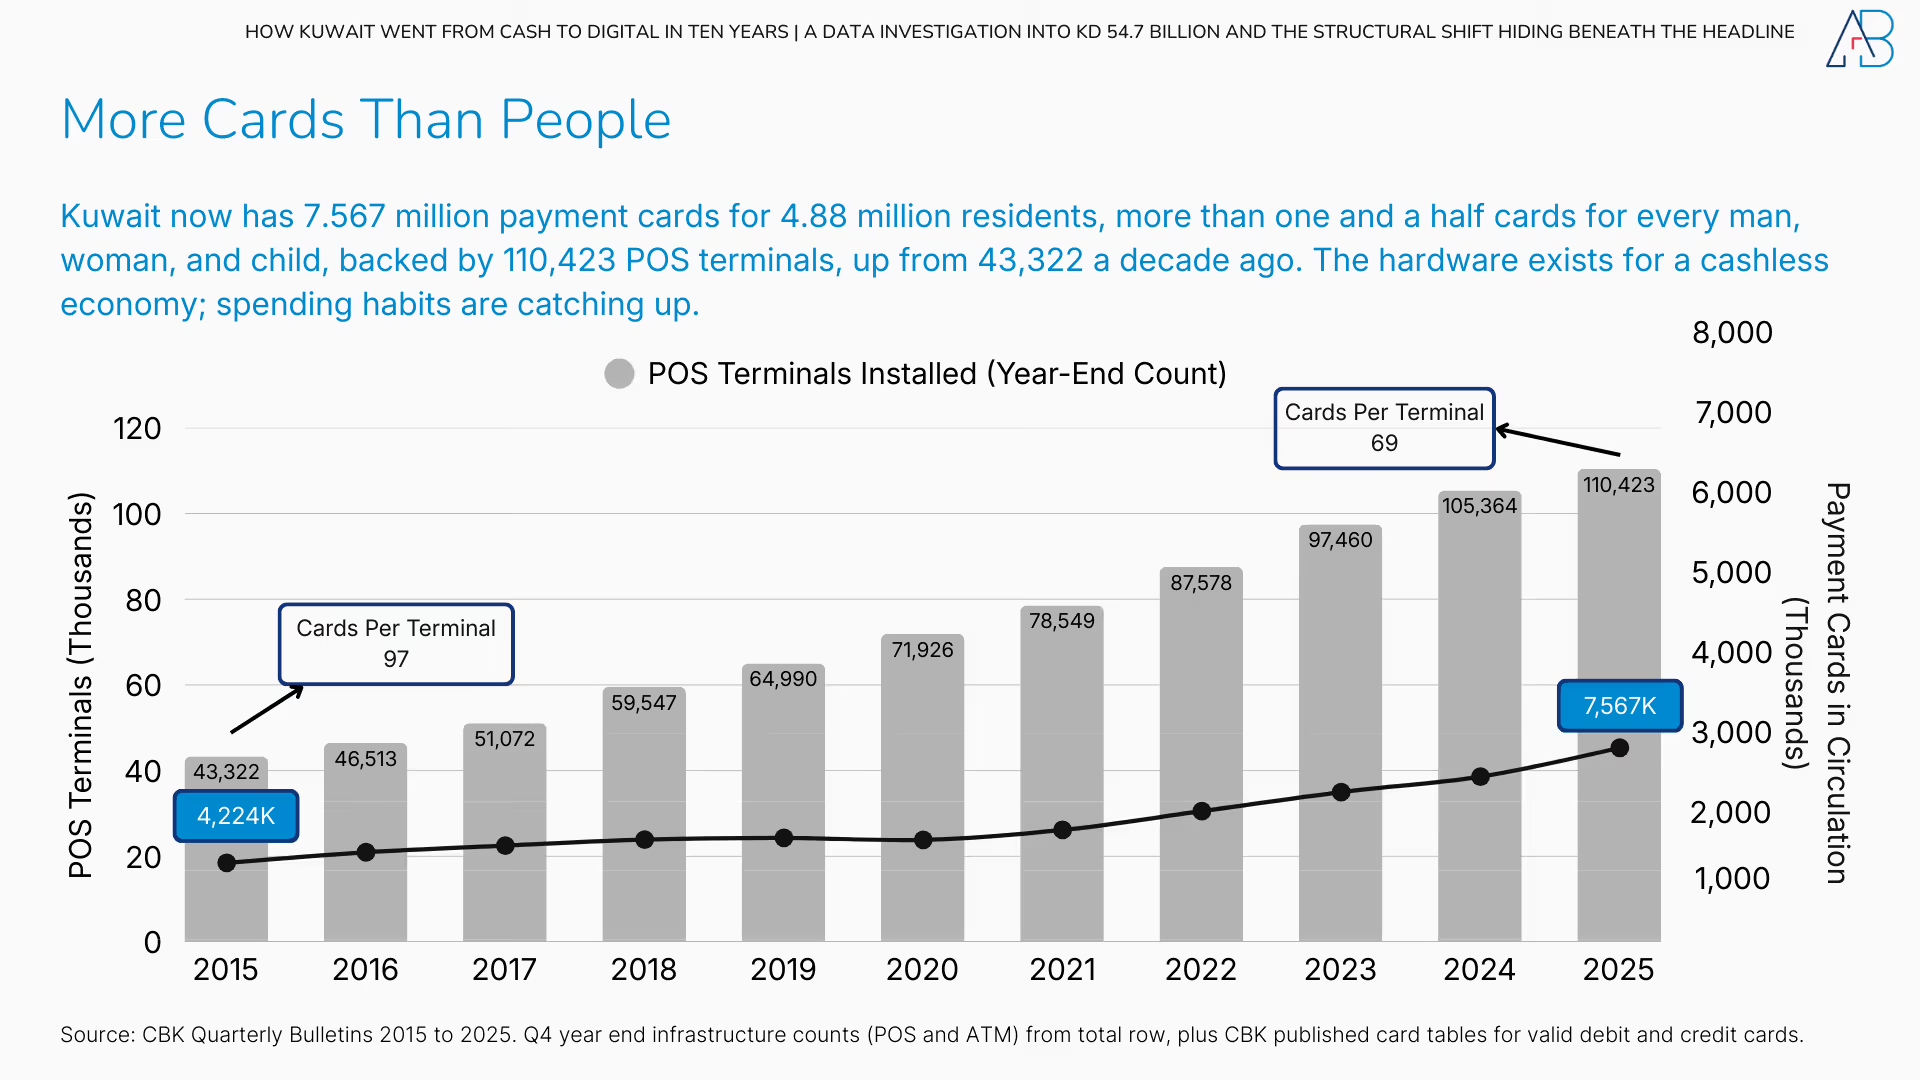
Kuwait now has 7.57 million payment cards for 4.88 million residents, more than 1.5 cards per person. The hardware is in place for a cashless economy; spending habits are catching up.
Kuwait’s terminals also serve foreign visitors and transit workers whose cards were issued abroad. Their spending behaviour independently confirms the same pattern: away from cash at ATMs and toward card tapping.
X. The Shrinking Transaction: From KD 85 to KD 36
While total spending grew 176 per cent, the average transaction size more than halved. In 2015, the average card transaction across all channels was KD 85. By 2025, it was KD 36. This single metric tells us more about how daily life has changed than any headline spending number.
In 2015, cards were used mainly for larger purchases and ATM withdrawals. A typical ATM withdrawal averaged KD 131. A POS transaction averaged KD 59. Small purchases such as coffee, parking, or a grocery run were paid for in cash. The card was the backup; cash was the default for anything under KD 20.
By 2025, cards and WAMD will be the default for everything. POS transactions average approximately KD 20 for local debit cards. Online transactions, especially through apps and delivery platforms, can be as small as KD 1–2. WAMD transfers average KD 73, but includes many small peer-to-peer payments. The card is now the first choice for micro-purchases, and cash is the backup.
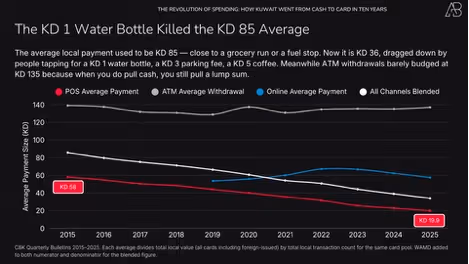
ATM is the only channel where the average transaction size changed little, from KD 131 to KD 133. People who still use ATMs do so for the same reason they always did: to withdraw a fixed amount of cash. The use case hasn’t changed; only the frequency has declined.
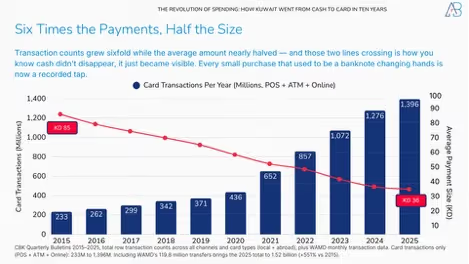
Transaction count is the clearest indicator of the depth of adoption. Kuwait recorded 1,396 million card transactions in 2025 (plus 120 million WAMD transfers), up from 233 million in 2015, a 499 per cent increase. The average card was tapped roughly 15 times per month in 2025, up from 5 in 2015. A KD 1.5 coffee, a KD 3 parking fee, and a KD 0.800 bottle of water; these micro-transactions were invisible in 2015 because they were paid in cash. They now generate electronic data, inflate transaction counts, and compress averages.
XI. Credit vs Debit: The Great Divergence
In 2015, credit cards accounted for 3.7 per cent of local spending. By 2025, that share had more than doubled to 8.2 per cent. That single number captures something the channel data misses: Kuwait is not just digitising; it is slowly becoming a credit-led market, driven in part by loyalty economics.
Consumers are shifting from earned-balance spending on debit cards to revolving credit.
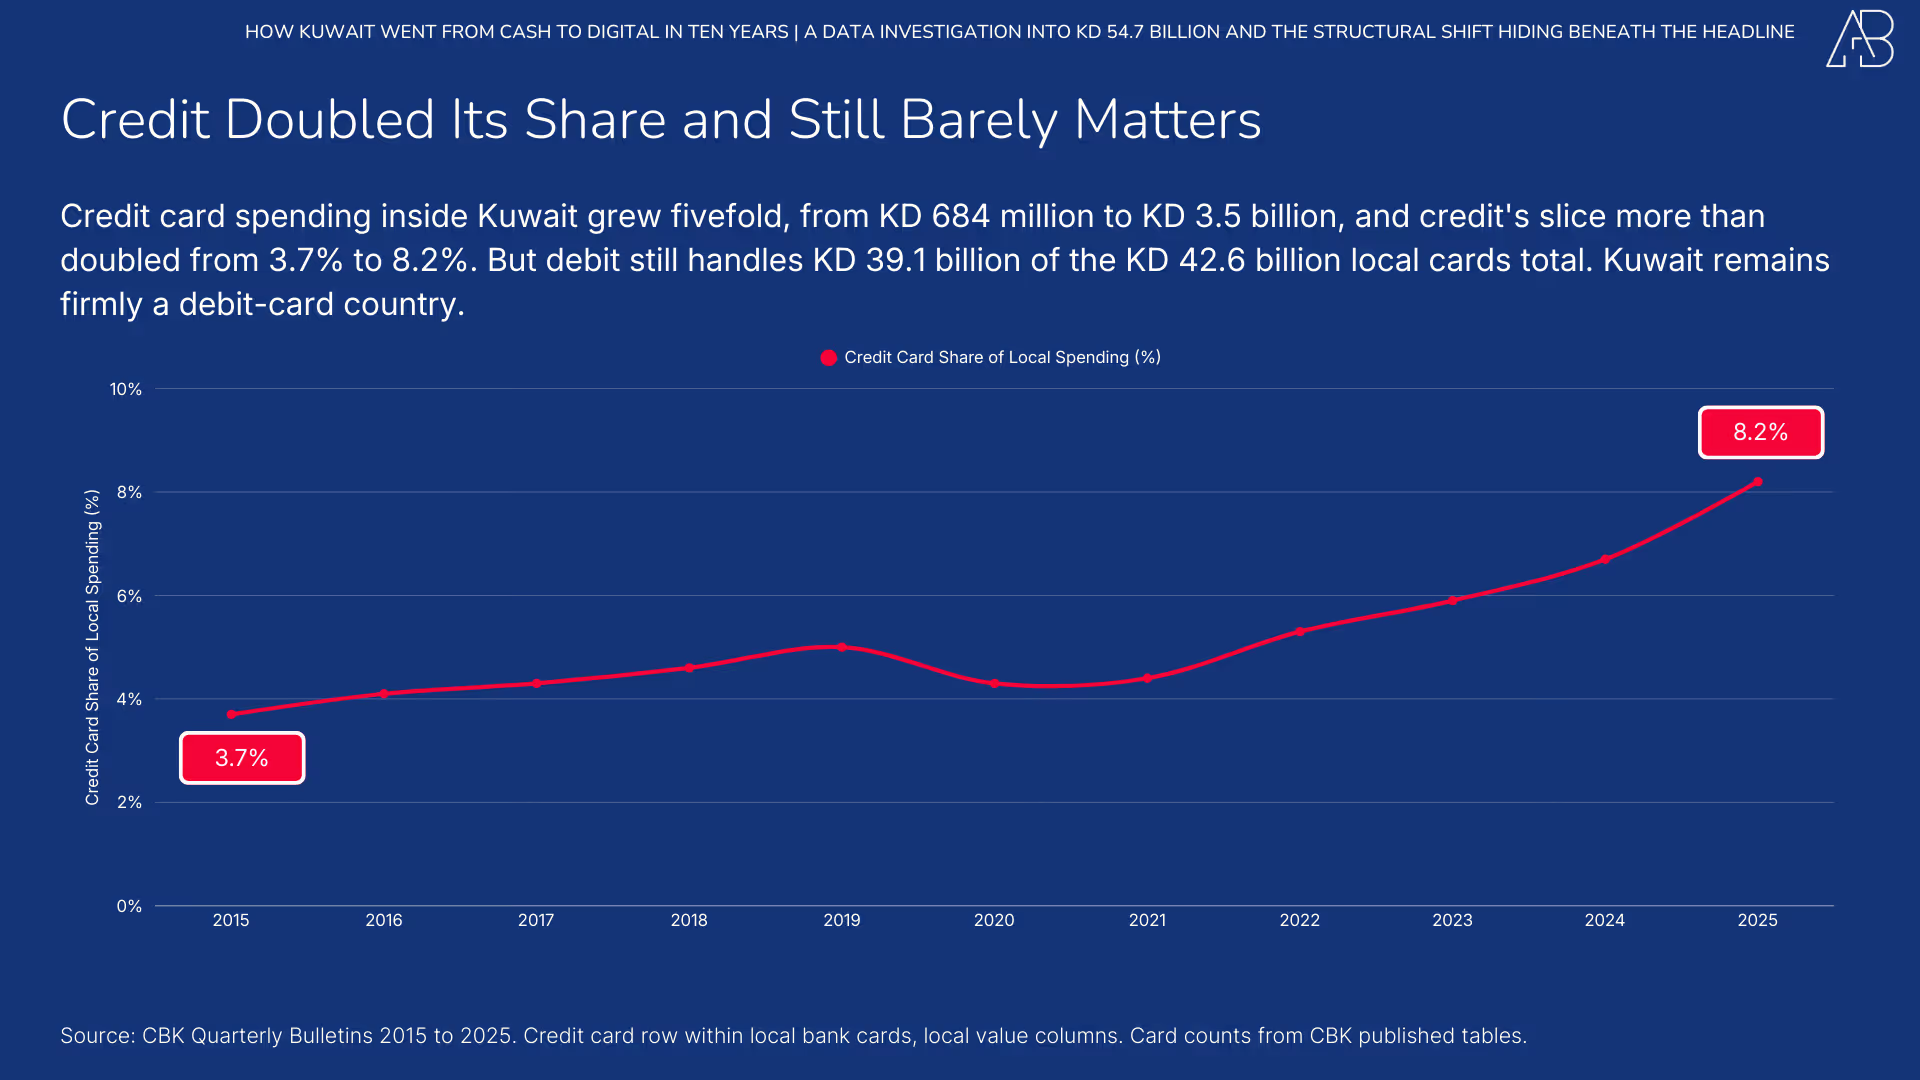
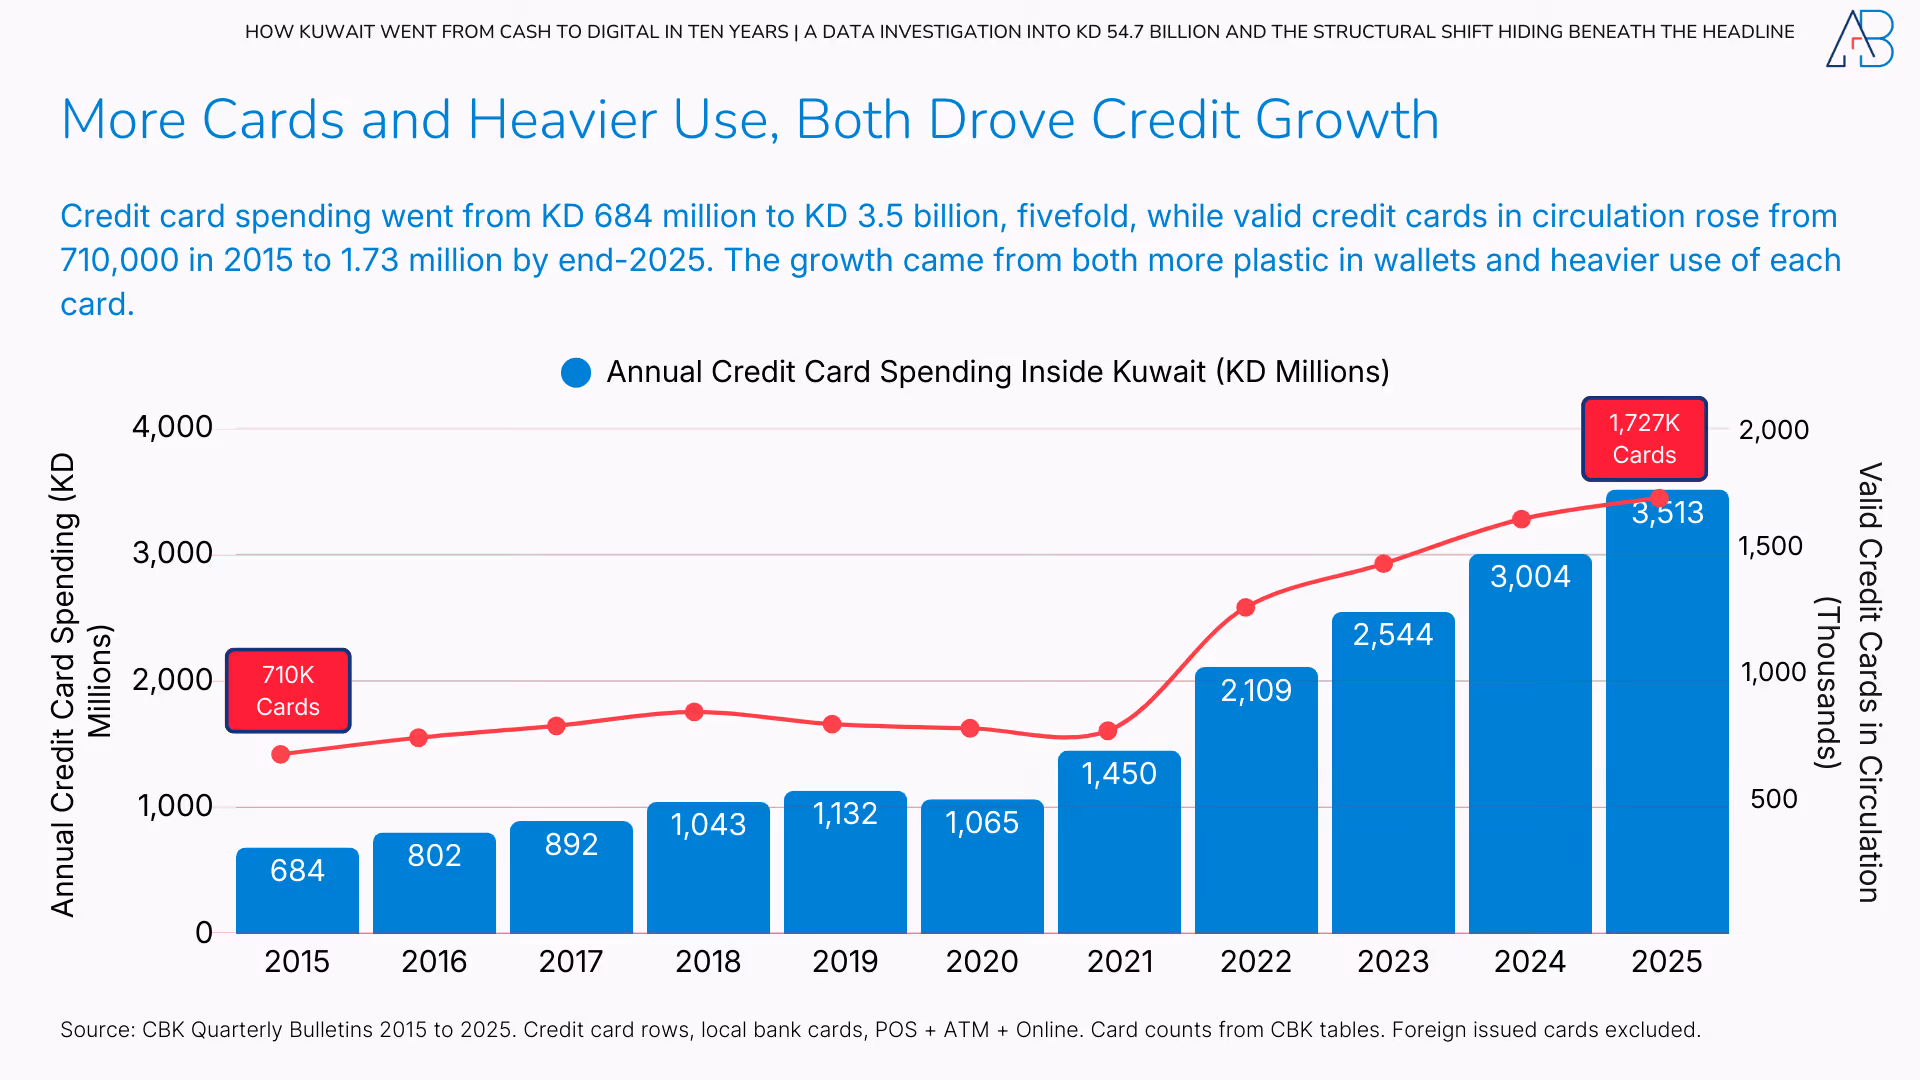
Credit card spending grew fivefold over the decade, from KD 684 million to KD 3.5 billion, while credit cards in circulation rose from 710,000 in 2015 to 1.73 million. The growth came from both more plastic in wallets and heavier use of each card.
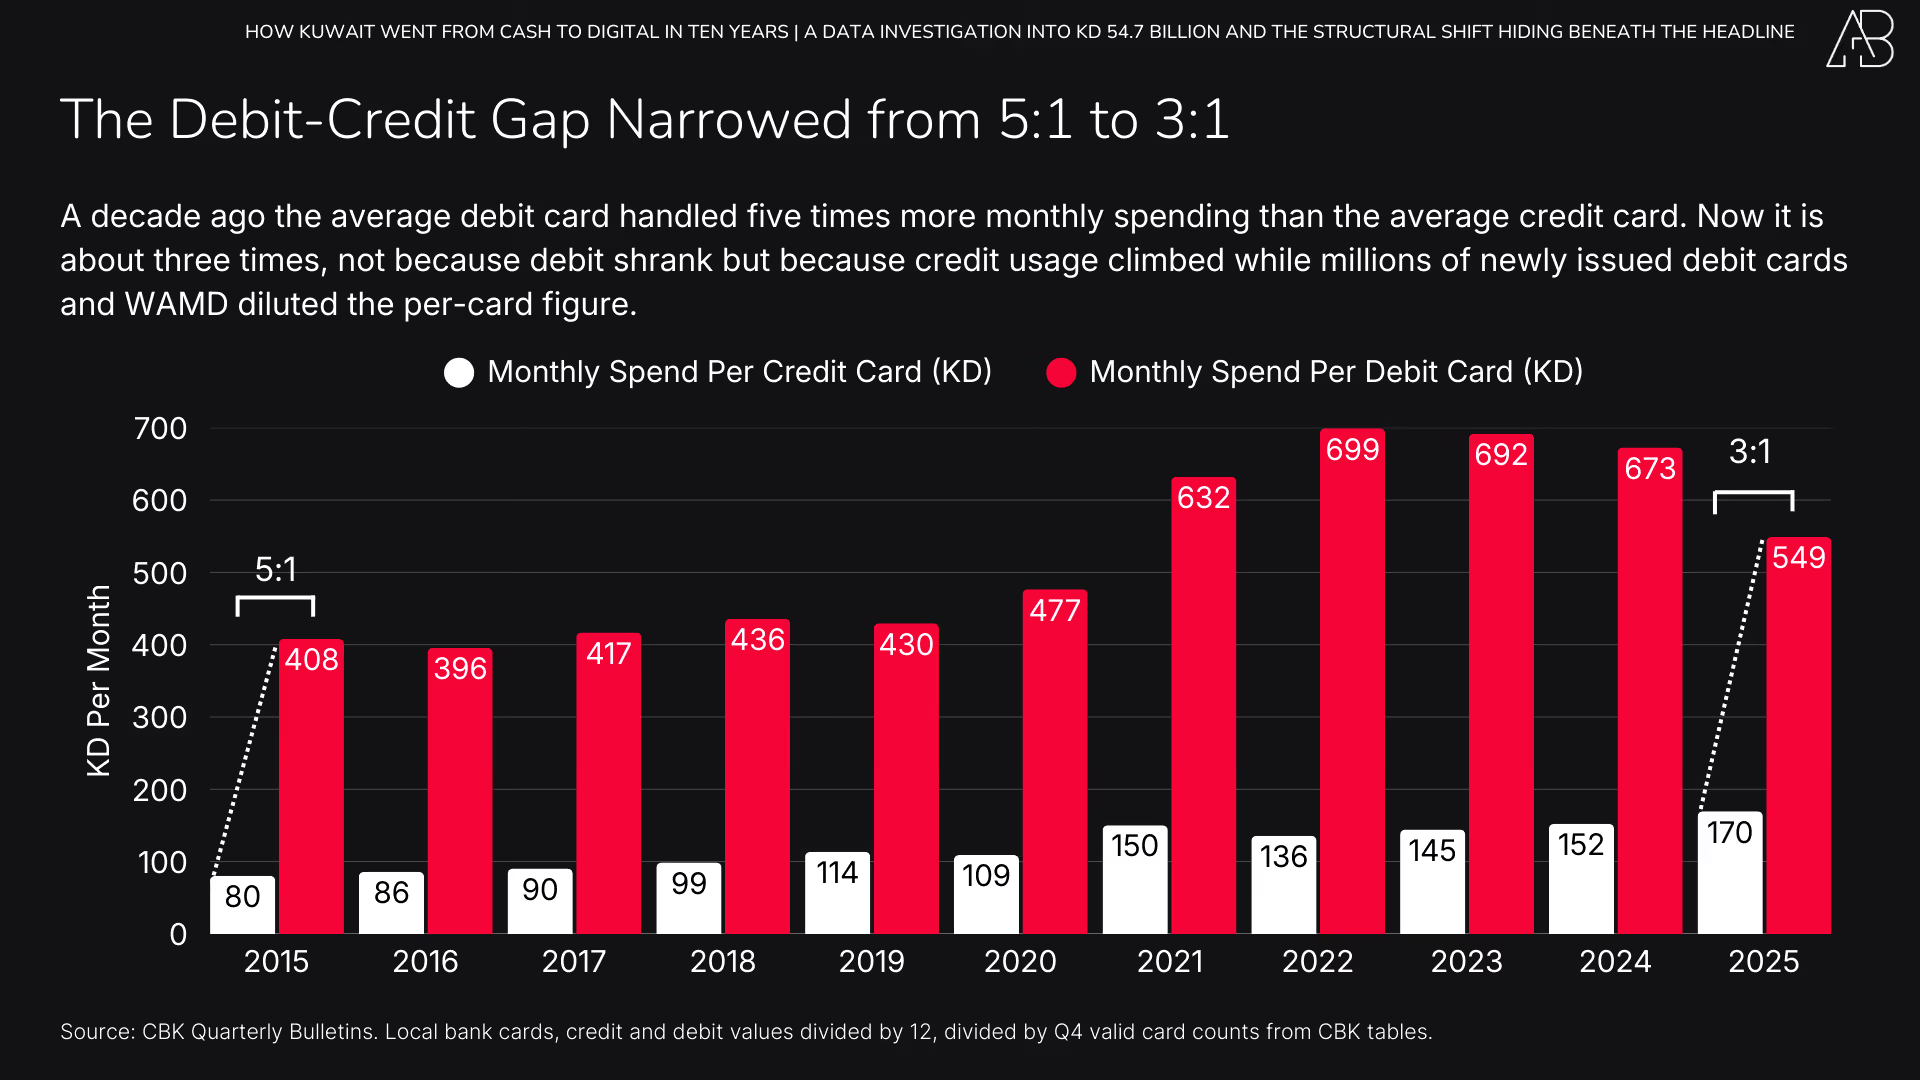
The per-card economics tell the divergence story most clearly. A decade ago, the average debit card processed five times the monthly spending of the average credit card. Now it is about three times, not because debit shrank, but because credit usage climbed while millions of newly issued debit cards and WAMD diluted the per-card figure. Average monthly spending per credit card rose from KD 80 to KD 170 over the decade, while average monthly debit card spending peaked at KD 699 in 2022 and fell to KD 549 in 2025 as WAMD captured routine payments.
Credit cards have become a lifestyle tool for travel, dining, online shopping, and rewards. Debit is becoming the utility card: groceries and whatever ATM use remains. This credit-debit divergence has real consequences for shop owners. A merchant paying KD 4,000 monthly rent needs to generate far more transactions at KD 20 per tap (the 2025 POS average) than at KD 59 per tap (the 2015 average). The maths have changed. The leases have not.
XII. More Machines, Less Throughput
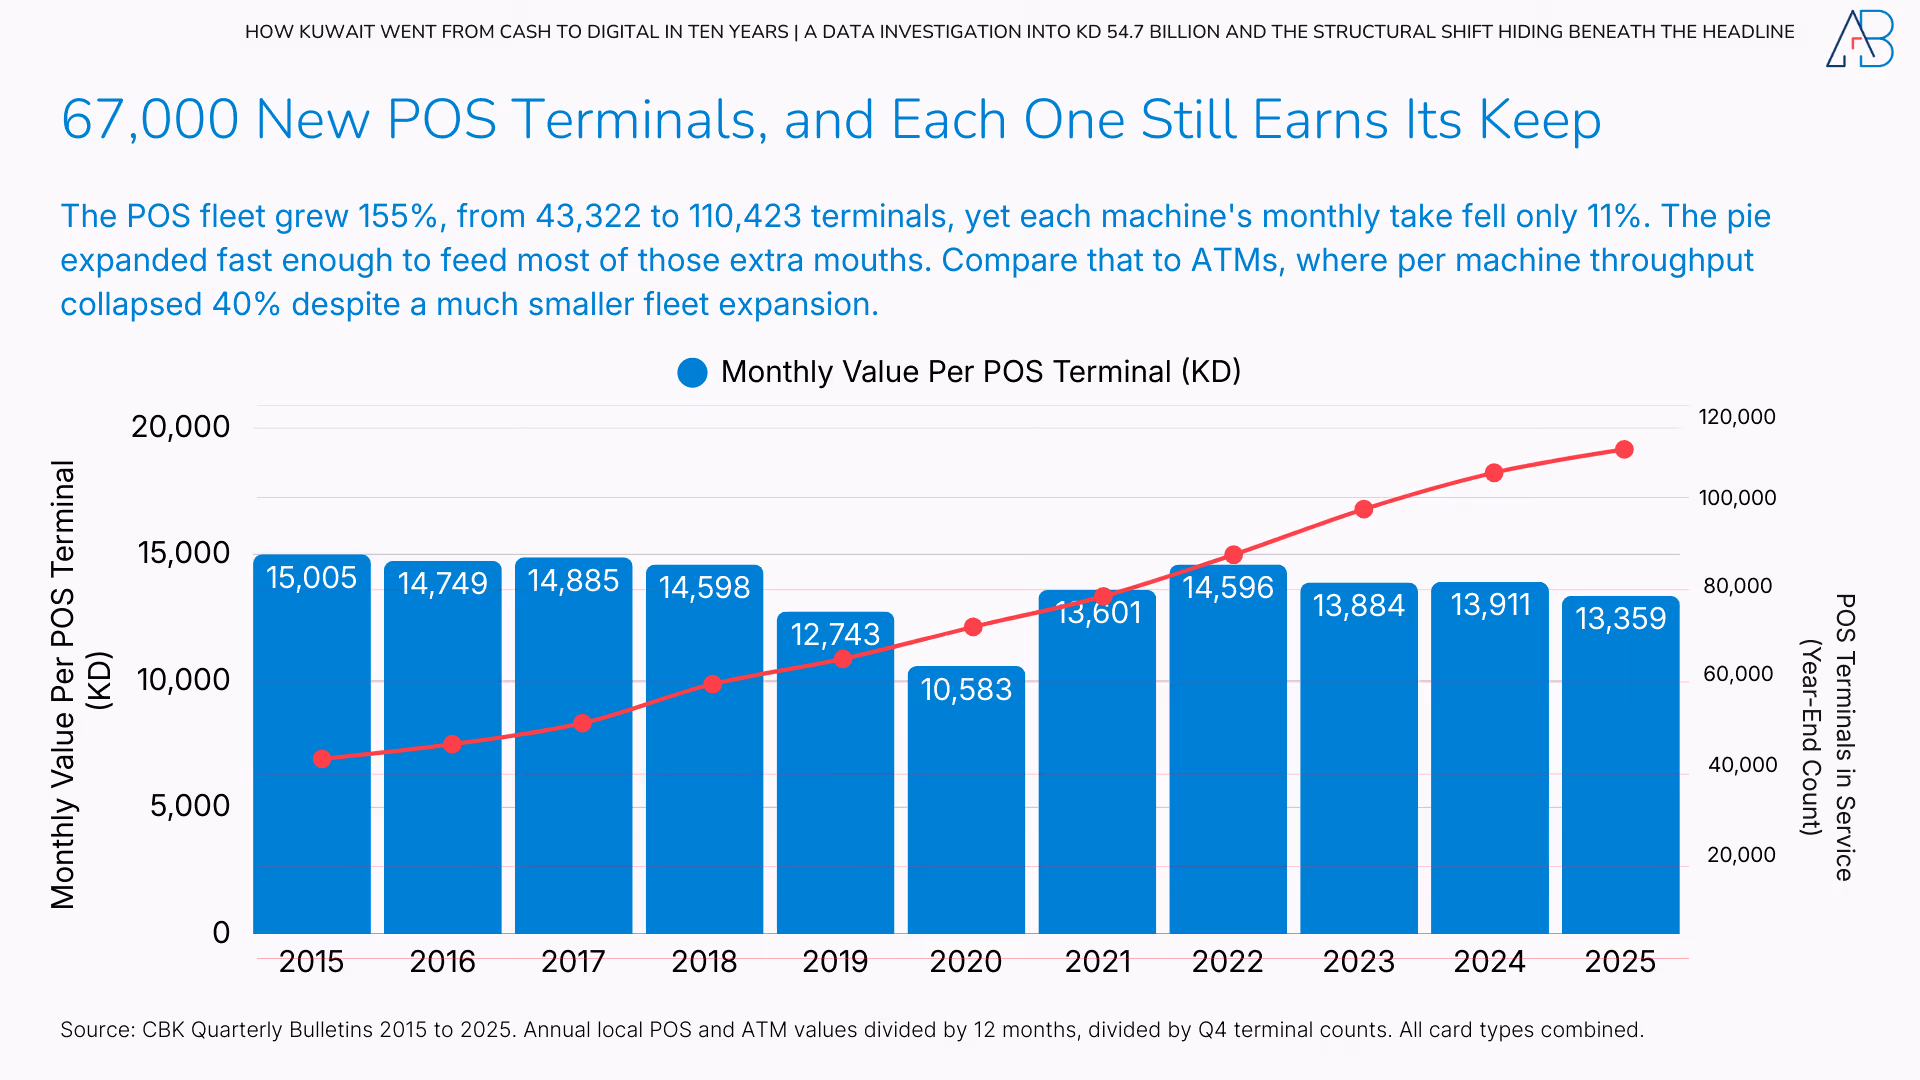
More machines, less revenue per machine. Banks deployed 67,000 new POS terminals over a decade, increasing the network by 155 per cent, from 43,322 to 110,423. Over the same period, the average terminal’s monthly revenue declined by 11 per cent, from approximately KD 15,080 to KD 13,359. The pie grew, but it was sliced thinner.
More machines, less revenue per machine. Banks deployed 67,000 new POS terminals in a decade, growing the network 155 per cent from 43,322 to 110,423. Over the same period, average monthly throughput per terminal fell 11 per cent, from about KD 15,080 to KD 13,359. The pie grew, but it was sliced thinner.
ATM economics deteriorated faster. Monthly cash processed per ATM machine dropped 40 per cent, from KD 526,000 in 2015 to KD 314,000 in 2025. Unlike POS terminals, ATM count barely moved; banks added a net 641 machines over ten years, then started trimming. The issue is not over-deployment but collapsing usage: ATM channel value fell while the machine count held steady, so each remaining machine processes less cash every year.
XIII. The Real Retail Paradox Explained
Four structural shifts redirect spending away from high-street merchants, explaining both the record total and the retail slump.
Shift 1: WAMD is not retail spending.
WAMD contributed KD 8.74 billion in 2025, but this was largely attributable to person-to-person transfers: splitting restaurant bills, paying rent to landlords, sending money to family, and paying a plumber. Very little of WAMD flows through formal retail tills. When you strip out WAMD, card spending was KD 46.0 billion, down 3.9 per cent from KD 47.8 billion in 2024. The decline reported by Al-Qabas closely matches this card-only trajectory.
Shift 2: Abroad spending grew while local spending fell.
Abroad card spending rose from KD 3.07 billion to KD 3.33 billion in 2025, an 8.6 per cent increase. Local card spending fell. Every additional dinar spent on a London hotel or a Shein order is a dinar not spent at a Kuwait mall. Leakage has grown from KD 1.2 billion in 2015 to KD 3.3 billion in 2025.
Shift 3: Online shopping is not mall shopping.
KD 16.1 billion was spent locally online in 2025. A meaningful share of that goes to delivery apps, digital subscriptions, telecom payments, government fees, and online-first merchants. These are not sales at Avenues Mall. A restaurant that sells through Talabat shows up in online spending, not POS spending. A consumer who purchases groceries via an app rather than driving to a Trolley shifts value from in-store to online channels. The total may be the same; for the physical merchant, the experience is a lost walk-in.
Shift 4: Smaller transactions, more frequency.
The average transaction fell from KD 85 to KD 36. This results in more transactions per person, but each transaction is worth less. A merchant who observes more people tapping cards but smaller baskets correctly perceives a decline in quality, even if the nominal value remains constant.
Strip out WAMD, and card spending fell 3.9 per cent. Add the KD 3.3 billion in overseas leakage, and the domestic retail wallet contracted by more than any headline number indicates.
XIV. Per Capita: KD 13,971 Per Card-Active Person
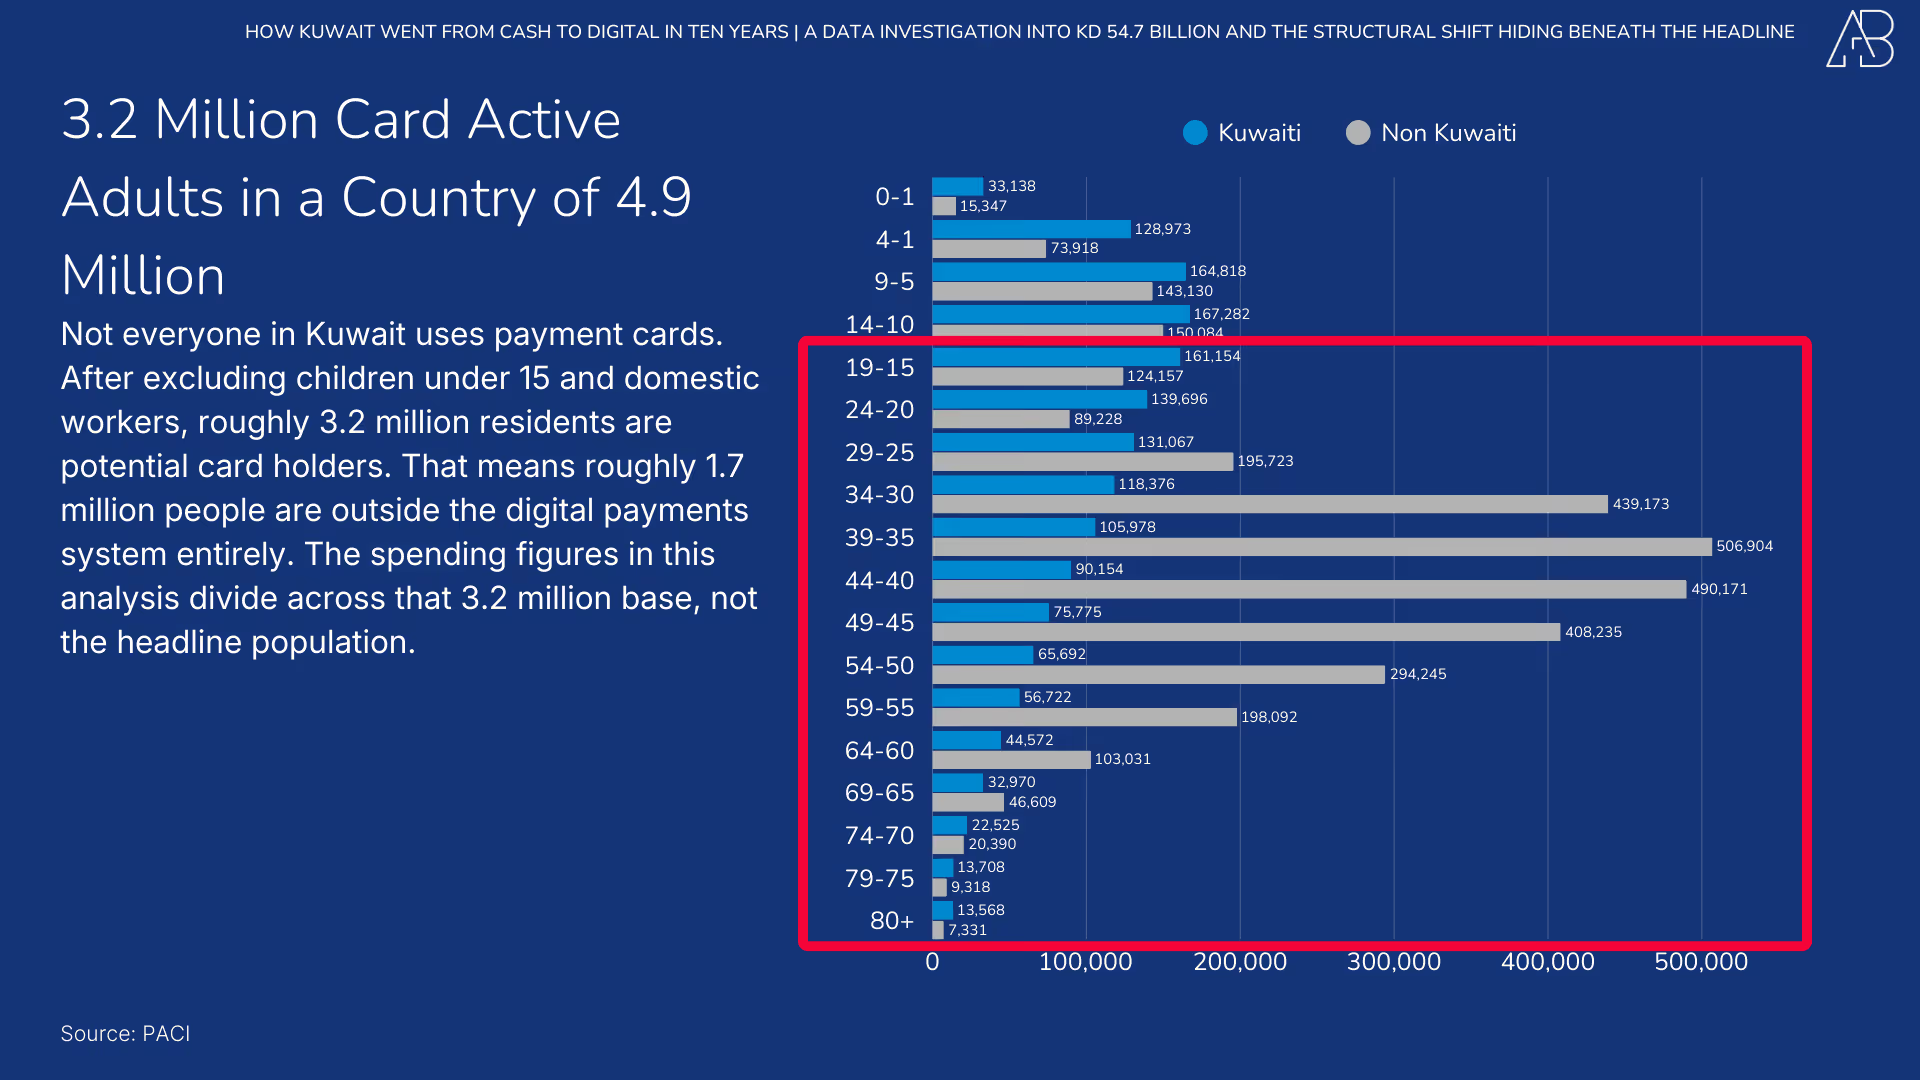
Aggregates can mislead in Kuwait because a large share of residents are not active card spenders. Kuwait has 4.88 million residents, but roughly 3.2 million are card-active adults (total population minus under-15s and a domestic-worker estimate). Measured against that card-active base, per capita card spending hit KD 13,971 per year in 2025, or KD 1,164 per month – a 73 per cent increase over the 2015 figure of KD 8,078 per year.
The PACI population pyramid makes this visible. Kuwait’s 4.88 million residents include roughly 480,000 children under five, more than 600,000 between five and fourteen, and a large domestic-worker population whose card usage is minimal. The working-age bulge lies between ages 25 and 44, dominated by non-Kuwaiti expatriates who constitute the labour force. After excluding non-card-active groups, approximately 3.2 million adults remain who actually swipe, tap, or transfer. Every per-capita figure in this analysis is divided by that base, not the headline population.
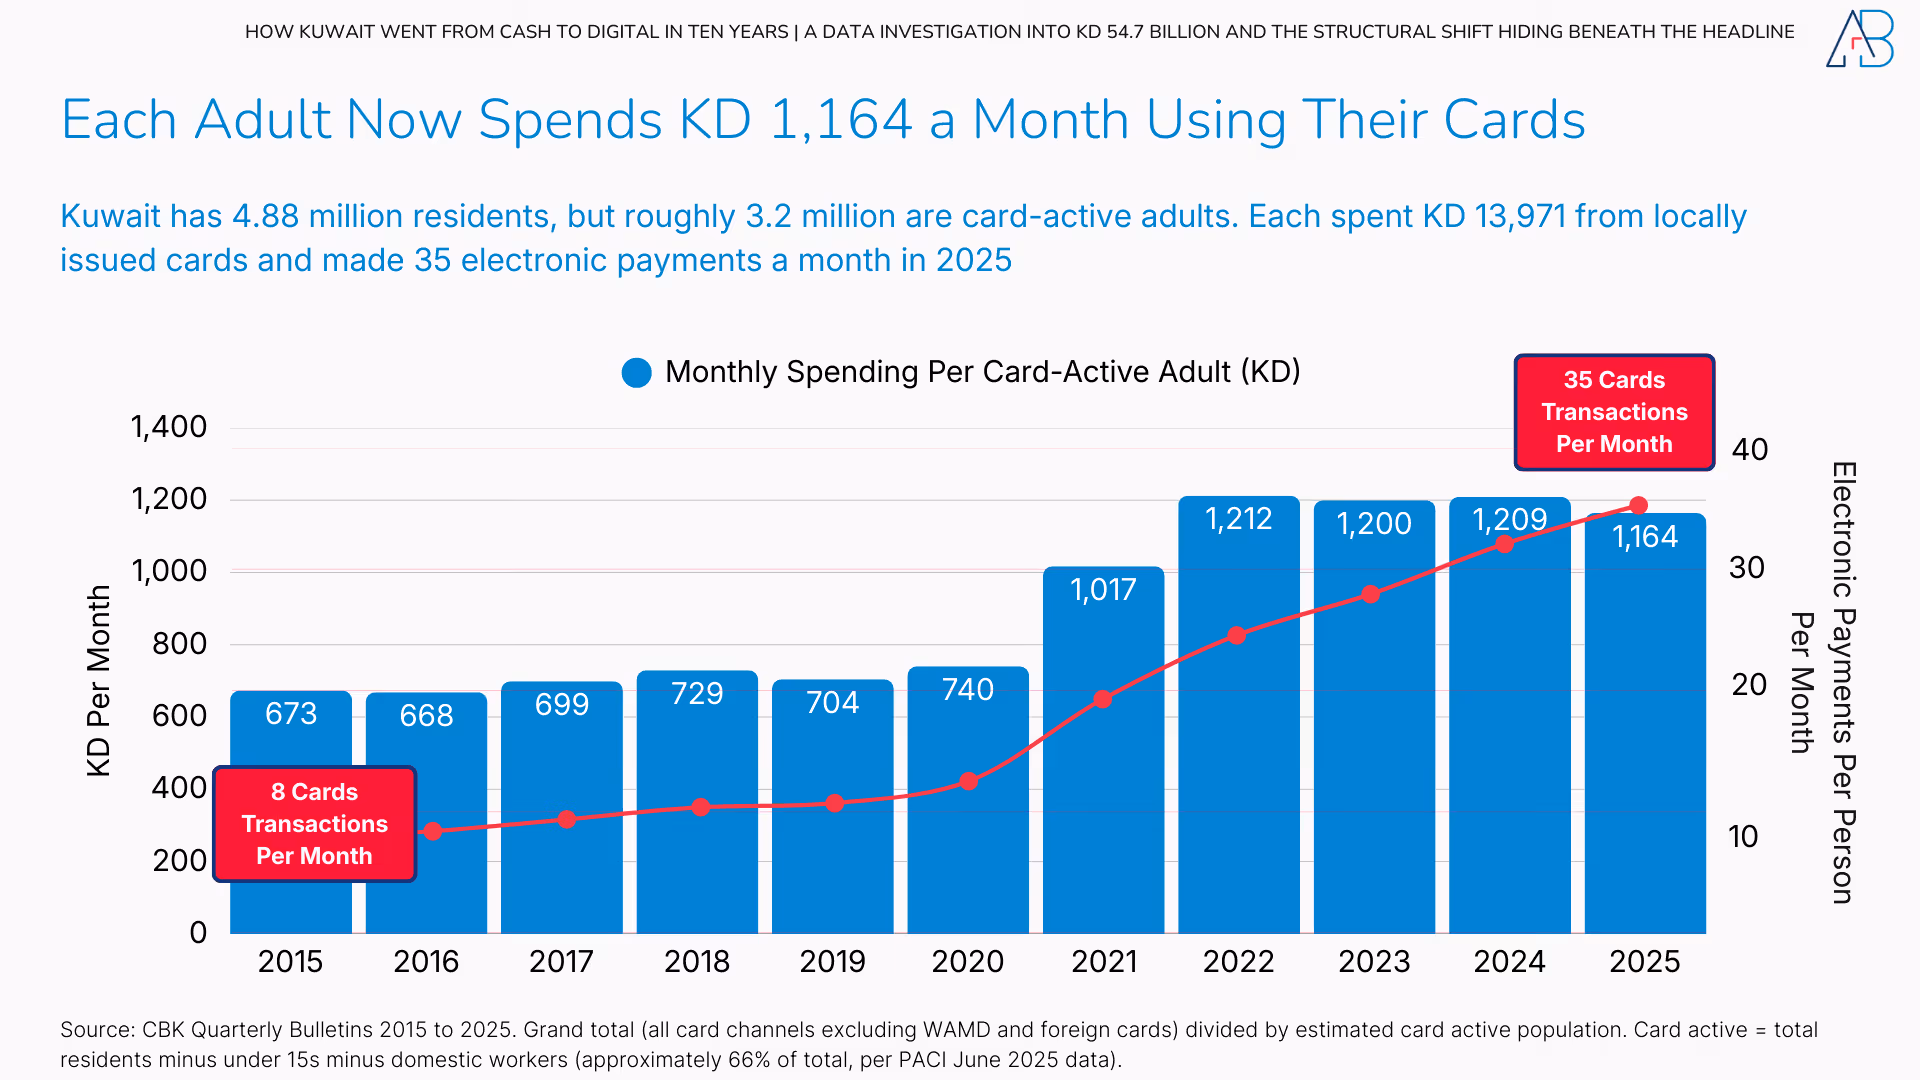
Transactions per card-active person tell an even more striking story. In 2015, each active person made roughly 101 card transactions per year, or about 8 per month. By 2025, that had risen to 420 per year (35 per month), more than one transaction per day. Cards went from a considered act (weekly supermarket shop, occasional petrol fill-up) to a reflexive habit (morning coffee, parking meter, delivery app, vending machine).
XV. Looking Forward
Several trends are now locked in. What follows is not a prediction but a consequence, the mathematics of current trajectories.
For Banks: The ATM Network Is Becoming a Liability
ATM withdrawals will keep falling. Each month, WAMD gains users, and the queue at the cash machine shortens. A KD 9.8 billion ATM channel (local) became a KD 8.8 billion channel in one year; if this pace holds, the next step down comes quickly. Kuwait still has 2,349 ATMs, up from 1,708 in 2015, but cash per machine has dropped 40 per cent. At some point, the economics force a decision: shrink the network, or continue subsidising machines that process fewer and fewer transactions while paying the same real-estate rent. The first bank to close 100 ATMs will make headlines. The last bank to keep them all open will face shareholders.
WAMD adoption will deepen further. The average WAMD transaction is declining quarter over quarter, from KD 82 at launch to KD 66 by December 2025, reflecting smaller, more routine use. Once merchants begin accepting WAMD directly, it will compete with POS terminals for small everyday payments, and the transaction fees banks earn on card swipes will shift to KNET’s cheaper rails. The result: a growing share of daily commerce will never touch a card.
For Retailers: The Showroom Problem Is Structural
The apparel retailer in Avenues Mall is not going through a bad quarter. He is living in a permanently altered market. The average overseas transaction fell from KD 77 to KD 24 over a decade, driven by millions of micro-purchases on cross-border platforms. The behavioural shift has occurred: Kuwaiti consumers now compare prices across platforms before visiting a store, and this reflex does not reverse.
The total spending pie is growing. The retailer’s slice is not. Merchants who capture digital flows, manage delivery, enable online ordering, offer digital loyalty, or deliver an experience that justifies the visit will adapt. Those relying on foot traffic alone will find the data increasingly hostile.
For Policymakers: KD 3.3 Billion Leaves the Country Every Year
Abroad spending is structural, not cyclical. Kuwait’s demographics, high disposable income, extreme summer climate, and small domestic market guarantee continued outflows. In 2025, KD 3.3 billion left the country through card and online transactions. Every dinar spent abroad is a dinar that does not circulate through a Kuwaiti supply chain, does not generate Kuwaiti employment, and does not contribute to municipal revenue.
The Shein and Temu wave adds a sharper edge. Mohammed Alshaya’s 28,000-parcels-a-day figure represents commerce that employs no citizens, generates no business rates, and undercuts domestic retailers who do both. The policy question is not how to stop cross-border e-commerce; that train has left. It is about ensuring the domestic commercial ecosystem can coexist with it: through customs-threshold reform, digital commerce licensing, or incentive structures that level the tax treatment between a parcel from Guangzhou and a purchase from a shop in Hawally.
The Decade in One Table
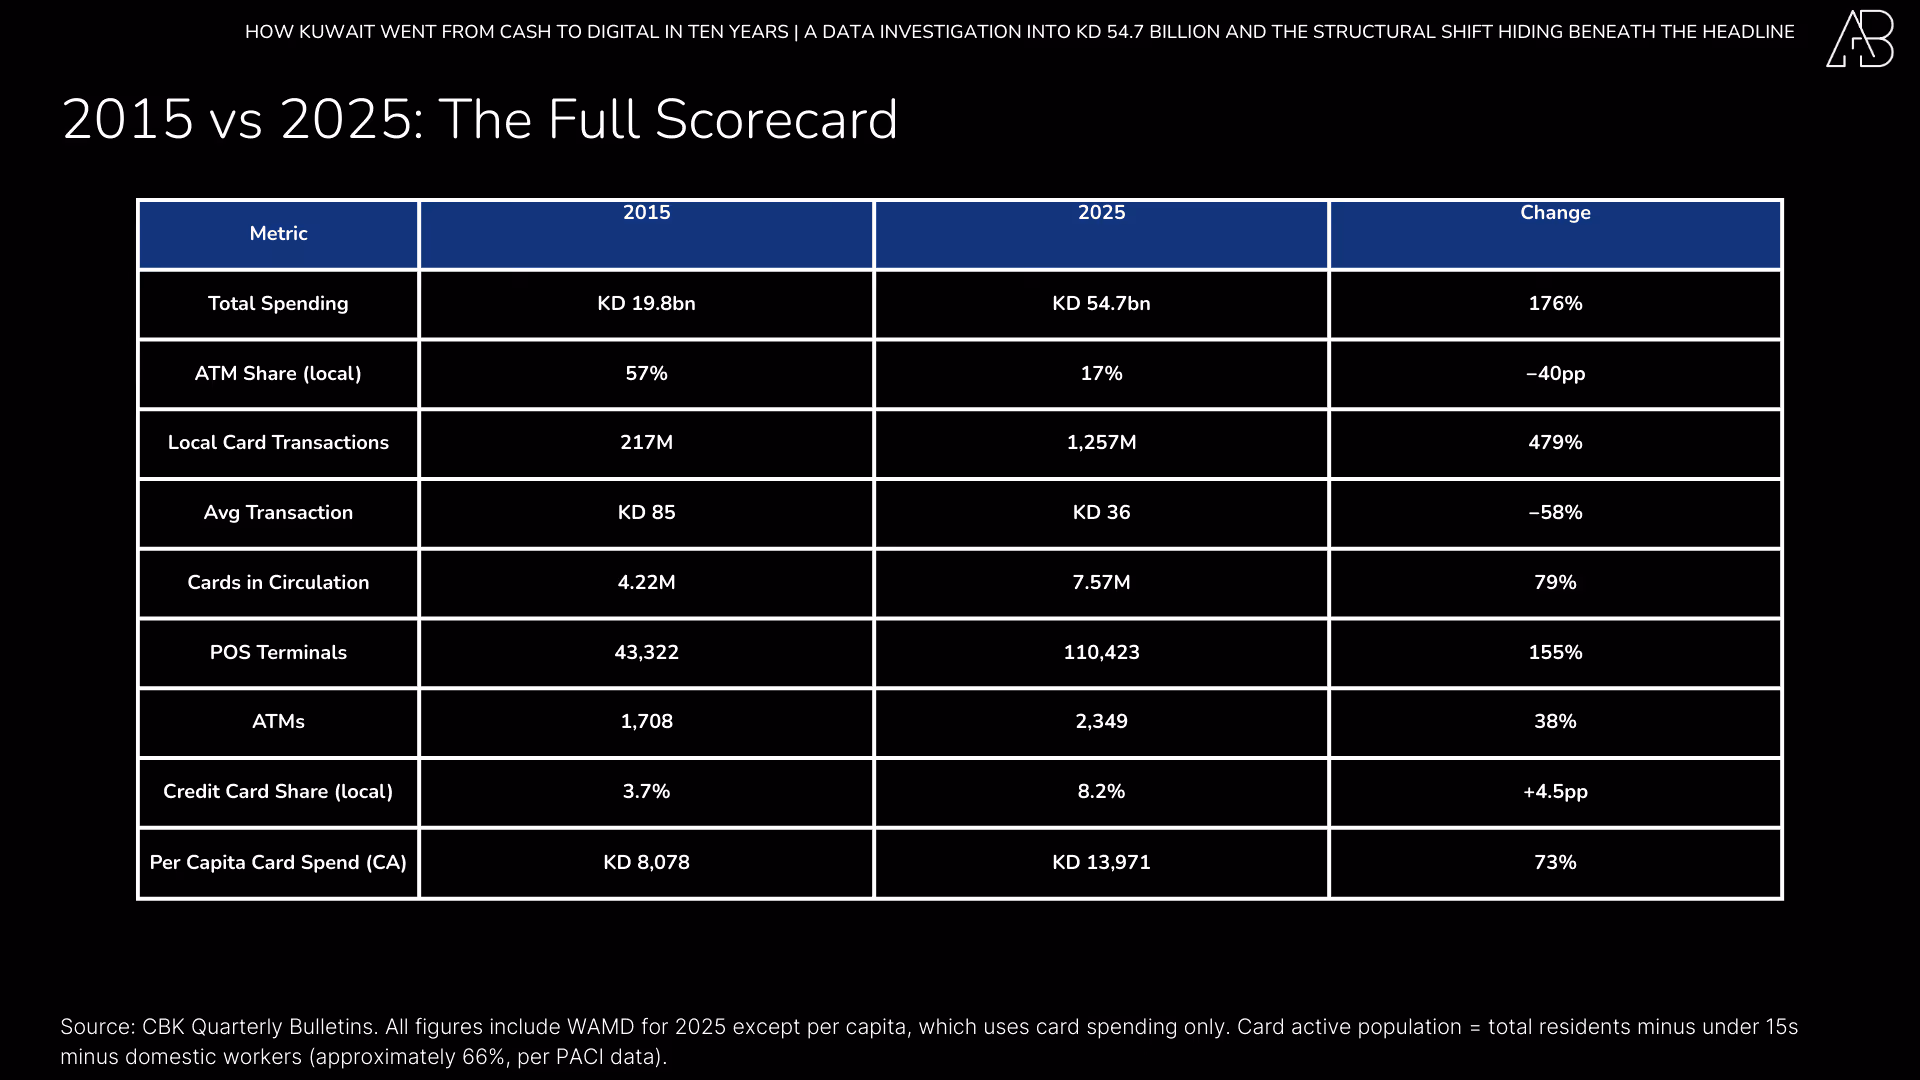
The question is no longer whether Kuwait goes cashless. The data has already answered that. In 2015, nearly six of every ten dinars were moved via ATMs. By 2025, that figure was fewer than two. What changed was not a single policy or a single technology but a cascade: a pandemic that forced adoption, a smartphone generation that kept it, a cross-border e-commerce wave that shrank the average purchase to a fraction of what it once was, and an instant-transfer system that arrived just as cash was running out of reasons to exist. Ten years of Central Bank data do not describe a gradual evolution. They describe a replacement – fast, structural, and still accelerating.

Ali Bahbahani is the founder of Ali Bahbahani & Partners. The full presentation, underlying data, and additional commentary on Kuwait's Economic landscape are available at alibahbahani.com. For an earlier analysis of 2025 quarterly spending trends, see "Kuwait's Payment Revolution in 2025"
Definitions & Methodology
KD = Kuwaiti Dinar (1 KD ≈ US$3.2–3.3).
Online = CBK “Payment Gateway” (card-not-present transactions).
WAMD = KNET instant transfers (mobile-number addressing, bank-to-bank).
Cards Only = POS + ATM + Online (ex-WAMD).
Local = transactions at merchants/ATMs inside Kuwait.
Abroad = transactions outside Kuwait.
All data from Central Bank of Kuwait quarterly statistical bulletins (value files 2016a.xls through 2025.xls; count files 2016b.xls through 2025c.xls; WAMD data from 2025d.xls).
Annual figures aggregated from quarterly data, using the most recent publication for overlapping periods (later publications contain revised figures).
Online/Payment Gateway tracked from mid-2019.
WAMD tracked from December 2024.
Channel shares calculated using total spending, including WAMD, where applicable.
Abroad spending = POS abroad + ATM abroad + Online abroad.
Average ticket = value (KD millions) ÷ transactions (thousands). Daily averages use 365 days for full years, 92 days for Q3 (July–September), 90 days for Q1, 91 days for Q2.
Per capita figures based on card-active population (total population minus under-15 and domestic workers) from PACI and CBK.
All figures in Kuwaiti Dinars unless stated.
Population and macro data from PACI, World Bank, IMF.