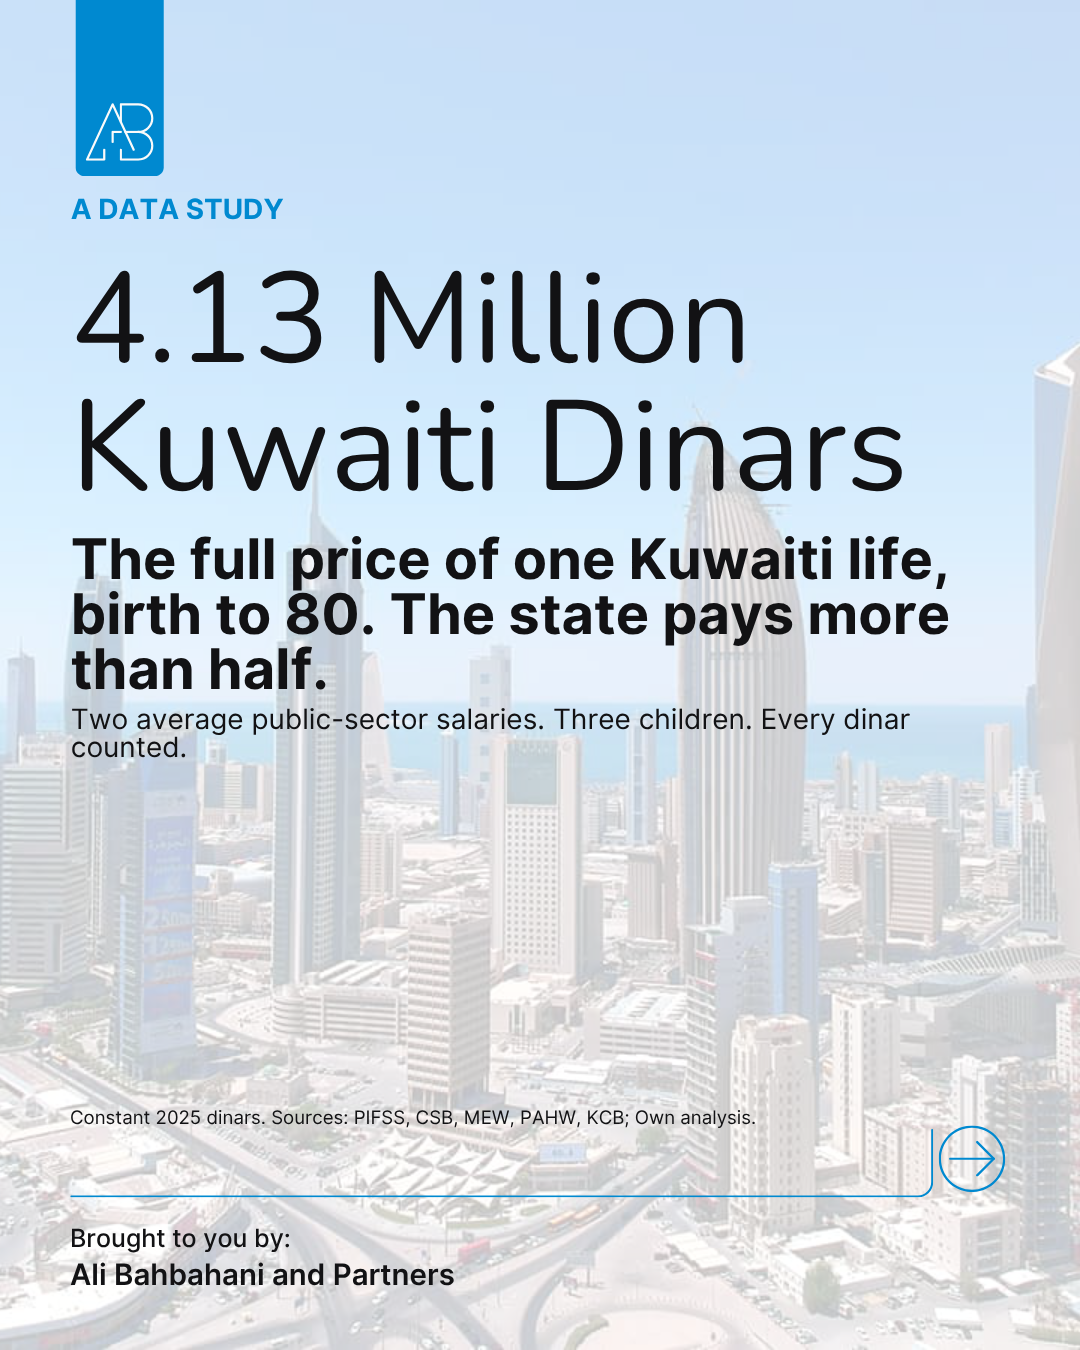
The Kuwaiti Dream, Priced: One Life Costs KD 4.13 Million

.webp)
Every debate about subsidies, pensions or housing in Kuwait eventually collides with the same problem: nobody has priced the whole thing. We argue about electricity tariffs in isolation, about the housing queue in isolation, about PIFSS in isolation. The full lifetime picture. What one citizen's household receives, spends and returns from birth to old age is rarely laid out in one ledger.
So we built one. A modelled Kuwaiti household: a couple on two average public-sector salaries, married at 28, three children, followed from the husband's birth to age 80. Every cost priced year by year in constant 2025 dinars, then split between what the family pays from its own pocket and what the state provides. Salaries are excluded; this is the cost side of a life, not the income side.
The total is KD 4.13 million. In this model, the state funds 55% of it and the household directly returns about nine fils for every dinar of gross public support it receives.
The study draws on PIFSS statistical reports, Central Statistical Bureau household expenditure data, MEW cost disclosures, and the published rules of PAHW and the Kuwait Credit Bank. Every assumption is declared. The workbooks can be checked line by line and everything that follows describes this modelled household, not a national fiscal estimate.
Fourteen lines, one life
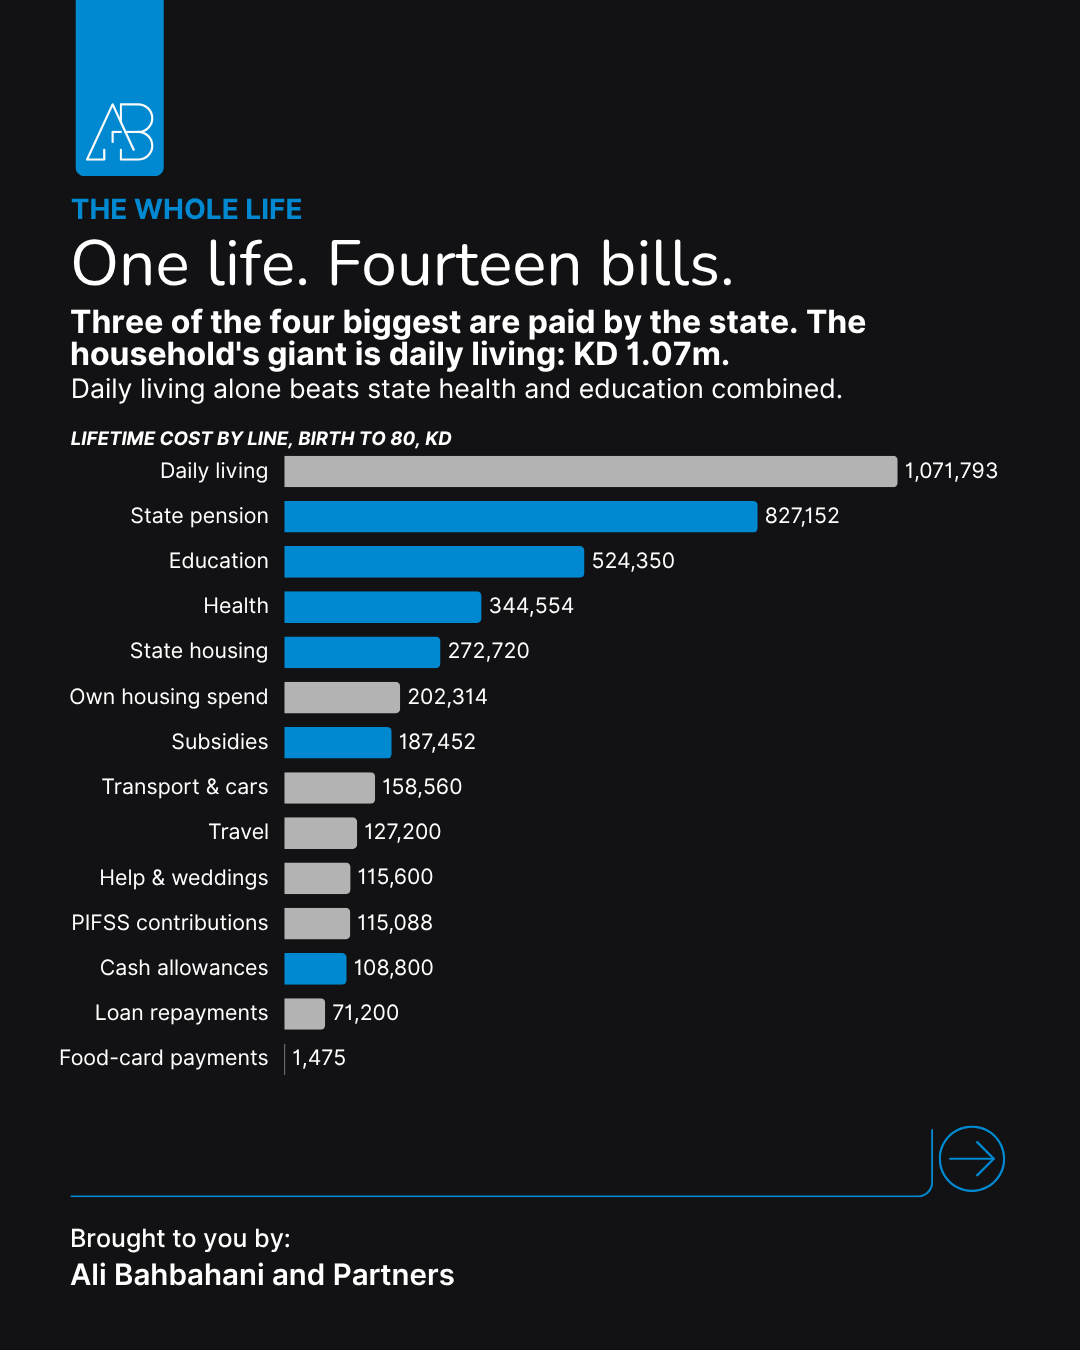
Lay out every lifetime cost line and a pattern appears immediately: three of the four largest are paid by the state. The pension, net of the household's own PIFSS contributions, is KD 827,152. Education is KD 524,350. Health is KD 344,554.
The household's only entry in the top four is the biggest line of all: daily living, at KD 1.07 million is larger than state health and state education combined. The state's commitments are enormous, but the quiet, recurring cost of running a family is the largest number in a Kuwaiti life. We saw the same pattern from the other direction in Kuwait's payment data: daily spending is where the real money moves.
Who pays, and when
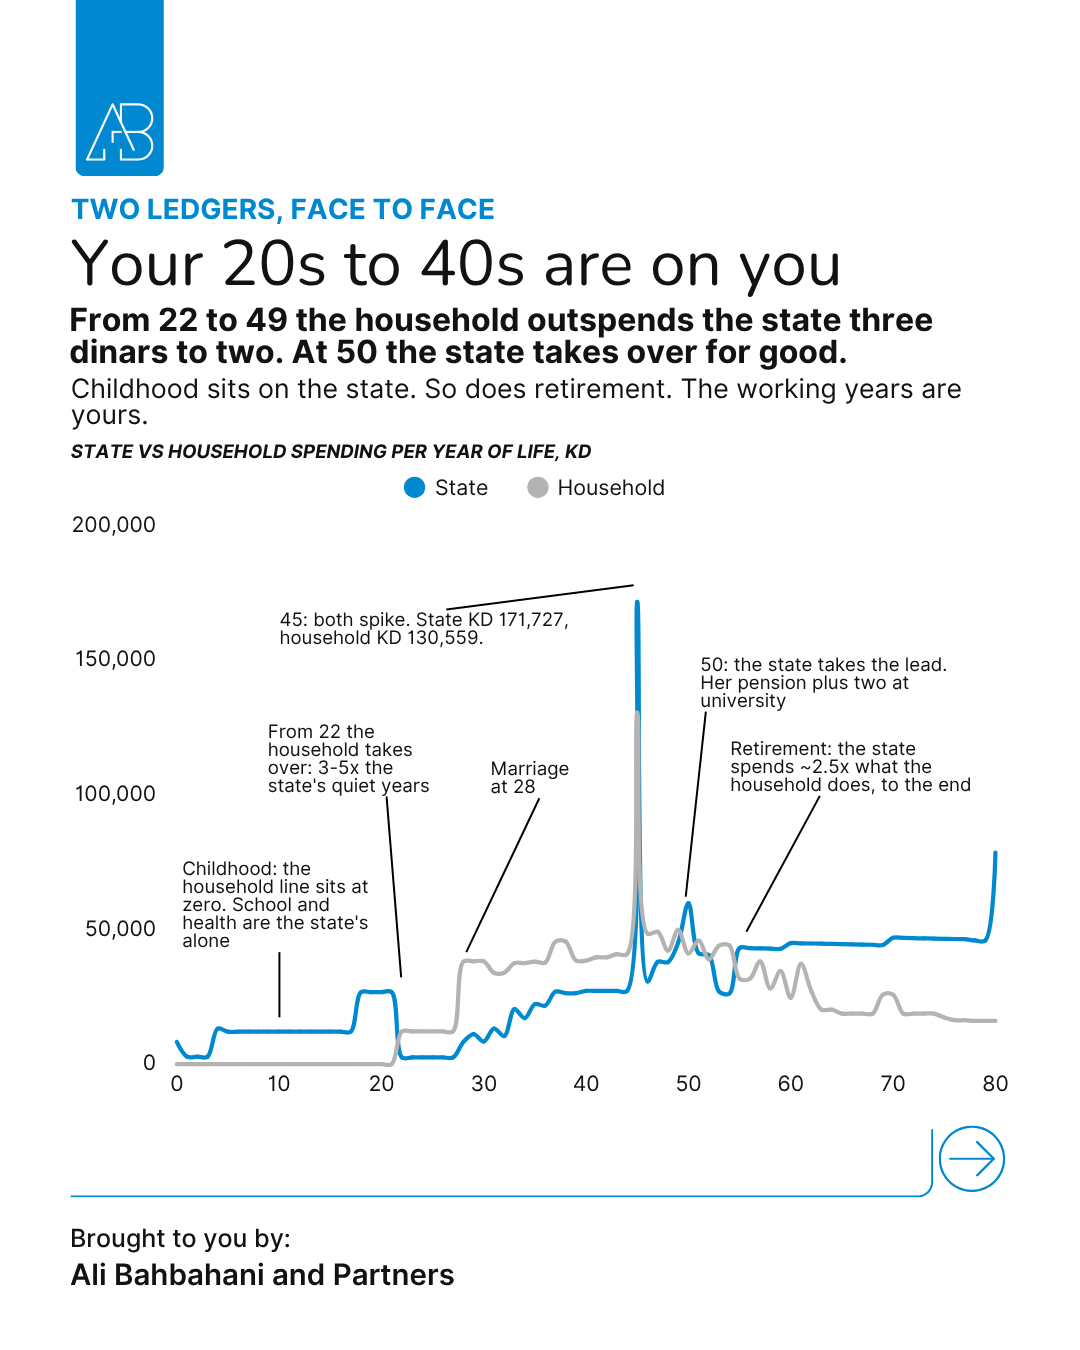
From birth to 21, the household line sits at zero: the anchor's childhood costs belong to his parents, outside the model, while school and health sit on the state's ledger. From the first salary at 22, the balance inverts: through the working years the household outspends the state roughly three dinars to two. Two moments break the pattern. At 45, the housing allocation lands, and both lines hit their lifetime peaks in a single year. KD 171,727 from the state, KD 130,559 from the household. At 50, the wife's pension begins, the state takes the lead, and it never gives it back.
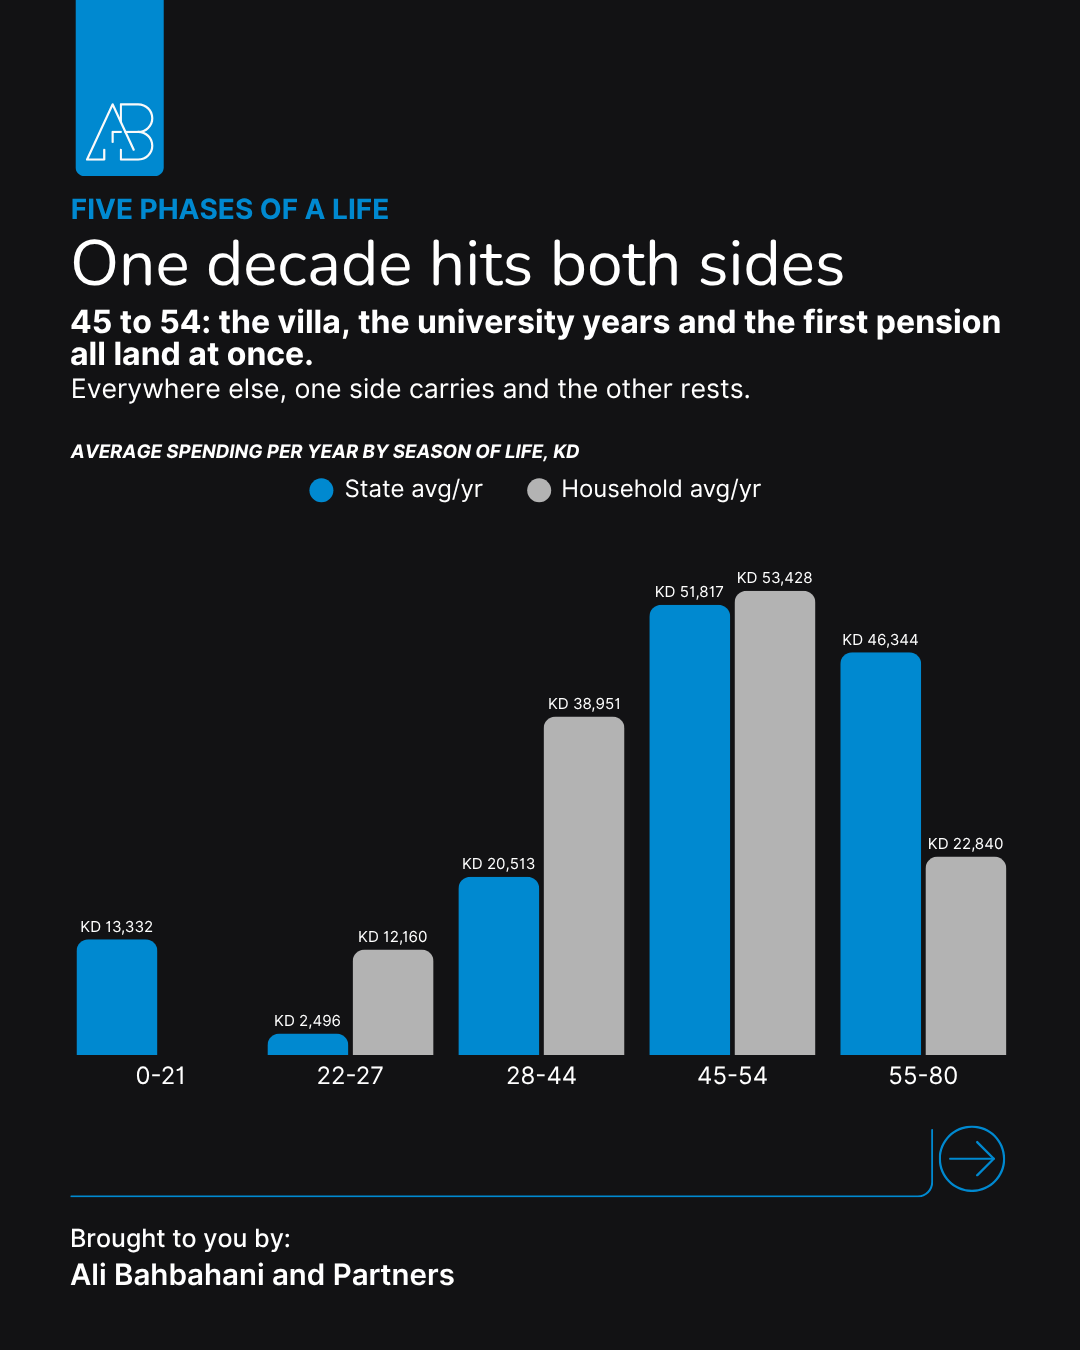
Compressed into five phases, one finding stands out: only one decade is heavy for both sides at once. Between 45 and 54, the villa, the university years and the first pension collide. Everywhere else, one side carries and the other rests.
The household's own money
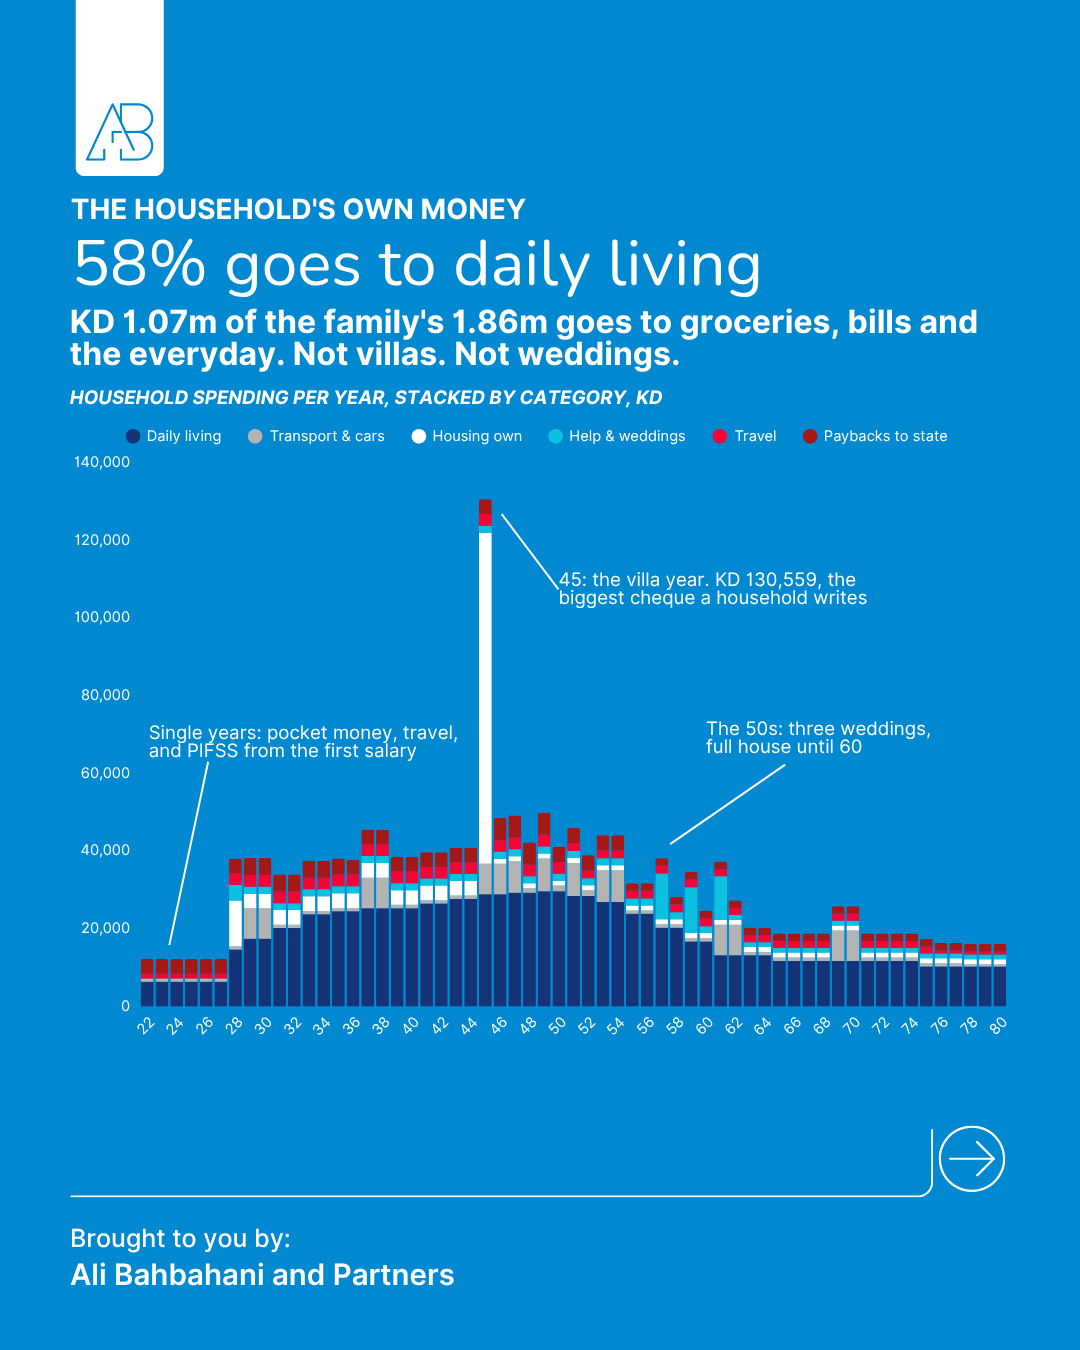
The family spends KD 1.86 million over the life, and 58% of it goes to daily living rather than events. The events still matter: villa construction at 45 produces the largest cheque a household writes, and three weddings keep the 50s expensive. Travel takes KD 127,200 across the life, consistent with the structural summer exodus visible in ten years of CBK spending data.
Where the state's money goes
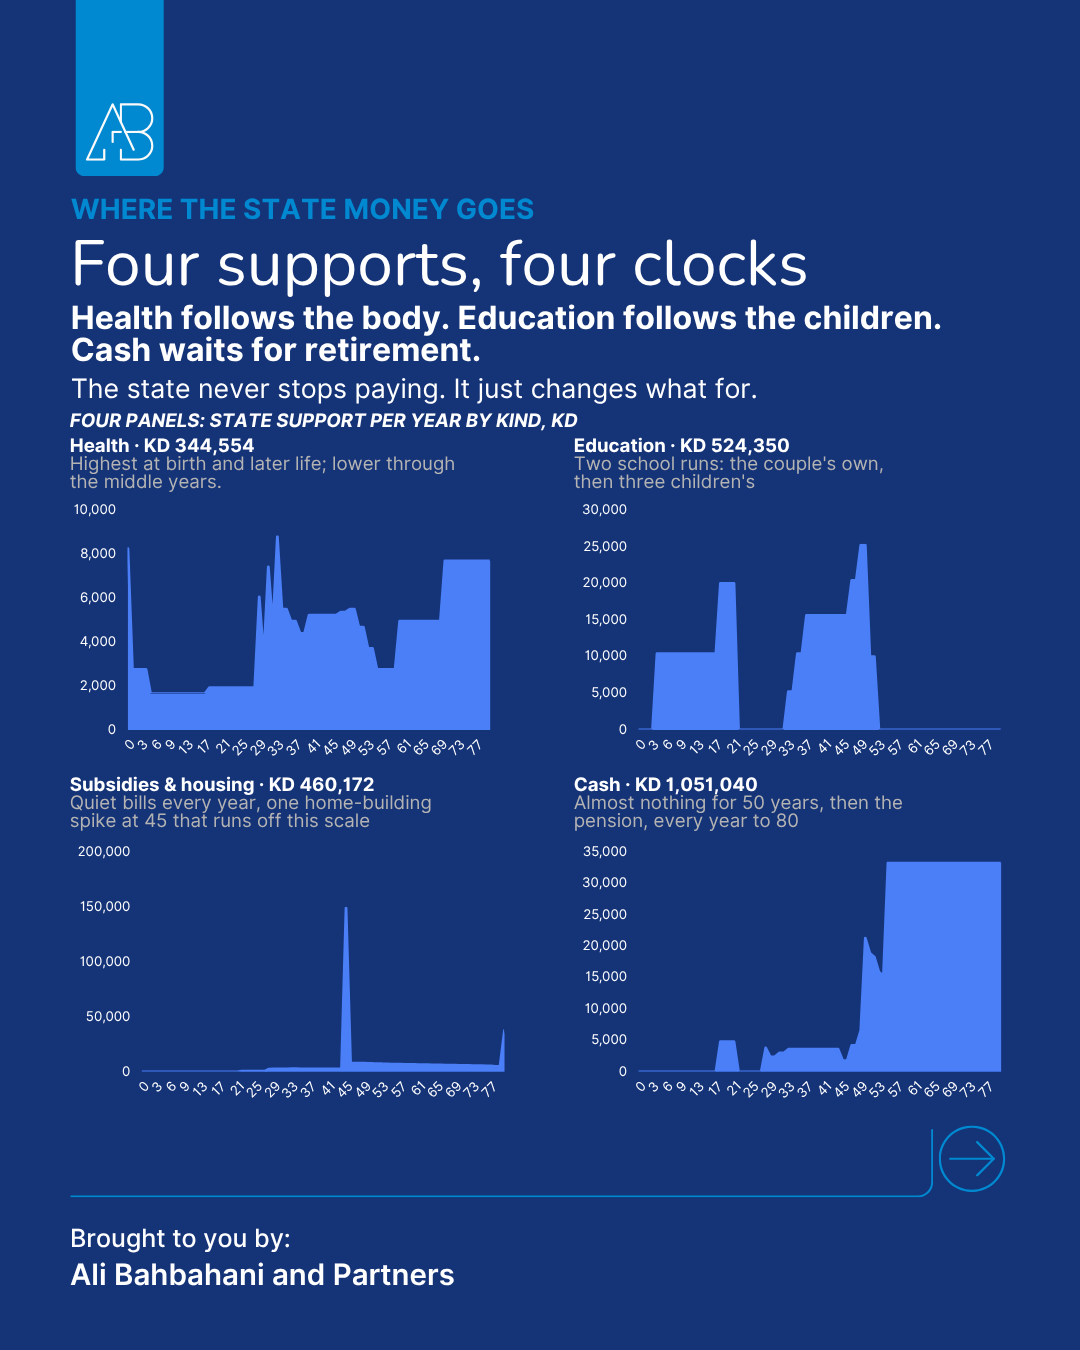
Gross public support totals KD 2.38 million, and it runs on four clocks. Health follows the body. Education follows the children, two school runs, the couple's own and then their three children's. Subsidies and housing tick quietly until the allocation at 45. Cash barely exists for five decades, then arrives every year as the pension.
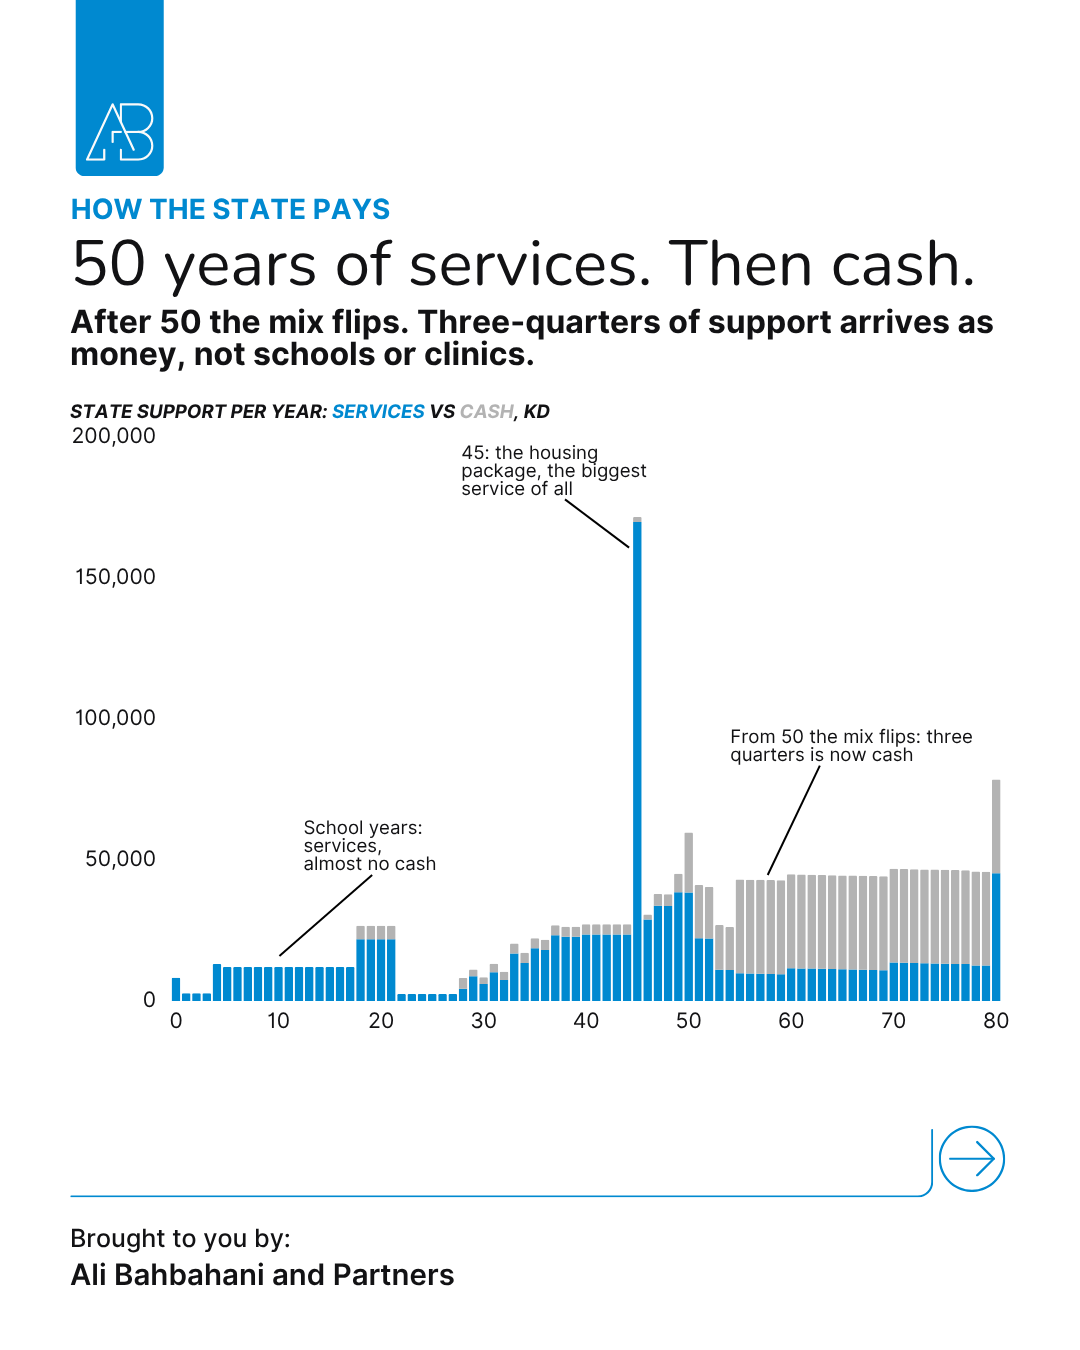
Split another way: for five decades the state pays mainly in services including schools, clinics, subsidized bills, the housing package. After 50 the mix inverts, and roughly three-quarters of annual support arrives as cash.
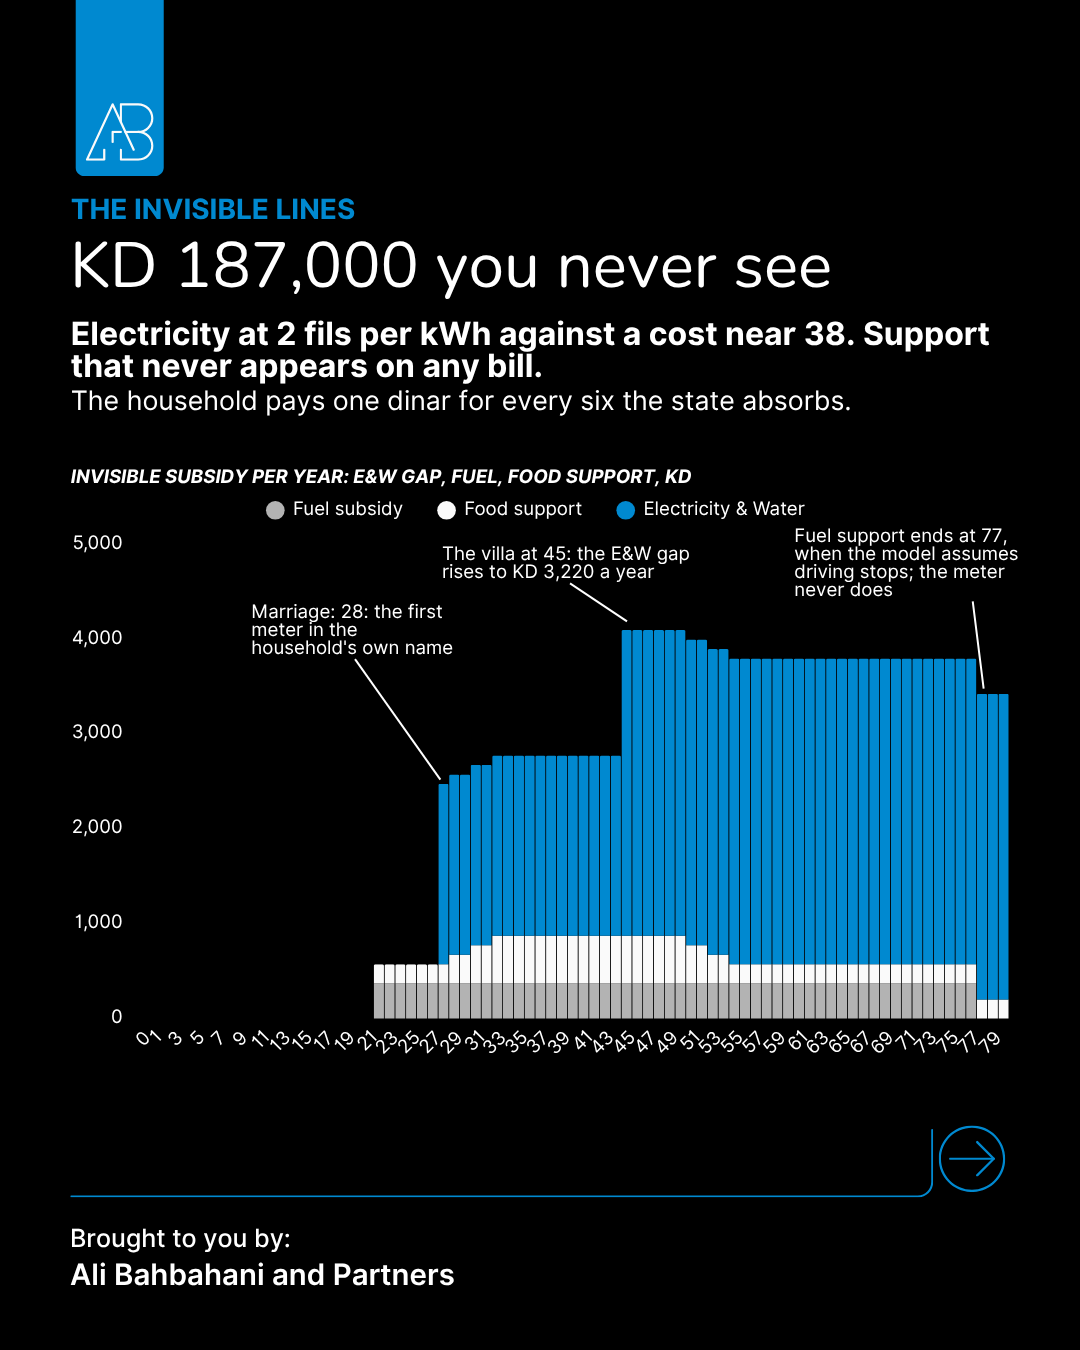
Then there is the support nobody sees. Electricity sold at 2 fils per kilowatt-hour against a cost near 38 fils; water, petrol and food below cost. None of it appears on a bill, yet it totals KD 187,452 across the life. The household pays in KD 29,149 for the same utilities, one dinar for every six the state absorbs.
The pension is the system
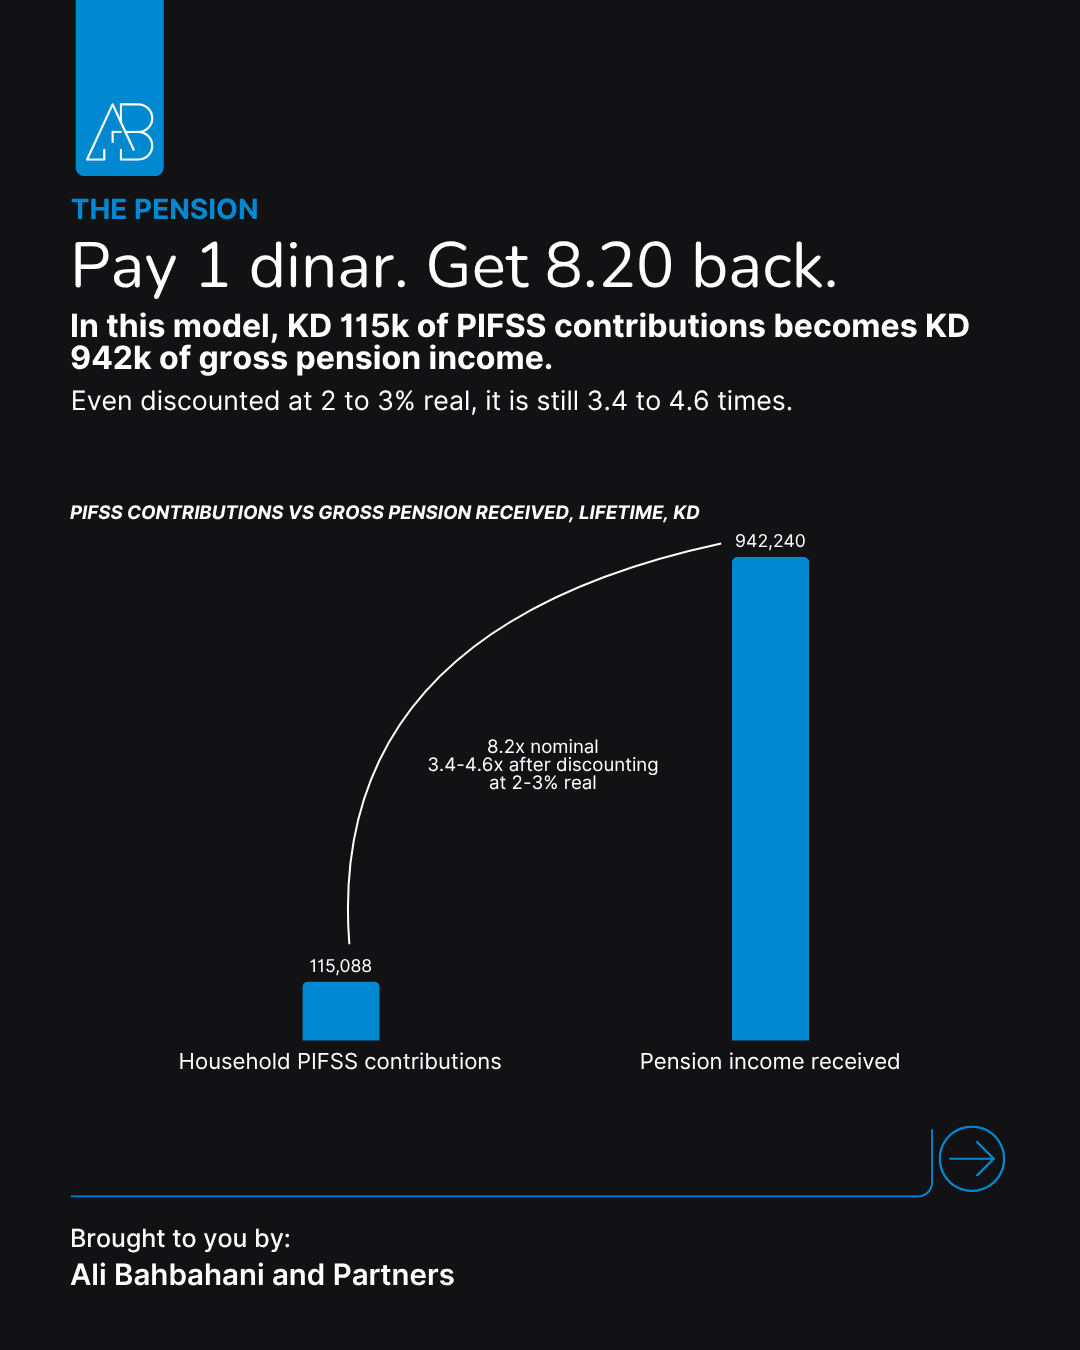
For this household, every dinar paid into PIFSS comes back as KD 8.20 of gross pension income. Two careers of contributions total KD 115,088; pension income from retirement to 80 totals KD 942,240. The net transfer, KD 827,152, is larger than any other support line in the model. Discounted at a 2–3% real rate, the multiple is still 3.4 to 4.6 times. This is the household's side of the ledger only, under the model's retirement ages, salary base and longevity assumptions, not an actuarial assessment of PIFSS. But it helps explain why, under the current rules, retiring is a financially attractive decision.
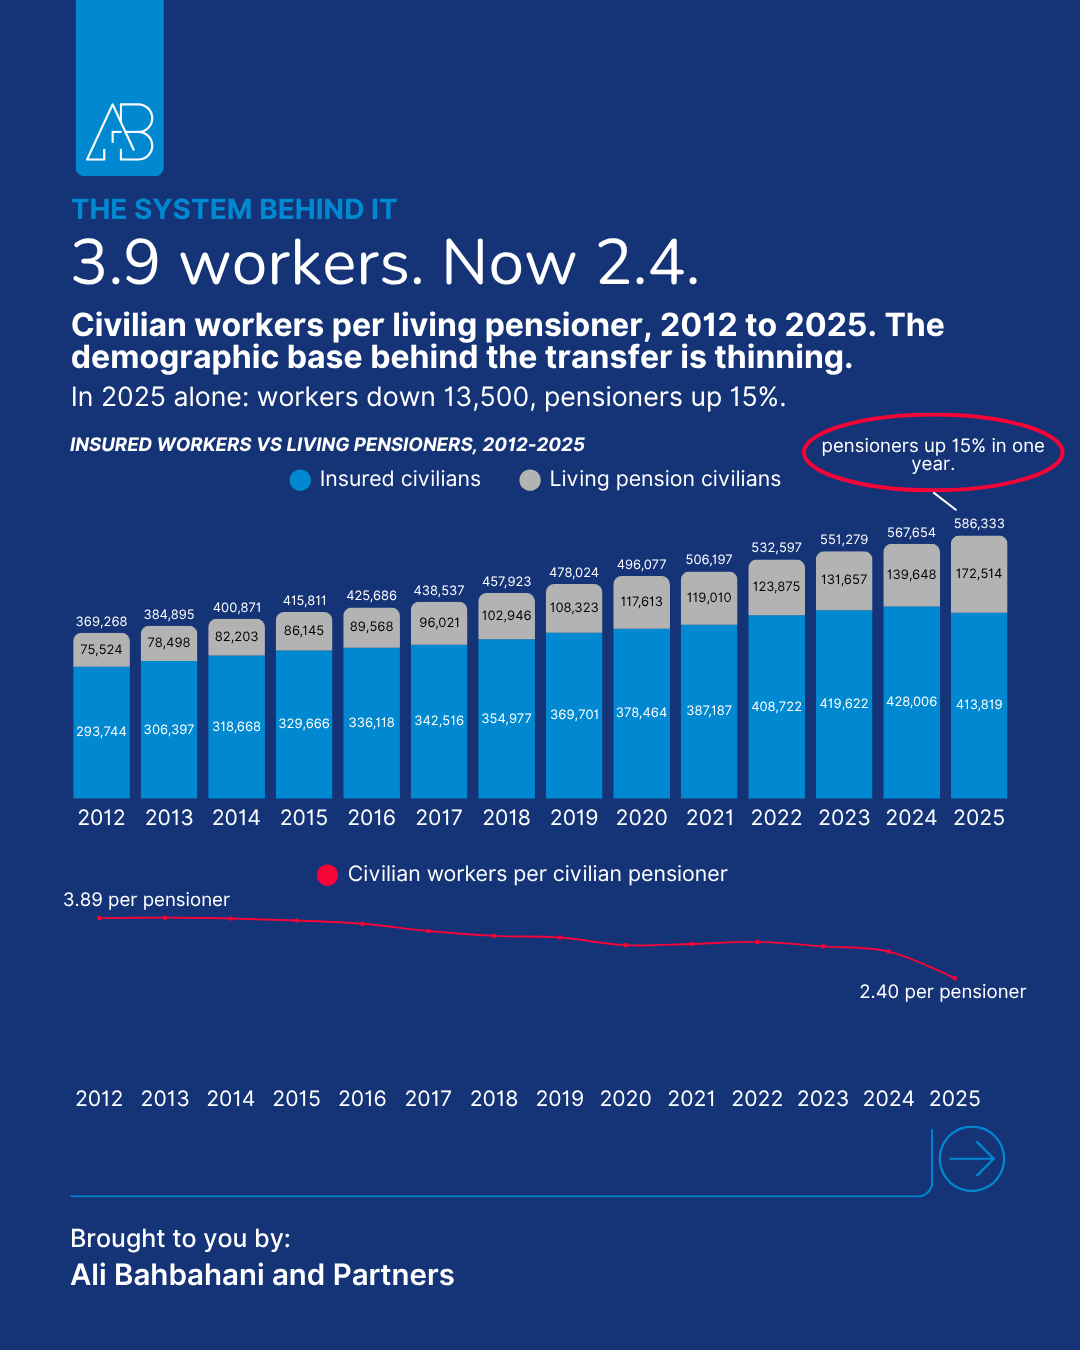
The household model raises a wider question about the demographic balance behind pension funding. In 2012, the civilian scheme had 3.9 actively insured workers per living pensioner. Today it has 2.4. In 2025 alone, insured civilians fell by 13,500 while pensioners rose 15%.
One caution before reading too much into that ratio: it is not a full measure of PIFSS sustainability. The institution holds substantial assets, earns investment income, and operates under contribution rates, retirement rules and state funding arrangements that all sit outside this model. The ratio remains, however, an important indicator of the demographic pressure behind the system, and its direction is unambiguous. We measure the civilian scheme by necessity, not choice: PIFSS discloses its 39,587 military pensioners but has never published military insured numbers, so a combined ratio cannot be computed.
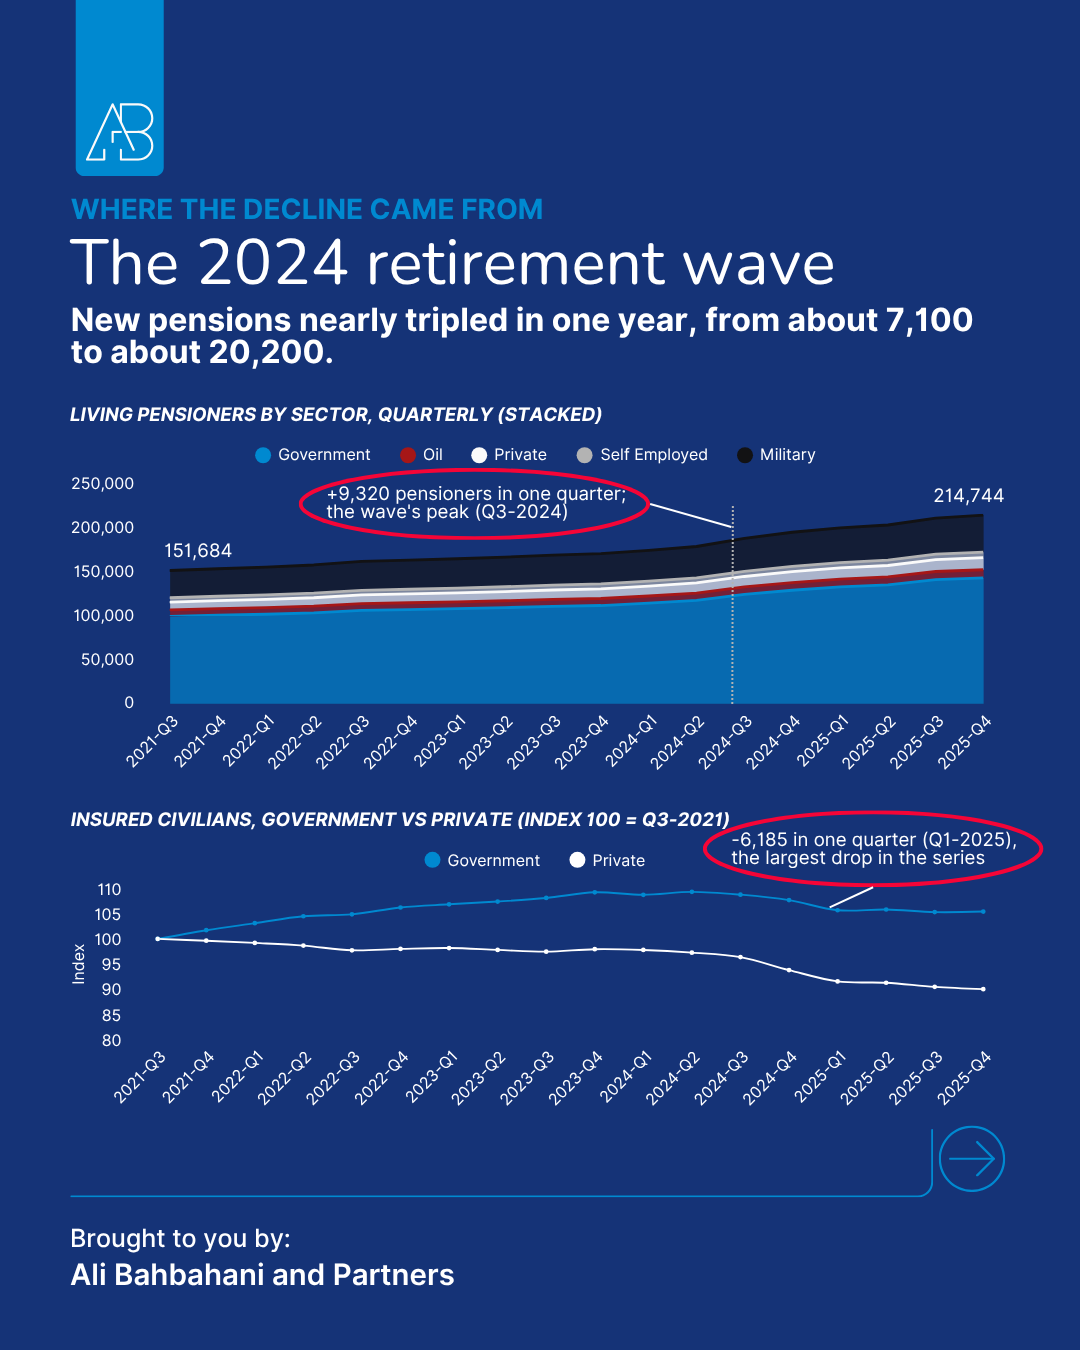
The quarterly data shows where the pressure came from. New civilian retirement pensions ran near 7,100 in 2023, then roughly 20,200 in 2024, a retirement wave, with the living-pensioner count rising by 9,320 in its single peak quarter, and roughly three-quarters of the increase coming from government. The insured base moved the other way: Q1-2025 recorded the largest quarterly drop in the series.
The ledger, closed
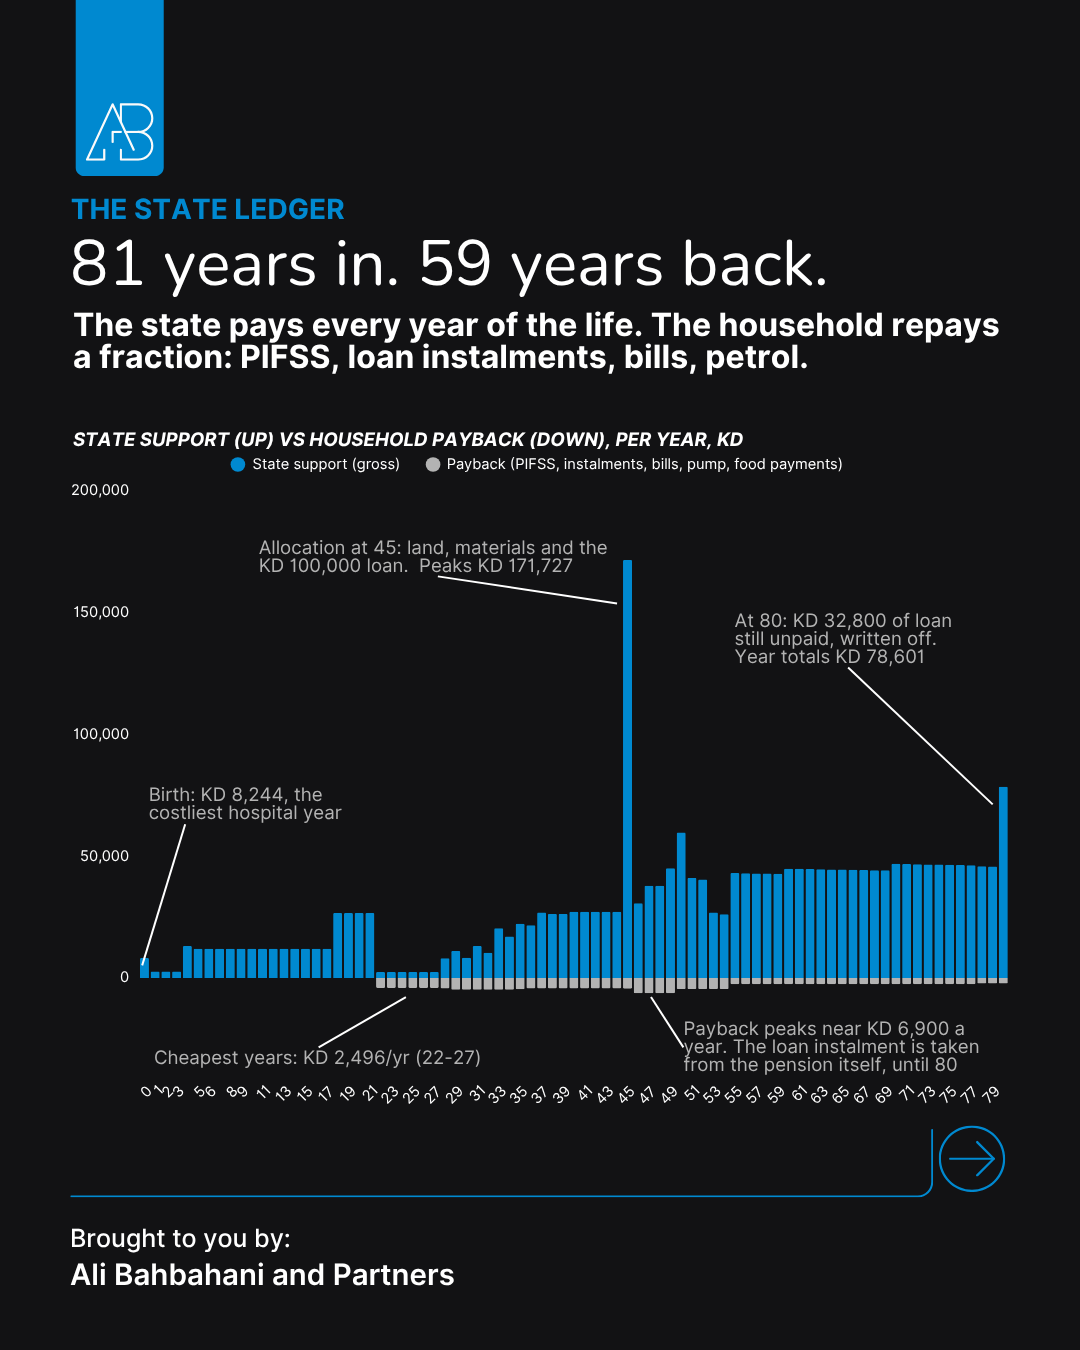
The state pays in all 81 years, from the costliest hospital year of the life, birth, at KD 8,244, to the loan write-off at 80. The household repays across 59 years: PIFSS, loan instalments, bills, petrol, with the loan instalment deducted from the pension itself.
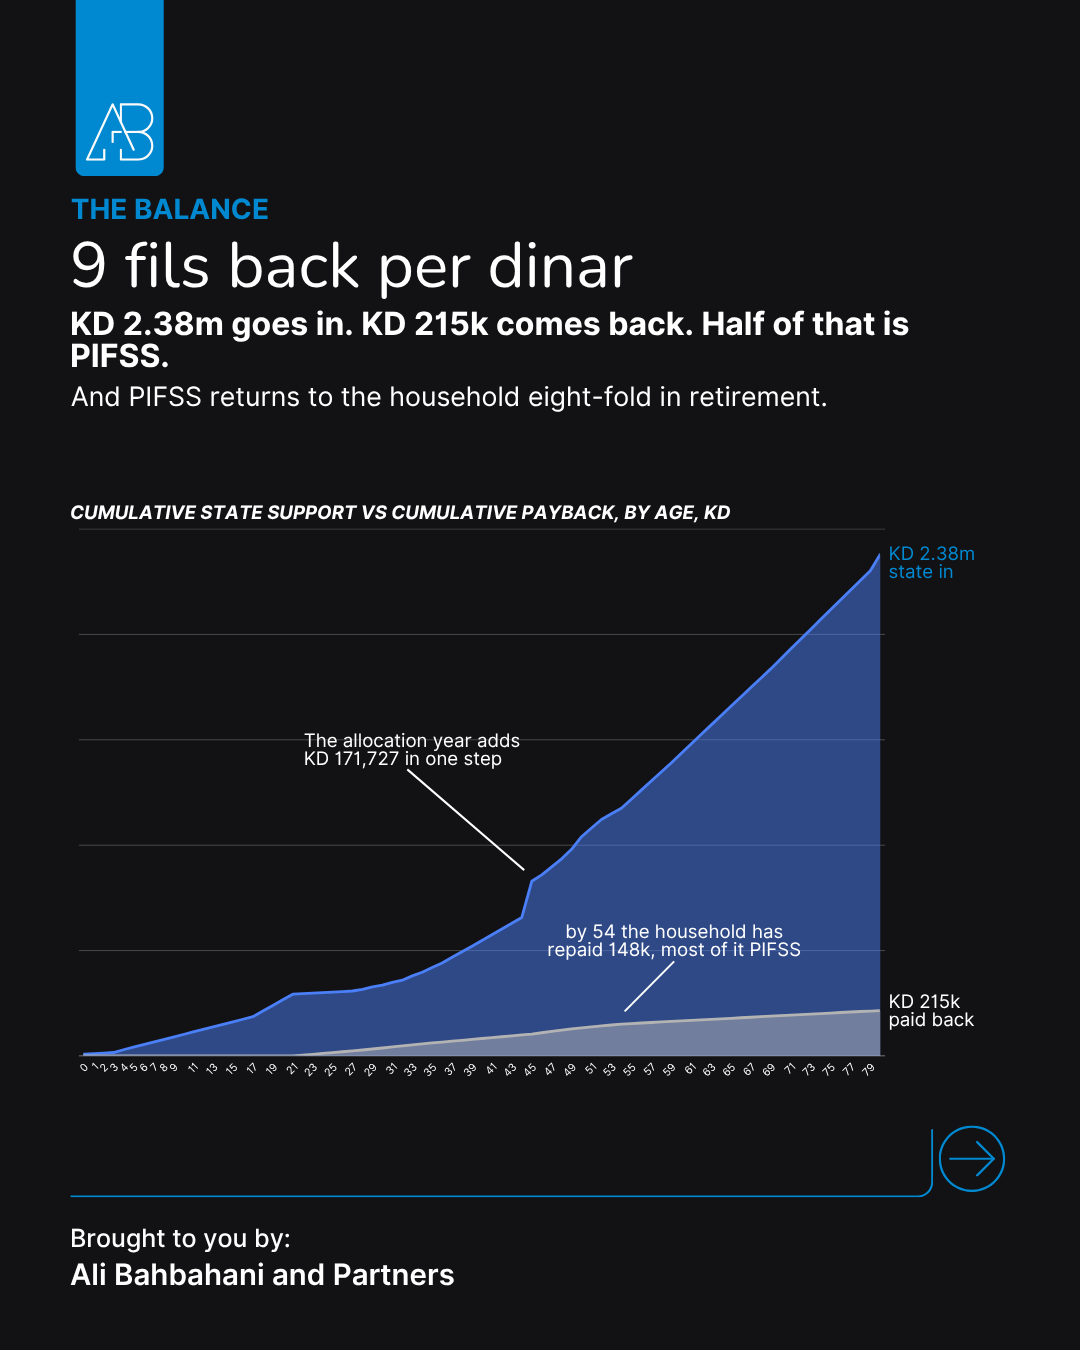
Cumulatively, payback never comes close: KD 2.38 million in, KD 215,437 back. And 53% of everything the household ever returns is PIFSS, money that comes back to it eight-fold in retirement.
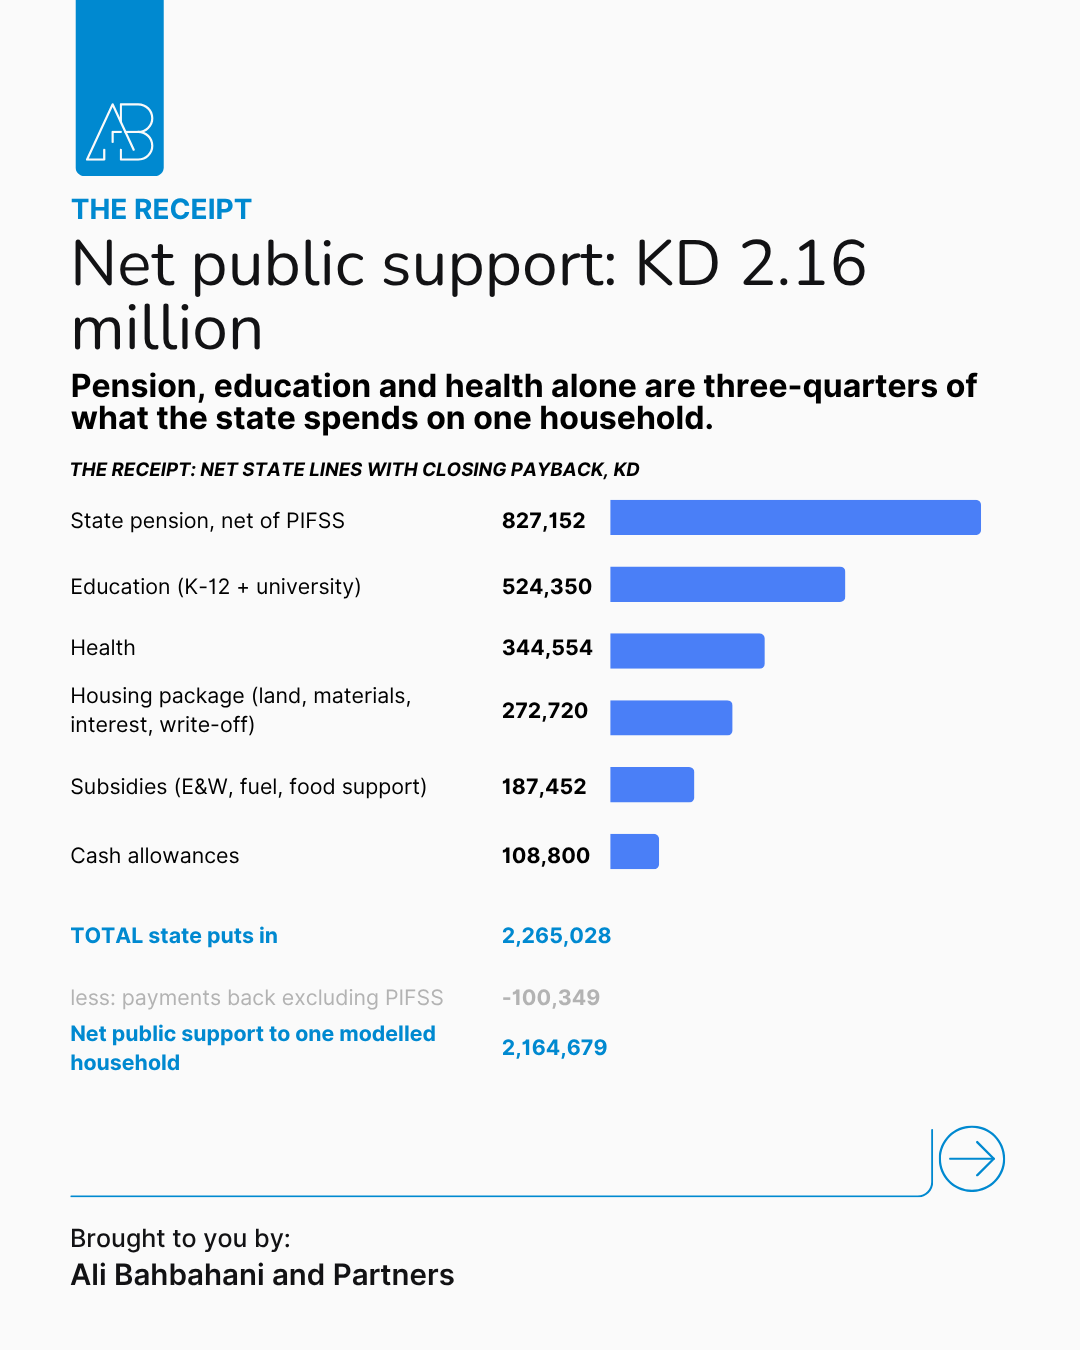
Net it all and the receipt reads KD 2.16 million of public support to one modelled household, with pension, education and health accounting for three-quarters of it.
What happens when a household goes private
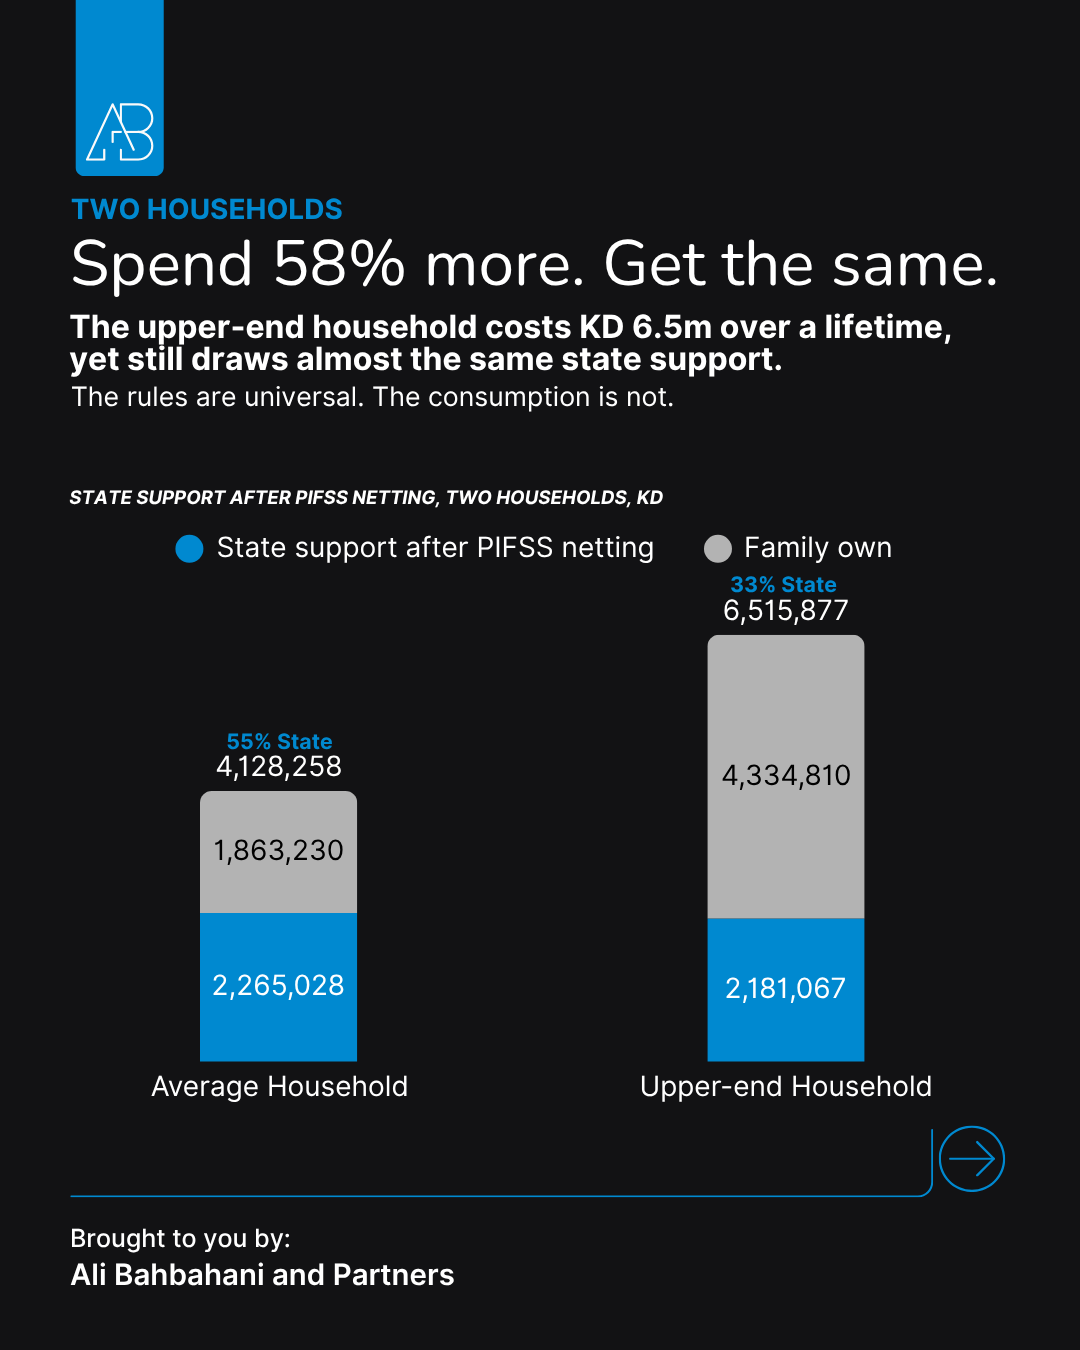
We ran the model twice. The second household earns more and spends more: private school, health insurance, premium cars, longer summers. Its lifetime cost rises 58% to KD 6.52 million. Its public support barely moves. KD 2.18 million against KD 2.27 million. The rules are universal; the consumption is not.
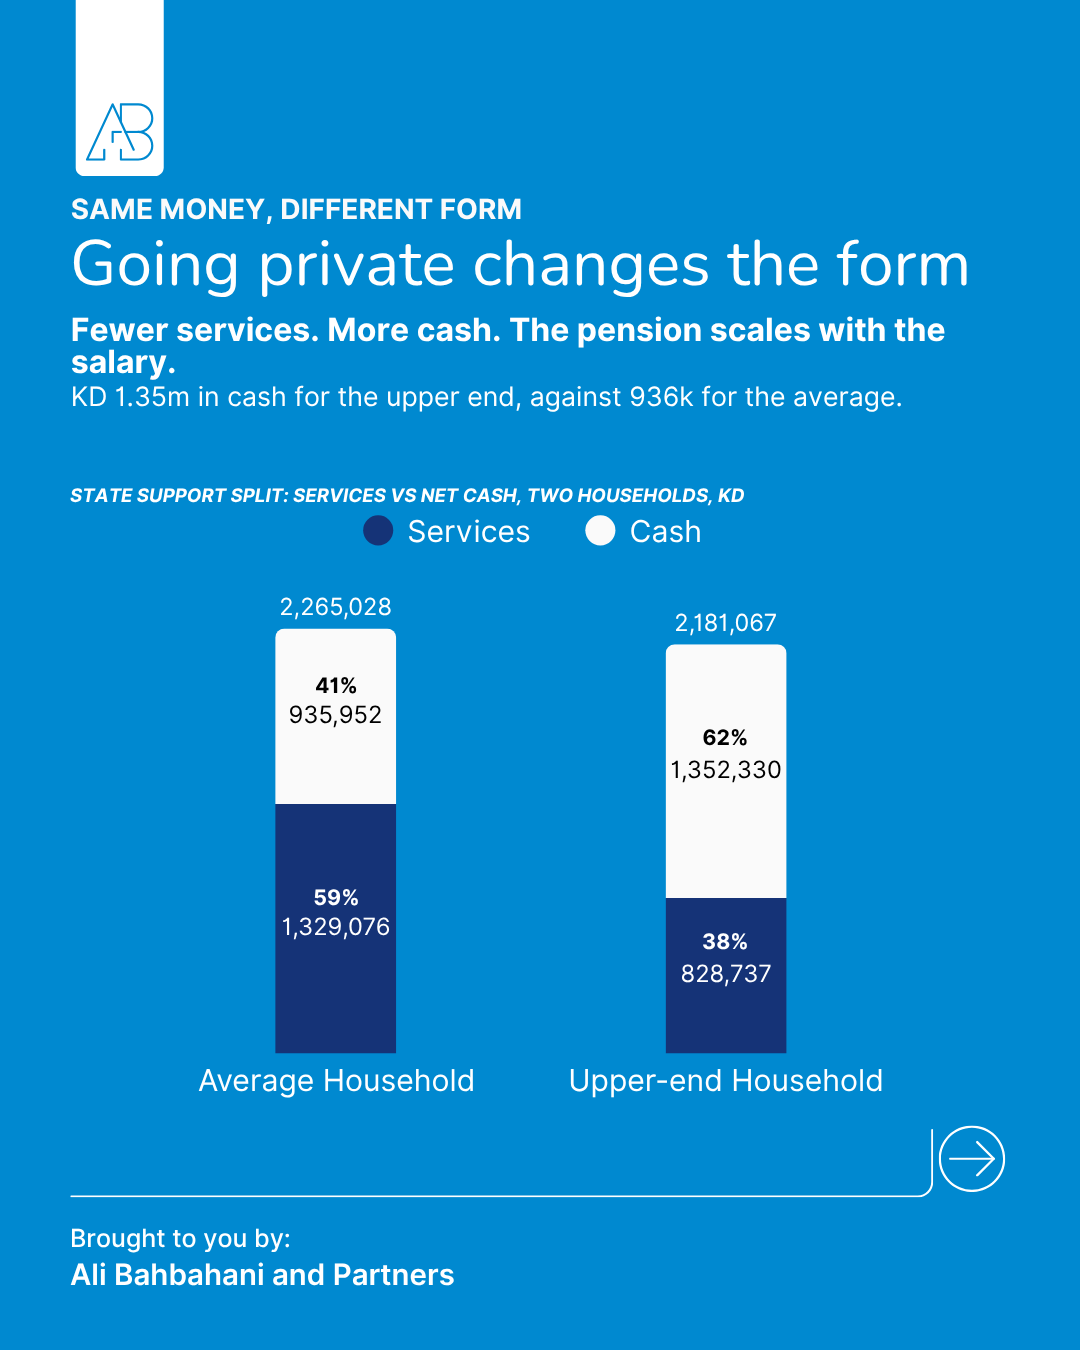
The composition, though, changes completely. The upper-end household draws 38% less in services and 44% more in cash, KD 1.35 million against KD 936,000, because pensions scale with salary. Going private changes the form of public support more than it changes the amount.
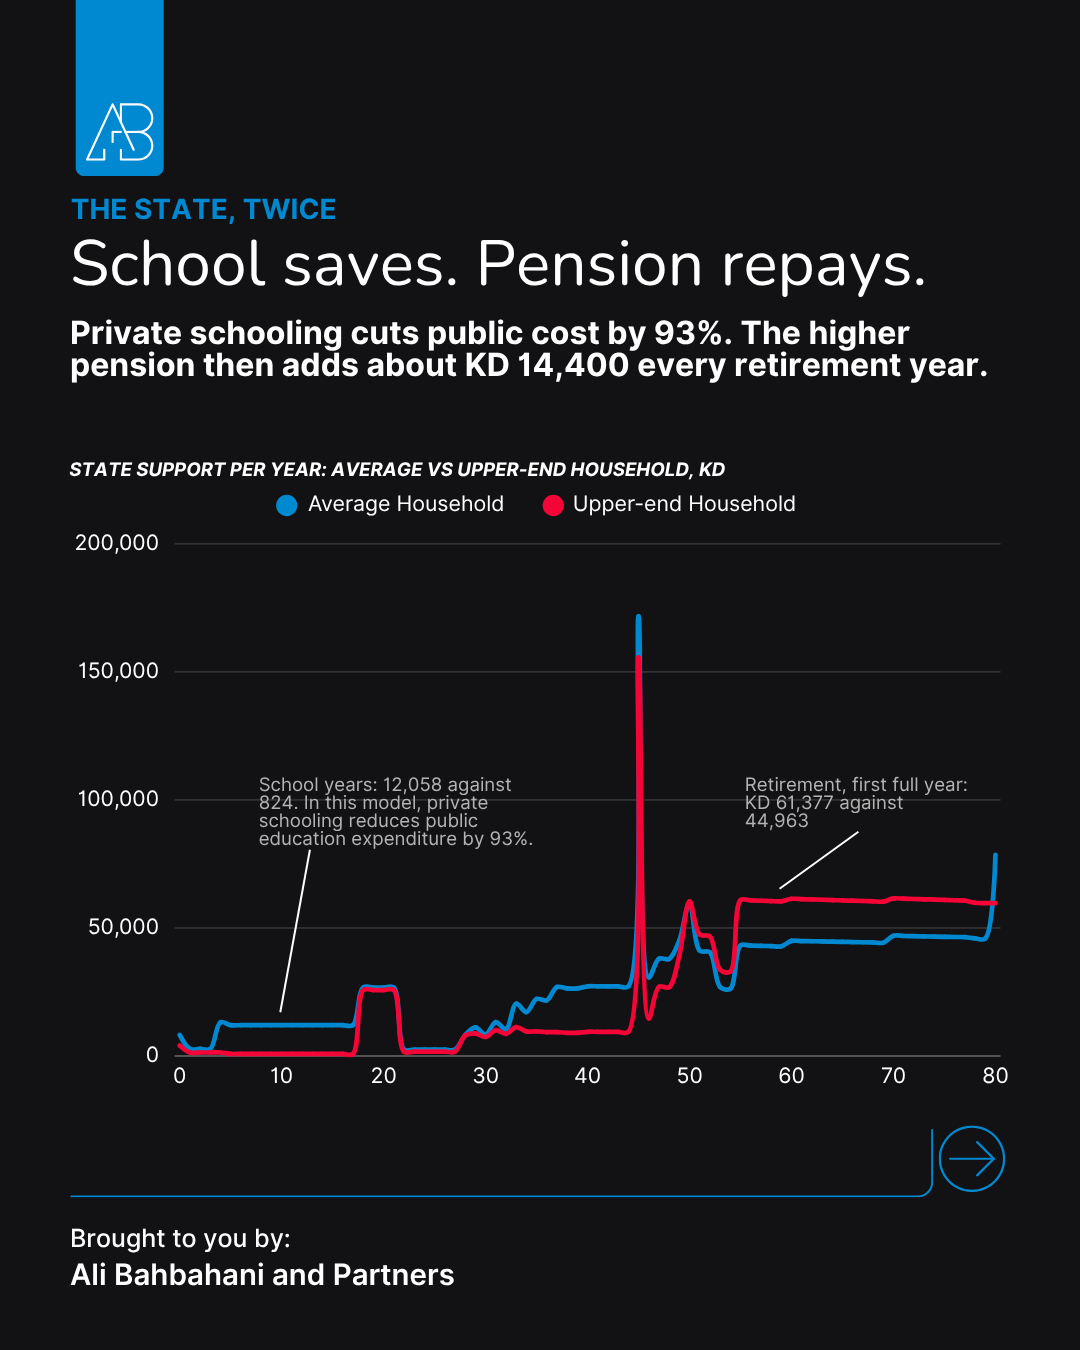
Year by year, the two lives diverge and reconverge. Private education cuts public spending on the household by 93% through the school years. After 50, the salary-linked pension hands the saving back: a gap averaging roughly KD 14,400 for every year of retirement.
The model, declared
The base case: a Kuwaiti couple at public-sector average wages, married at 28, three children, public school and public health, PAHW land and the KCB loan at 45 after the housing queue, retirement at 55 for men and 50 for women under PIFSS service rules, both spouses living to exactly 80, constant 2025 dinars throughout.
What it leaves out matters as much: inheritance, investment income, business ownership, major medical events, survivor benefits, study abroad, wage growth, and the entire income side of the household's ledger, which we are reserving for a companion study.
A life, priced. Now the conversation.
Kuwait's support system is not one benefit. It is a lifetime architecture: services in childhood, housing at mid-life, pension-linked cash in retirement. The services can be opted out of, and the upper-end household largely does. The cash cannot, and the cash is the part that scales with salary, concentrated after 50, resting on 2.4 workers per pensioner.
The question is no longer whether Kuwait supports its households generously. It clearly does. The question is whether the current balance between universal services, housing support and salary-linked retirement income is still the right one for the next generation. And within that balance, this model puts one line on the table before all others: should pensions keep scaling with salary, or is that the first line to redesign?
Ali Bahbahani & Partners builds data studies like this one for boards, investors and public institutions across Kuwait and the GCC, from feasibility studies and market sizing to investor-ready data presentations. If your organisation needs a question priced with this rigour, reach out to us.
Sources: PIFSS Quarterly and Annual Statistical Reports; CSB Household Income & Expenditure Survey; MEW cost disclosures 2023; state budget documents; PAHW and KCB published rules. Full assumptions and workbooks available on request.