Kuwait Property in 2025: Fewer Deals, Bigger Cheques
.webp)
Disclosure: I founded Dallal and directed the research behind the report discussed here. Treat this as the author's reading of his own work. Every figure below is taken from the report's reference tables.
Kuwait's Ministry of Justice registered 6,023 property deals in 2025, worth KD 4.55 billion. In 2021 it registered 10,773, worth KD 4.10 billion. The market did 44% fewer deals than four years ago and still moved 11% more money.
That one comparison is why Dallal split its first annual report into standalone sections. Three are out: The Numbers, The Sectors and The Map. Each is linked at the end of this post. What follows is the part I think matters most in each, with the charts that carry it.
The typical buyer never saw "record prices"
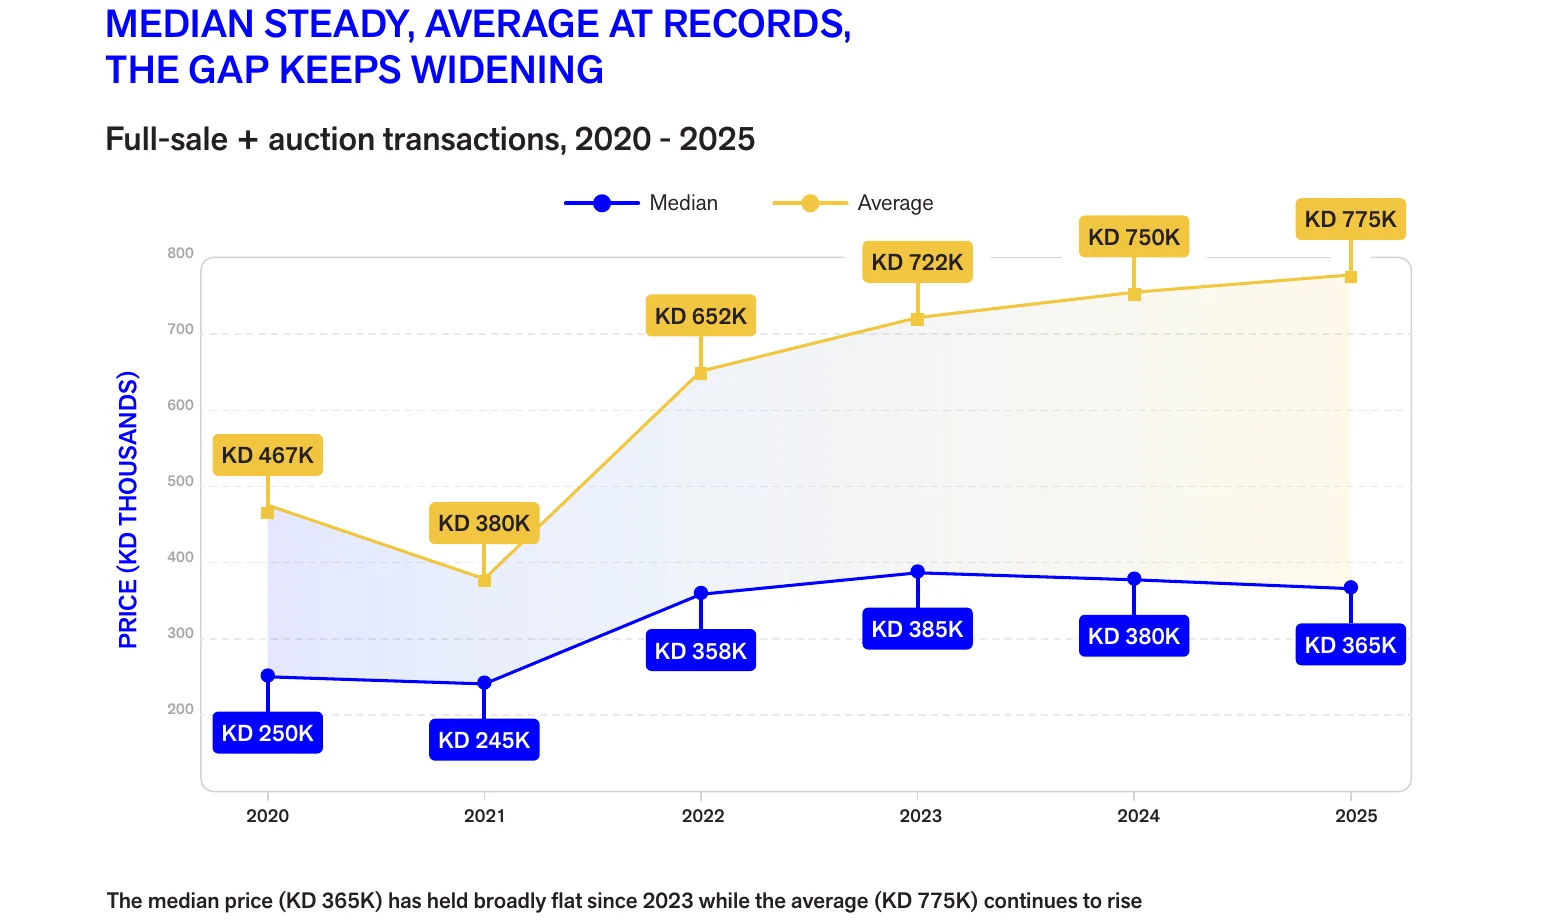
Line up every full sale and auction in 2025 and the deal in the middle sold for KD 365,000. The average was KD 775,000, more than twice as much. In 2021 the two sat much closer: a median of KD 245,000 against an average of KD 380,000.
The median peaked at KD 385,000 in 2023 and has slipped since. The average rose every year. When someone says Kuwaiti property hit record prices, ask which number they mean. A few large deals set the average, and they say little about what a family pays for a house.
How few? The ten biggest transactions of 2025 came to KD 291.7 million, 6.4% of the year's value. The largest, a commercial plot in Dajeej, sold for KD 43.2 million.
Homes lost their grip on the money
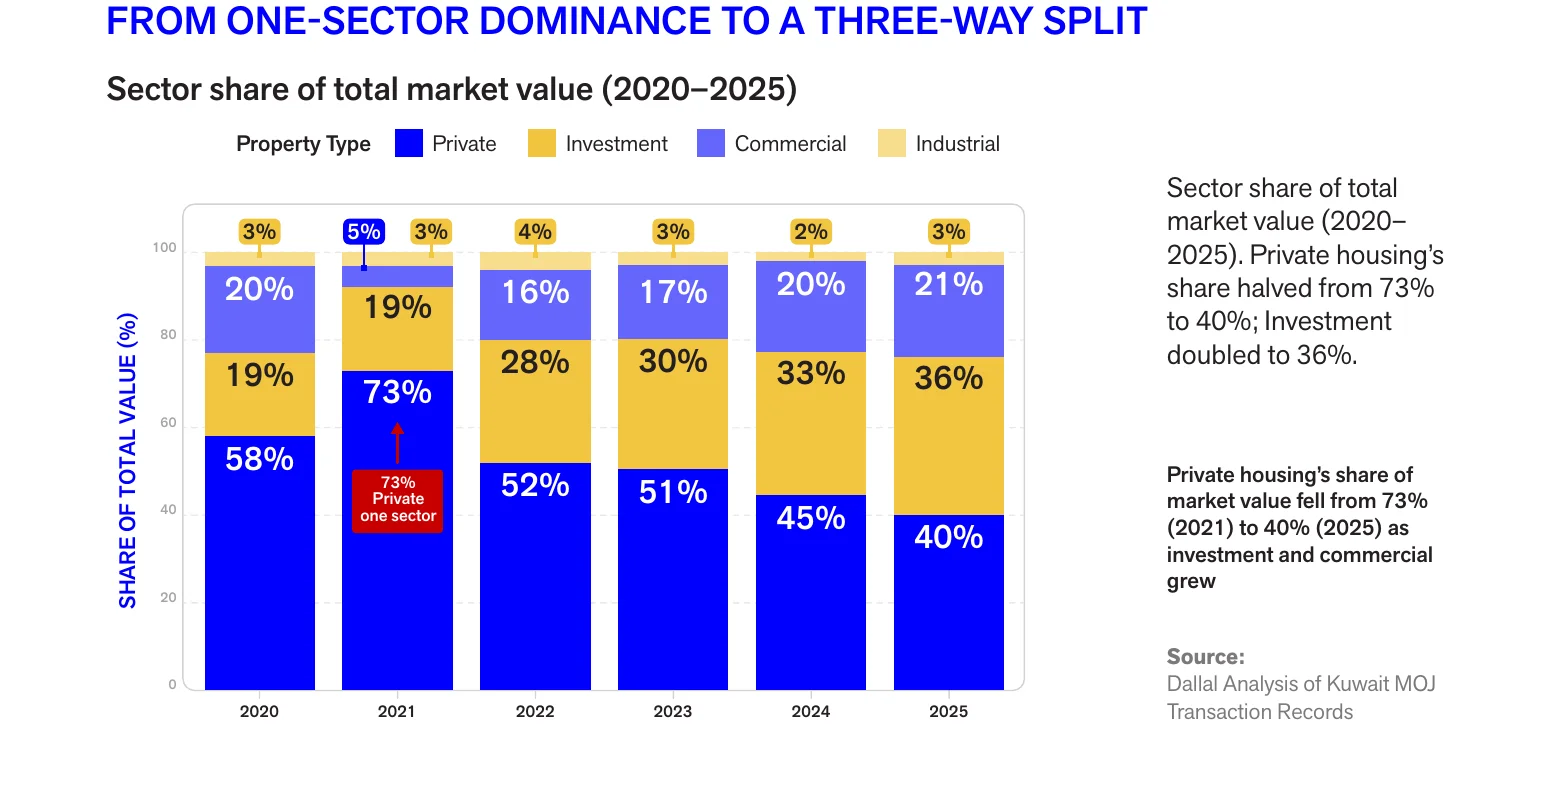
In 2021 private housing took 73.2% of all the money spent on property. In 2025 it took 40.2%. Investment property (apartment buildings, units and the land zoned for them) rose from 19.2% to 36.0%. Commercial went from 4.9% to 20.8%.
Housing still does most of the deals: 4,219 of them, or 70% of the count. It just stopped being the whole market by value. Investment property traded KD 1.64 billion in 2025, against KD 0.43 billion in 2020.
Section II adds two details I did not expect. The first is how small the apartment ticket is. In the investment sector, 687 units changed hands at a median of KD 86,000, and 93% sold for under KD 150,000.
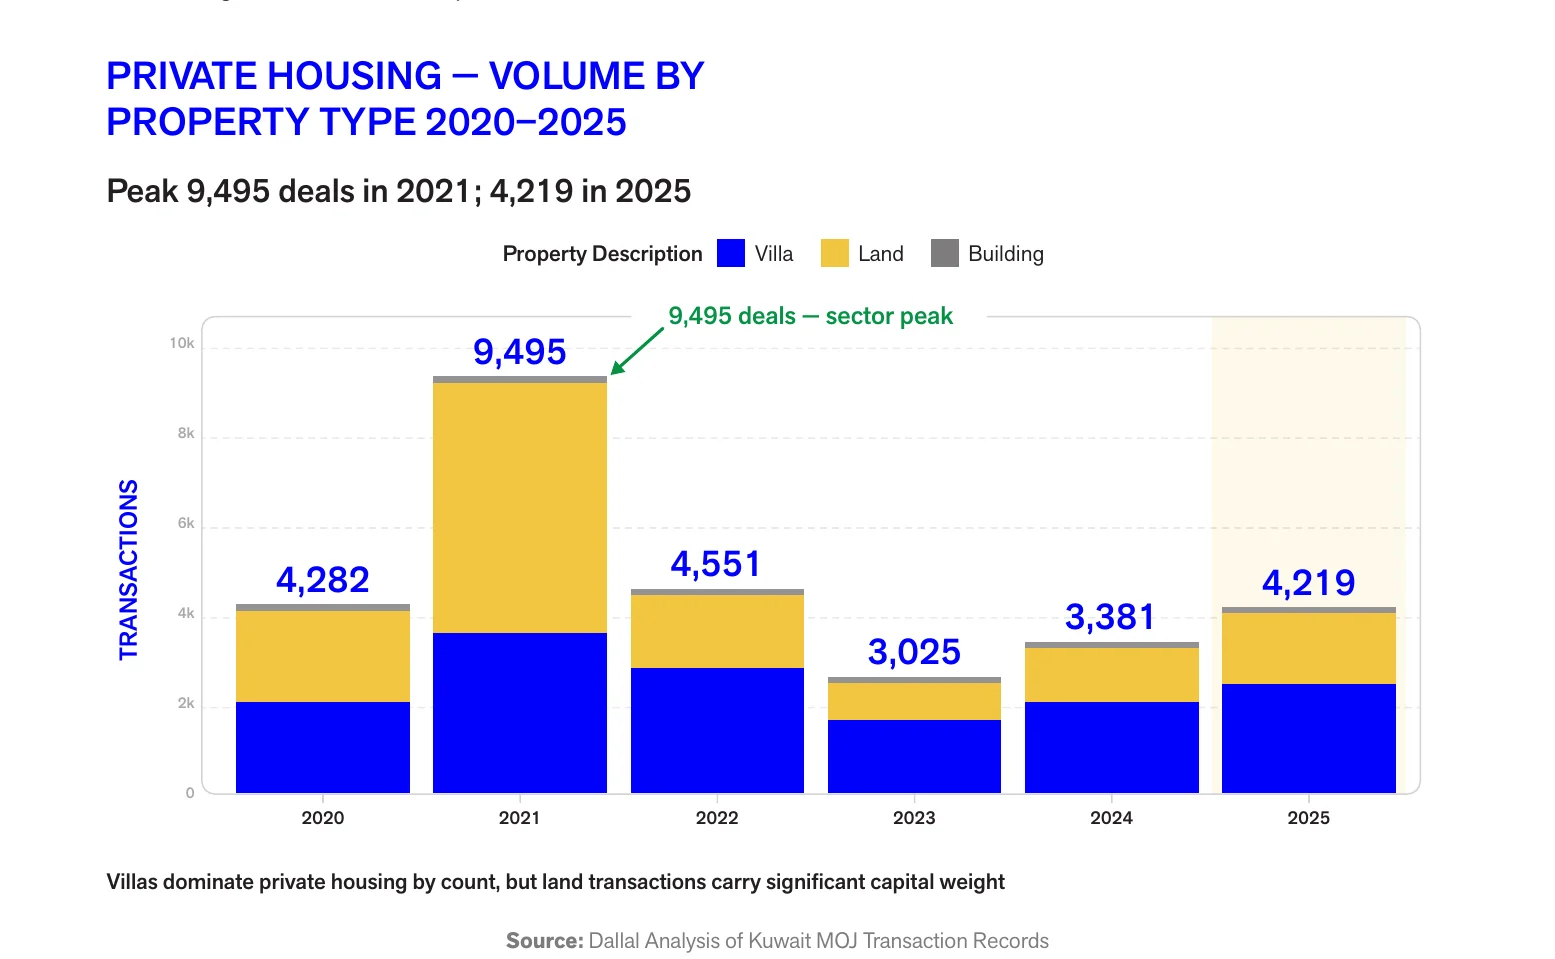
The second is how much of the 2021 boom was land. Of 9,495 private housing deals that year, 5,748 were vacant plots. By 2025, villas made up 61% of housing deals.
Where the deals happen is not where the money goes
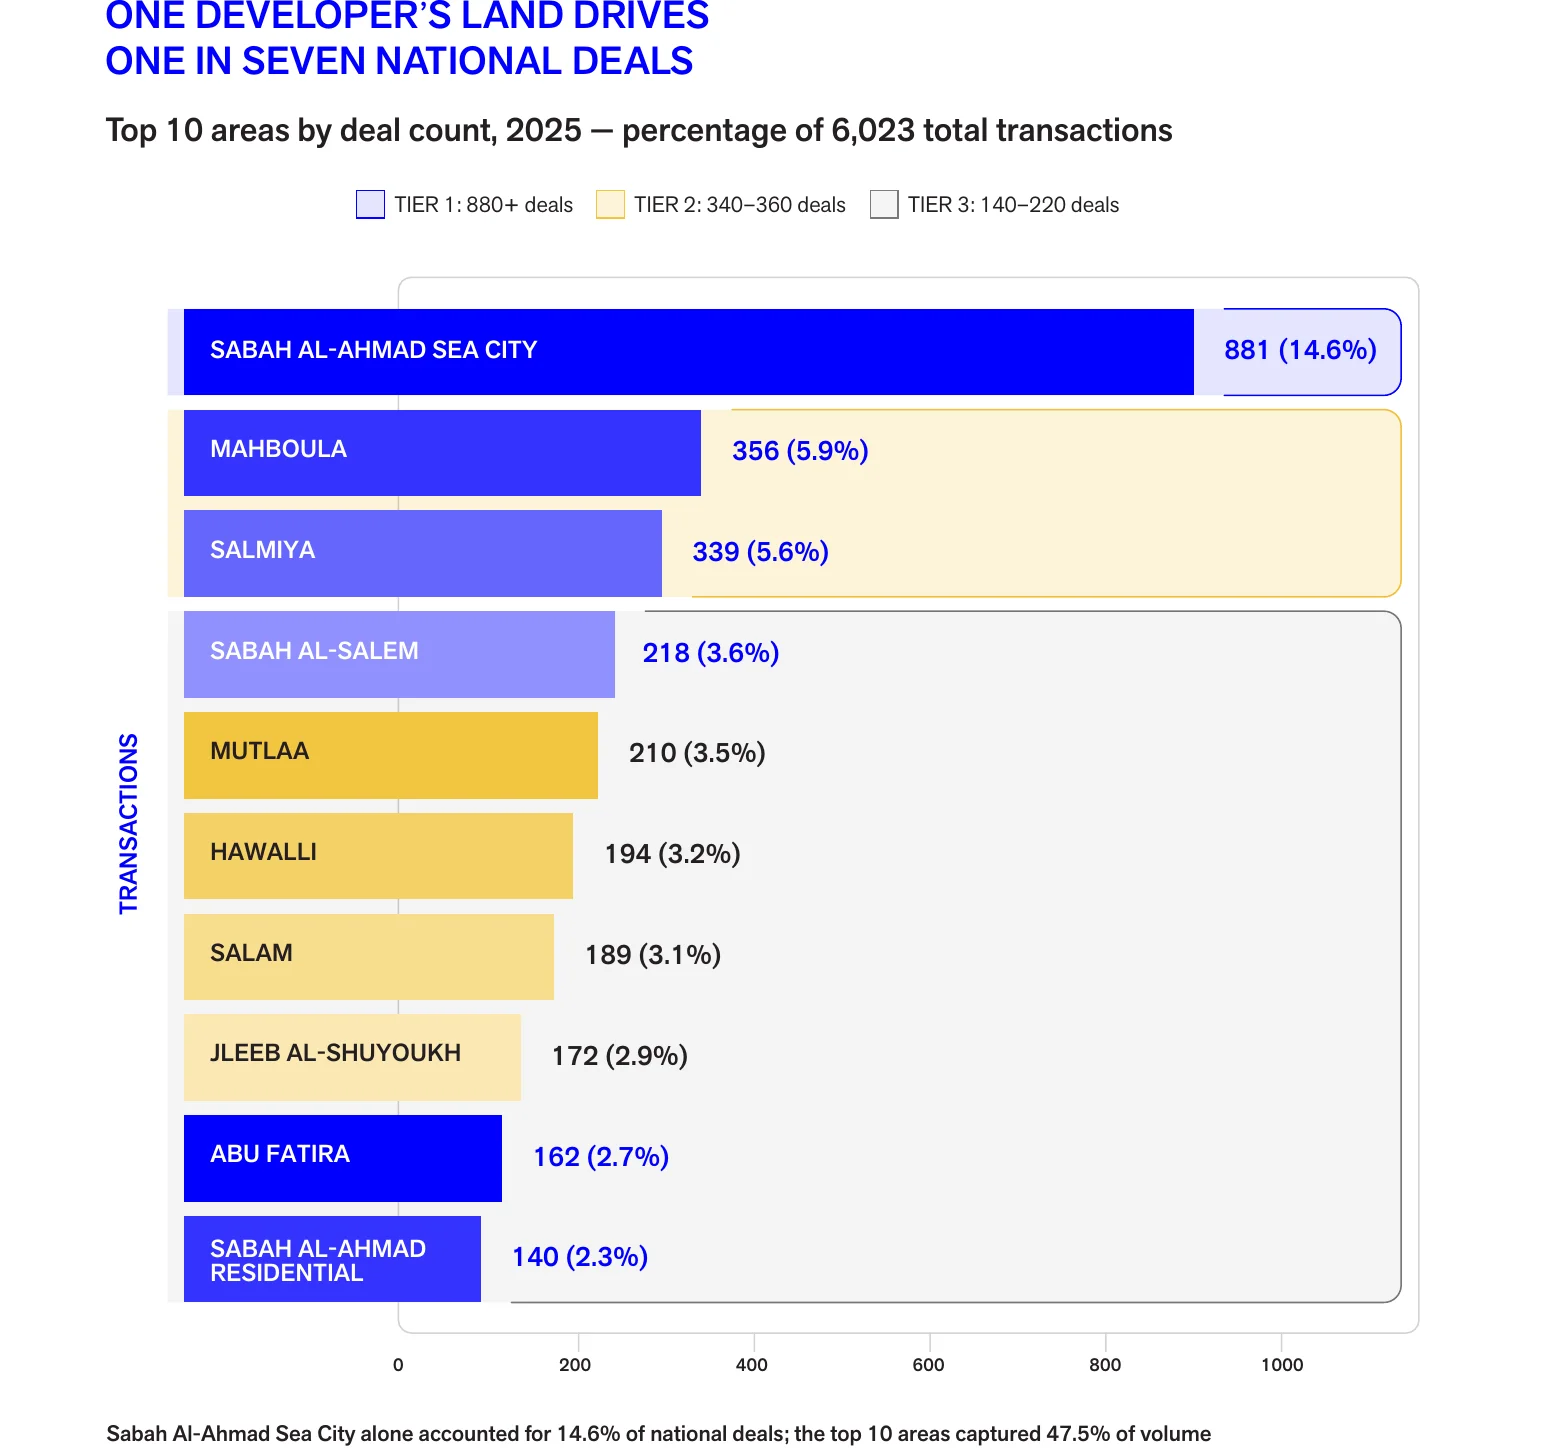
Sabah Al-Ahmad Sea City recorded 881 deals, 14.6% of the national total, as its developer released plots in batches. Salmiya ranked third by count with 339 deals and second by value at KD 546 million. Its average deal was KD 1.61 million, because apartment buildings trade there. Sharq recorded 32 deals, averaging KD 5.3 million each.
A national deal count that leans this hard on one project can jump or drop with a release schedule. Read year-on-year volume with that in mind.
The map: six markets, sorted mostly by distance
Section III takes private housing alone (3,882 deals worth KD 1.72 billion across 97 areas) and sorts it into six rings measured from the city centre.
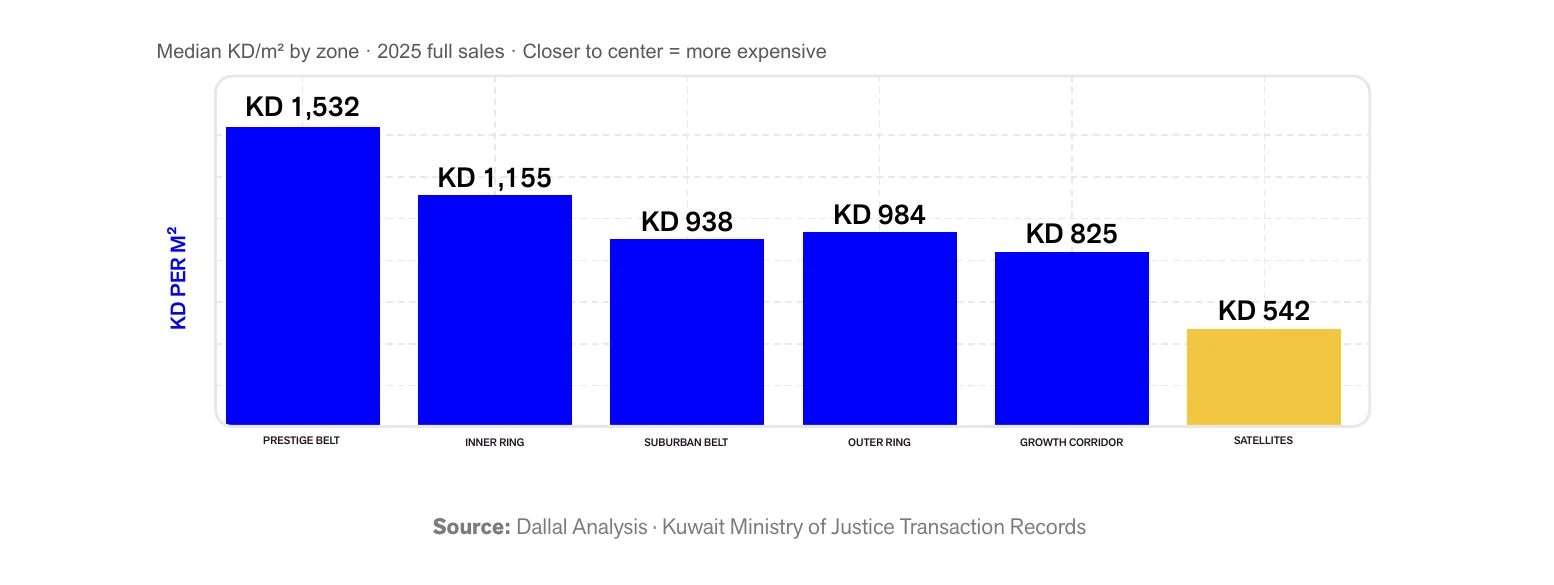
Land in the Prestige Belt, within 6 km, sold at a median of KD 1,532 per square metre. In the Satellites, 40 km and beyond, it sold at KD 542. A typical home cost KD 800,000 in the first and KD 275,000 in the second.
Look at the middle of that chart. The Outer Ring (18–25 km) prices above the Suburban Belt (8–18 km), at KD 984 against KD 938. Distance sets most of the gradient; what sits on the land sets the rest. The Suburban Belt holds Jleeb Al-Shuyoukh at KD 570 and Mubarakiya at KD 1,400 in the same zone.
The Outer Ring is also where the correction bit hardest. Its median reached KD 1,201 per square metre in 2023 and stood at KD 984 in 2025. Every zone still sits above its 2020 level. Not every area does: Jleeb Al-Shuyoukh is 26% below where it was five years ago.
Volume runs the other way. The Prestige Belt recorded 151 deals. The Satellites recorded 1,404, and Sea City alone accounted for 763 of them.
The one I would watch is Mutlaa. Resale deals there went from 105 in 2024 to 210 in 2025, as the first phases of a city planned for 55,286 plots reached owners able to sell.
Why the correction did not turn into a crash
This part is my reading. The report makes a softer version of it.
Most Kuwaiti homes are not bought with commercial bank mortgages. At the end of 2024, banks held KD 10.31 billion of real estate credit, and personal housing loans made up KD 245 million of it. Citizens borrow from the Kuwait Credit Bank instead, on subsidised terms that do not move with the Central Bank's rate.
So when the Central Bank raised its discount rate from 1.50% to 4.25% between 2022 and 2023, families holding homes saw no jump in their payments. Nobody was pushed to sell. Prices in the outer zones fell, owners waited, and deal counts dropped. The rate rise landed on investors and developers, who do borrow from banks.
Section III calls this an equity-funded floor. I would call it a debt-funded floor: the debt is cheap, and its cost does not change when the Central Bank moves. The distinction matters the day Credit Bank terms change.
One caution before you use the numbers
"Home deals" include a lot of empty land. Section II counts 36% of 2025 private housing deals as vacant plots, concentrated in Mutlaa and Salam. Any measure that divides deals by the number of houses in an area, turnover for instance, will run high in exactly those places.
Salam is the clearest case. It went from 41 deals to 189 in one year while its median price per square metre fell. That looks like a batch of plots reaching resale for the first time. It is a thin basis for calling Salam a hot neighbourhood.
Read the full sections
- Section I: The Numbers (market size, prices, concentration, rates and lending)
- Section II: The Sectors (private housing, investment, apartments, commercial, industrial, Musha'a and auctions)
- Section III: The Map (the six-zone private housing map, area by area)
Section IV (the macro context) and Section V (supply and policy) are still to come. More from Dallal at dallal.com.kw.
Sources: Kuwait Ministry of Justice transaction records (2020–2025), Central Bank of Kuwait and Kuwait Credit Bank data, as analysed in the Dallal Annual Real Estate Report 2025.