What Kuwait Sells: 65 Local Funds and 174 Offshore Approvals

.webp)
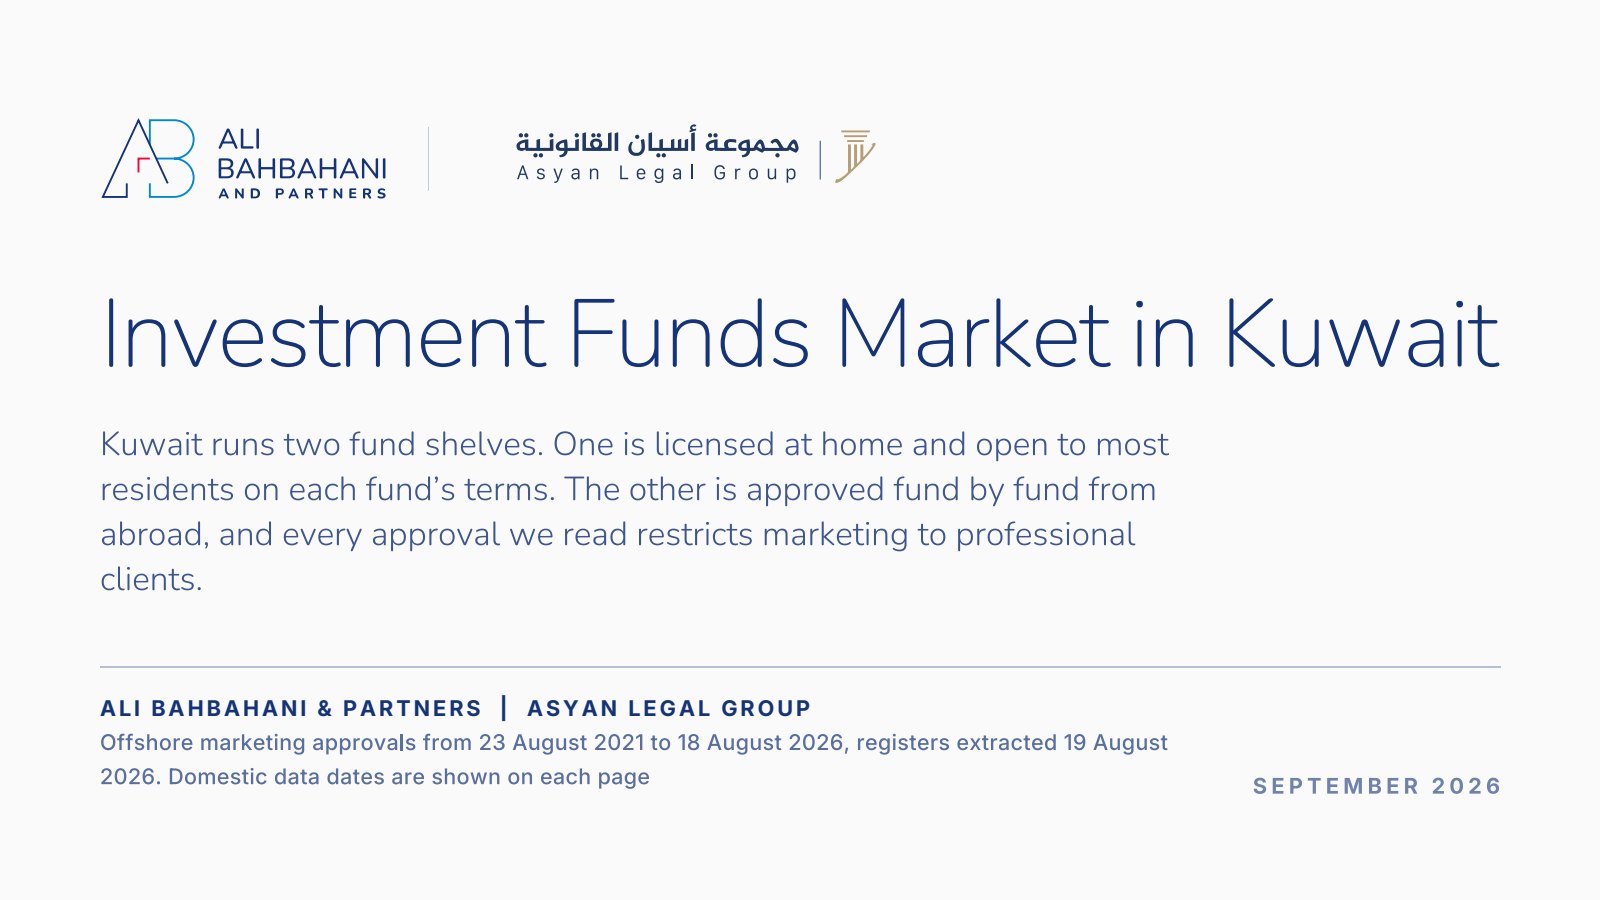
Kuwait runs two fund shelves, and most people only ever see one of them. The first is licensed at home and open to residents on each fund’s own terms. The second is approved from abroad, one fund at a time, and every approval we read restricts marketing inside Kuwait to professional clients. We read both registers end to end and rebuilt the market from them.
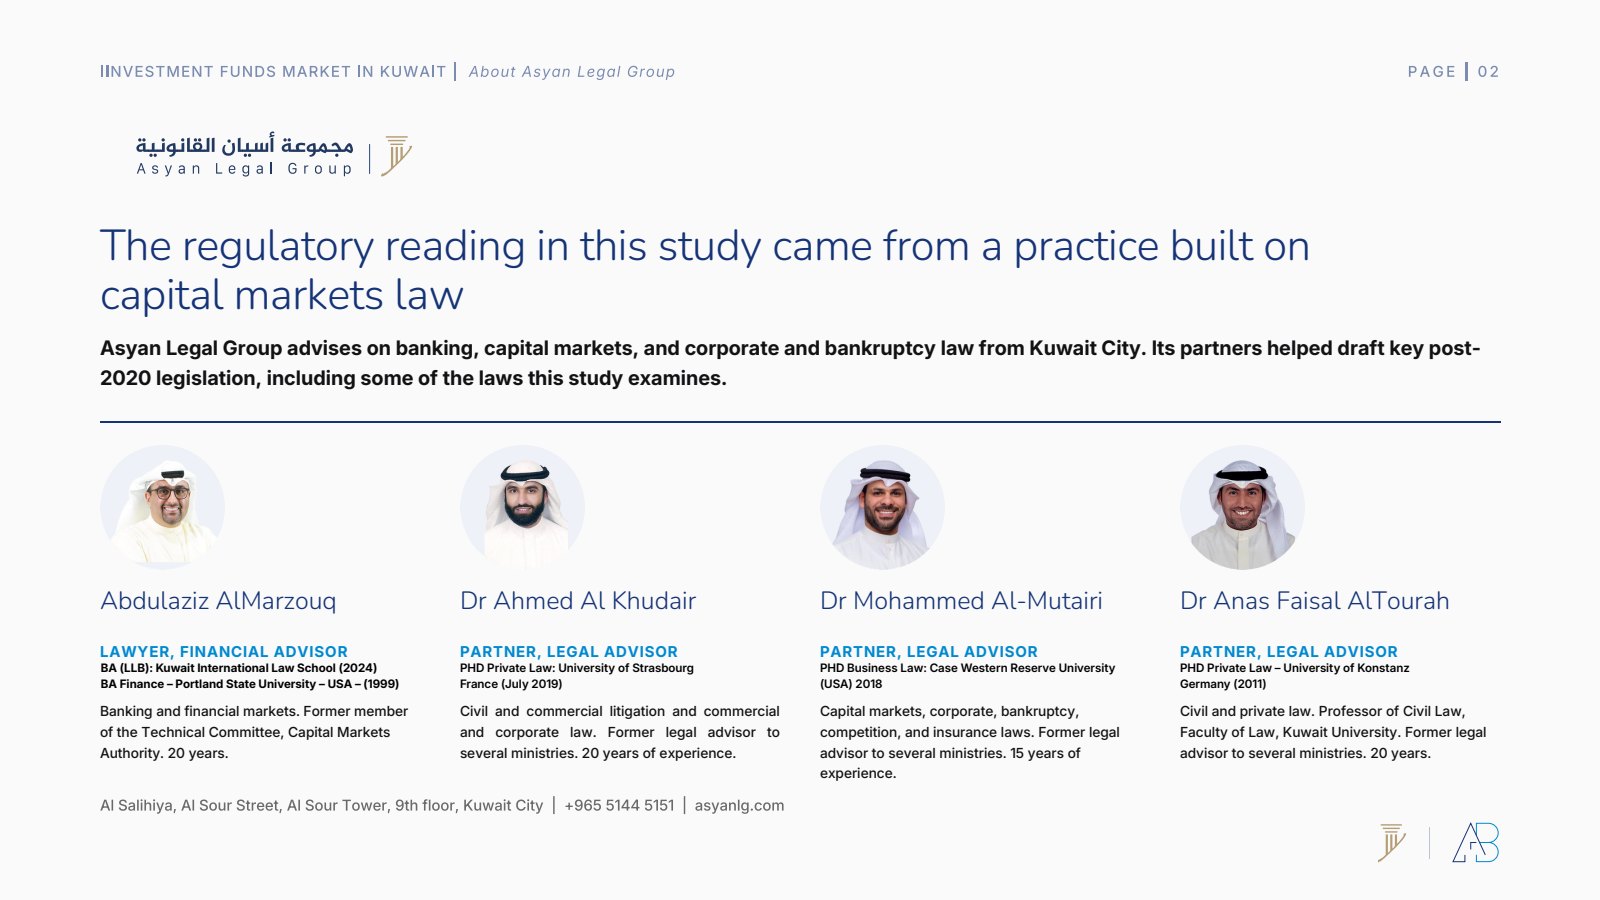
This started with a dataset and a question. Abdulaziz AlMarzouq at Asyan Legal Group had assembled the CMA record of every fund approved for marketing in Kuwait and brought it to us asking what it actually amounted to. How big is this market, who is in it, and what is being sold. Nobody had put that count together in public. So we took his file, set the annual reports, the statistical bulletin, the resolutions register and the individual fund articles beside it, and rebuilt the market from the paperwork up. Asyan’s partners helped draft some of the post-2020 legislation it runs on, which is where the regulatory reading in the study comes from.
Offshore approvals cover 23 August 2021 to 18 August 2026, registers extracted 19 August 2026 from the Capital Markets Authority. Local data dates differ and are shown on each page. What follows is the whole count, including the places where the record contradicts itself.
Start with what the words mean
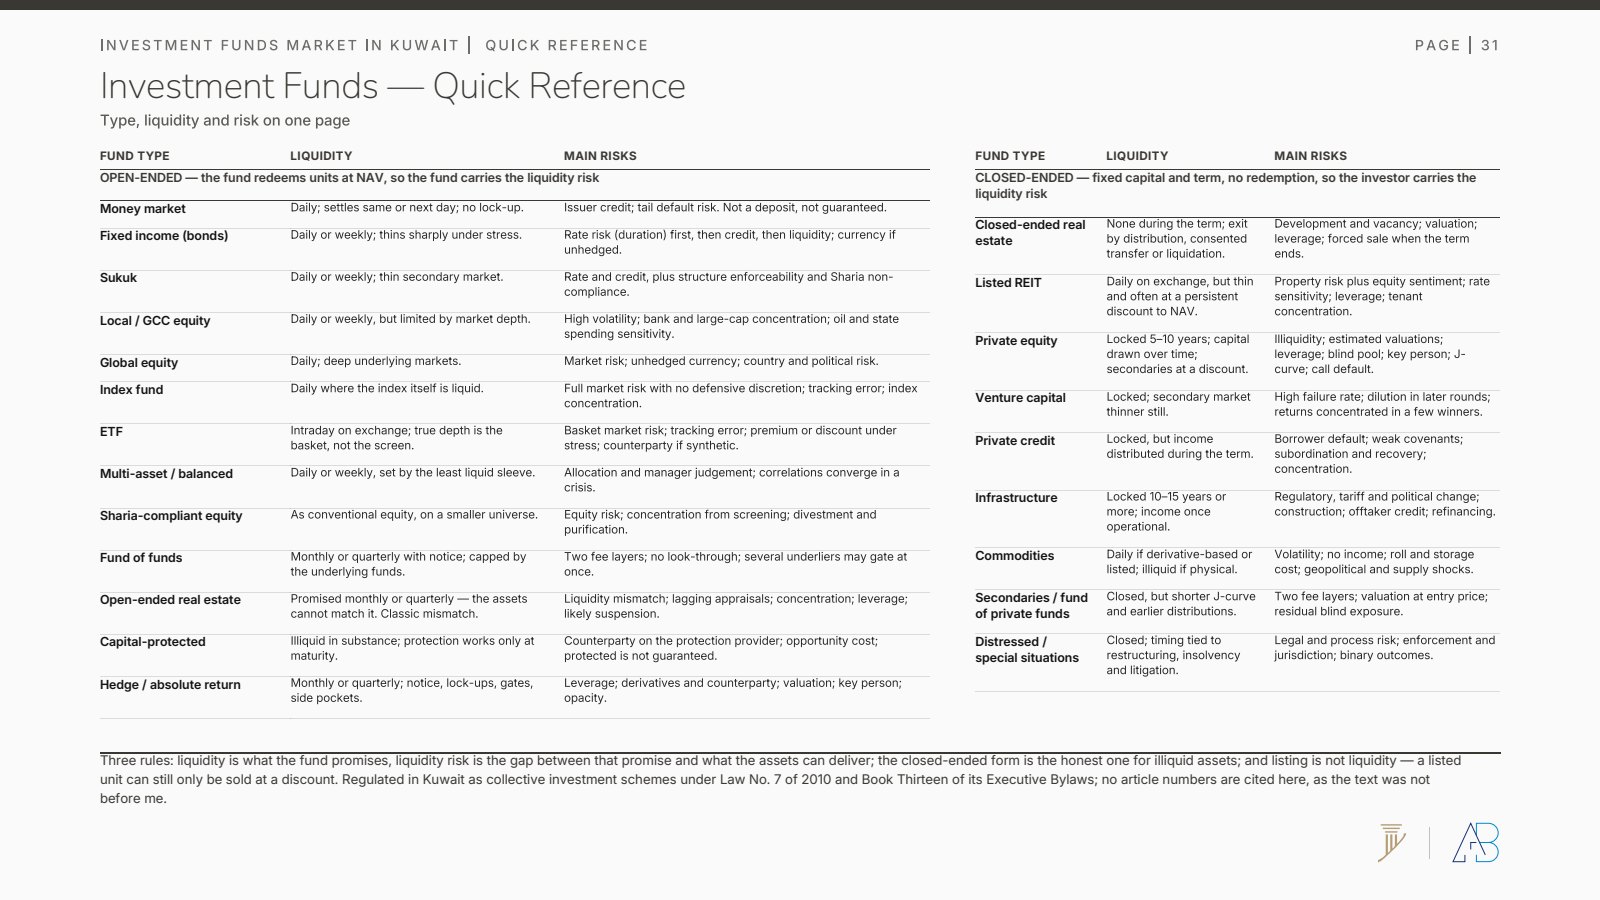
Before any of the numbers are worth anything, two distinctions have to hold. Liquidity is what a fund promises. Liquidity risk is the gap between that promise and what the assets underneath can actually deliver. An open-ended real estate fund promising monthly redemption is the classic mismatch, and listing does not fix it: a listed unit can still only be sold at a discount. The closed-ended form is the honest one for illiquid assets.
The local shelf: 65 funds, and most of the money is in cash
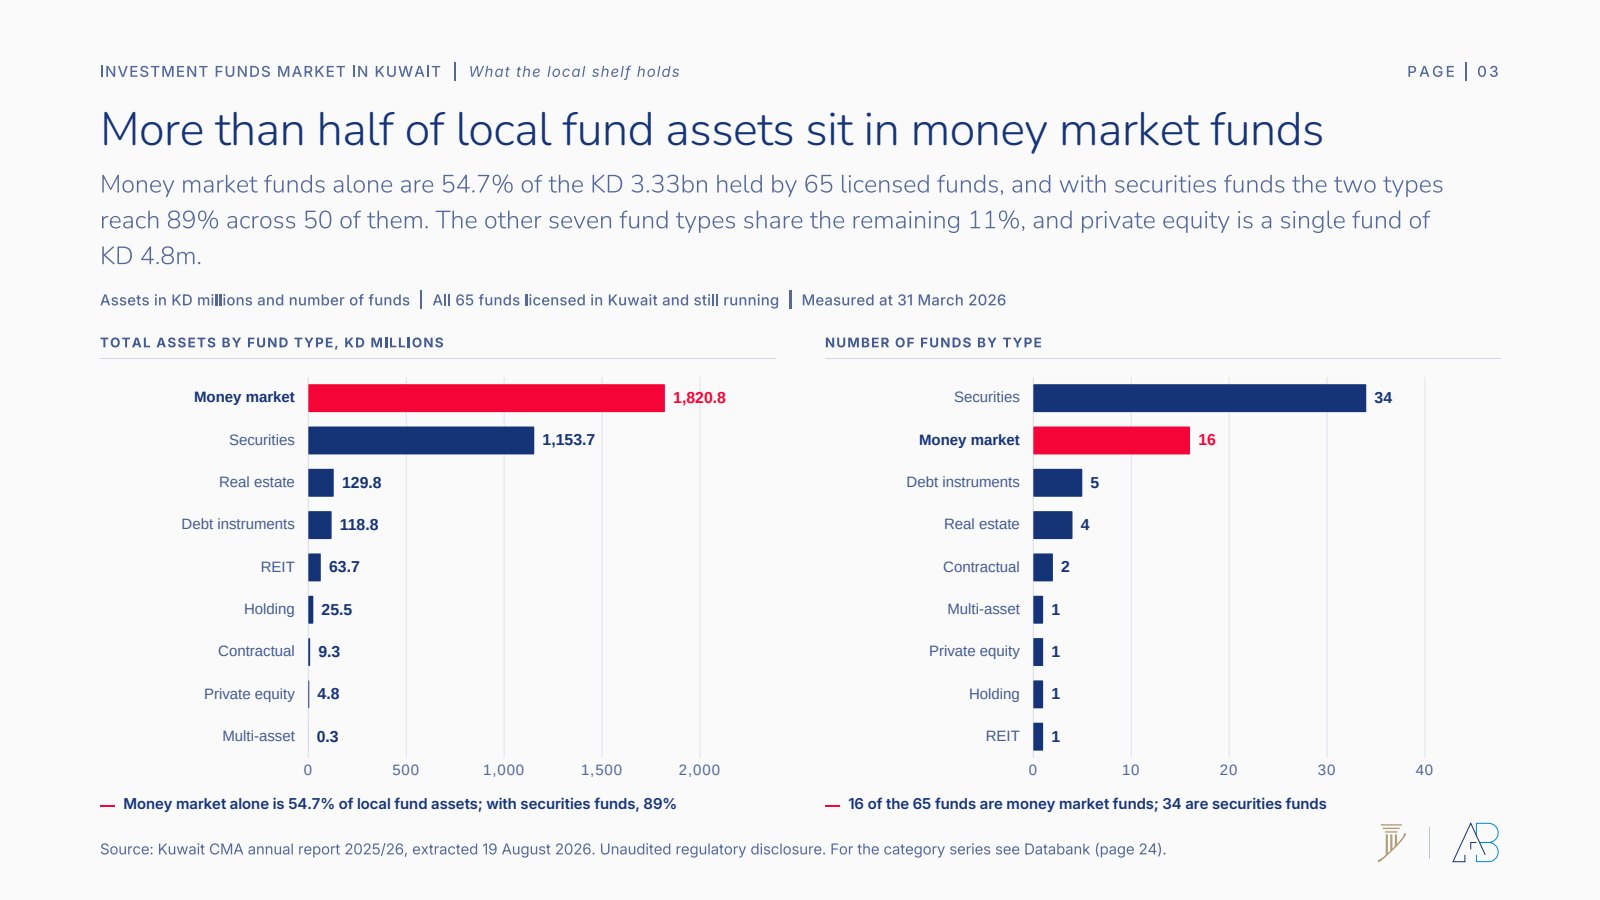
Sixty-five licensed funds were still running at 31 March 2026, holding KD 3.33bn between them. Money market funds alone are 54.7% of that. Add securities funds and two types out of nine reach 89% of the assets across 50 of the 65 funds. The other seven types share the remaining 11%. Private equity is one fund holding KD 4.8m.
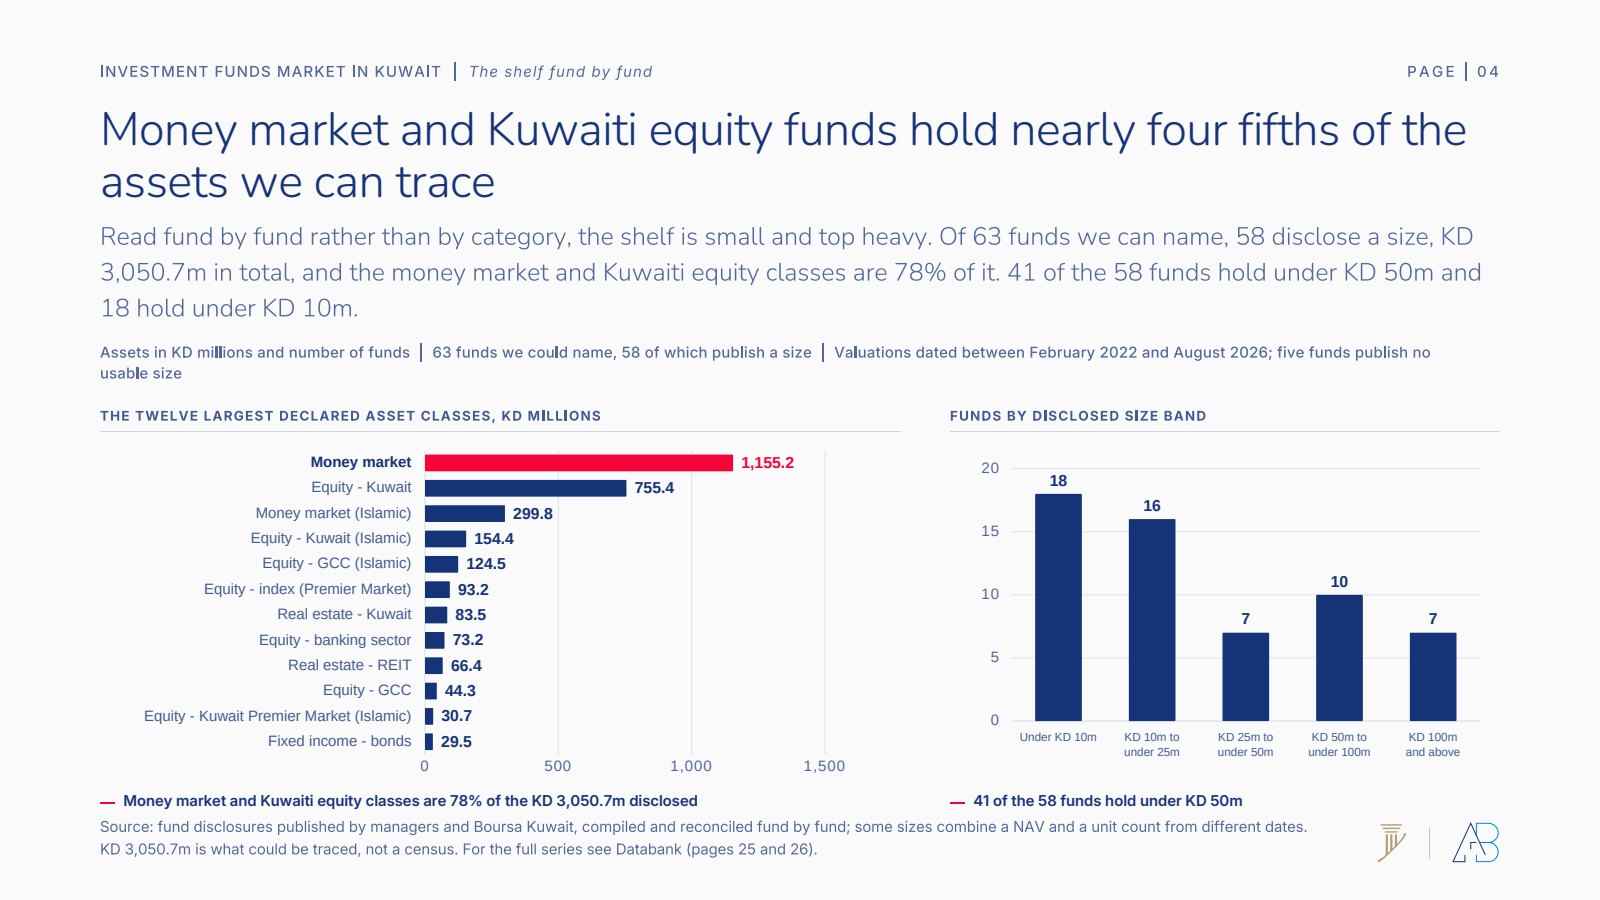
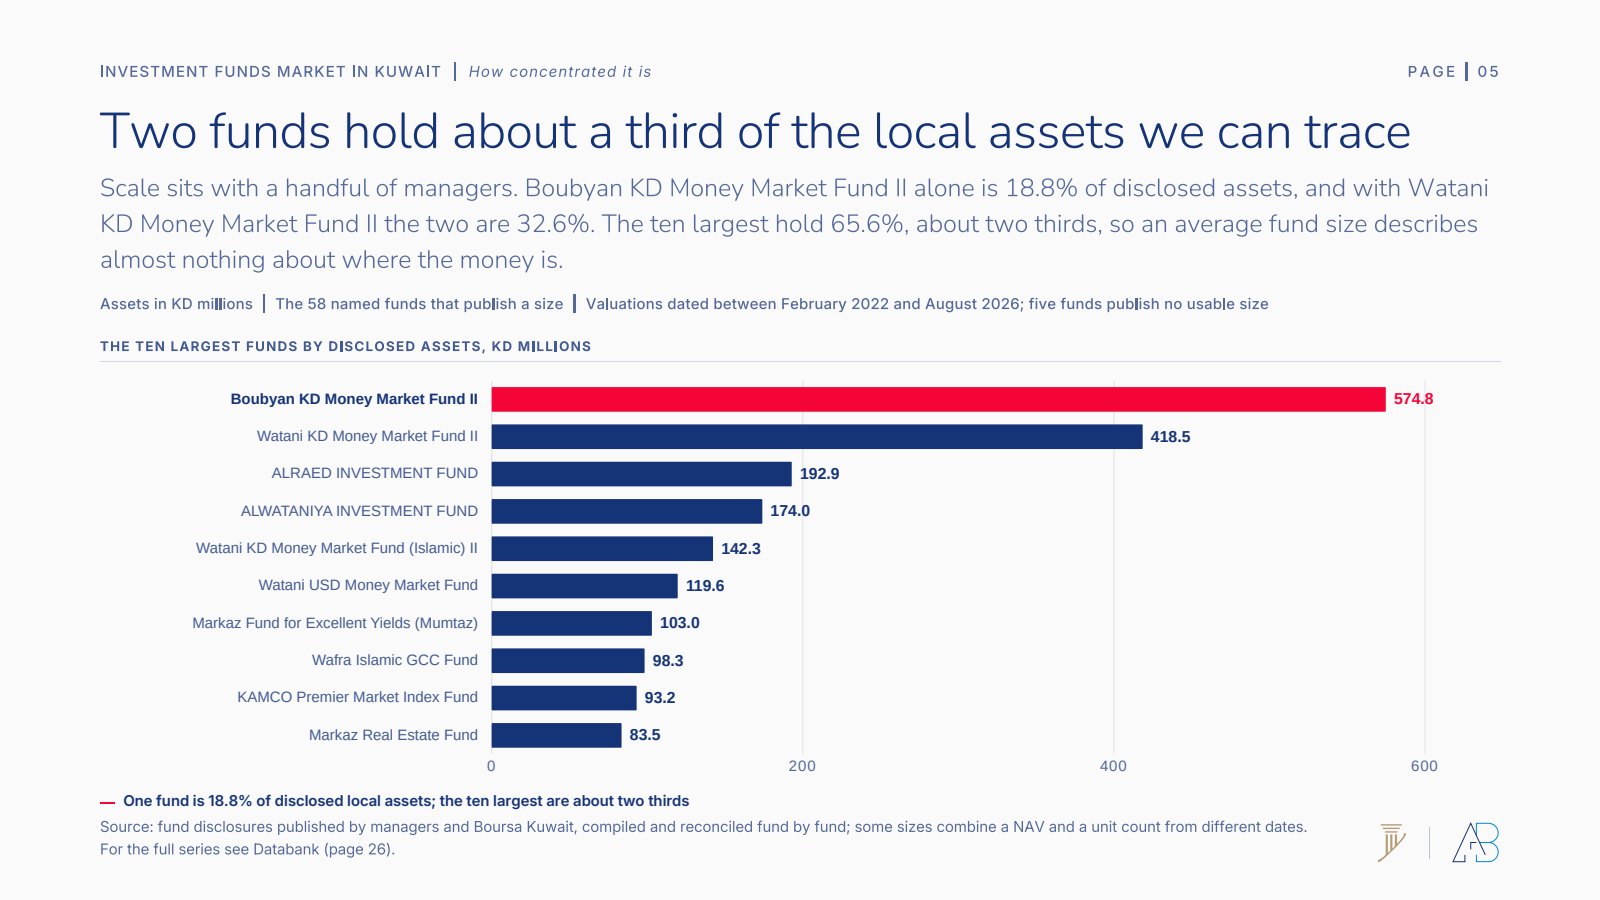
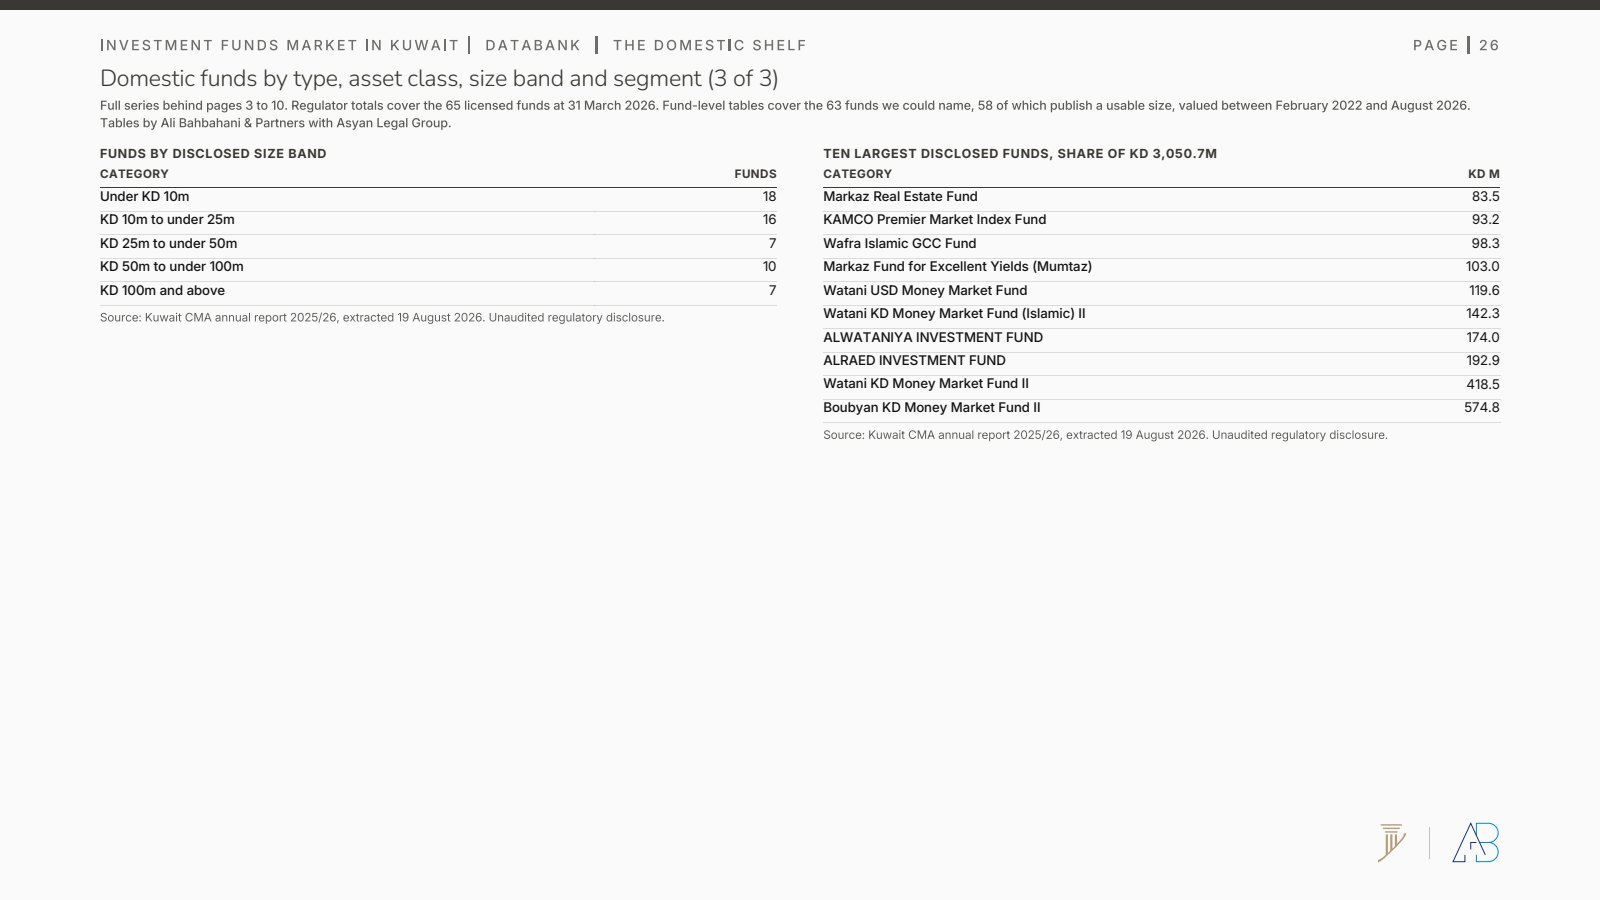
Read fund by fund rather than by regulator category, and the shelf gets smaller and more top heavy. We could name 63 funds. Fifty-eight of them publish a usable size, KD 3,050.7m in total. Money market and Kuwaiti equity classes are 78% of that. Forty-one of the 58 hold under KD 50m and 18 hold under KD 10m. KD 3,050.7m is what could be traced, not a census.
Scale sits with a handful of managers. Boubyan KD Money Market Fund II on its own is 18.8% of disclosed assets. Add Watani KD Money Market Fund II and the two are 32.6%. The ten largest hold 65.6%. An average fund size describes almost nothing about where the money actually is.
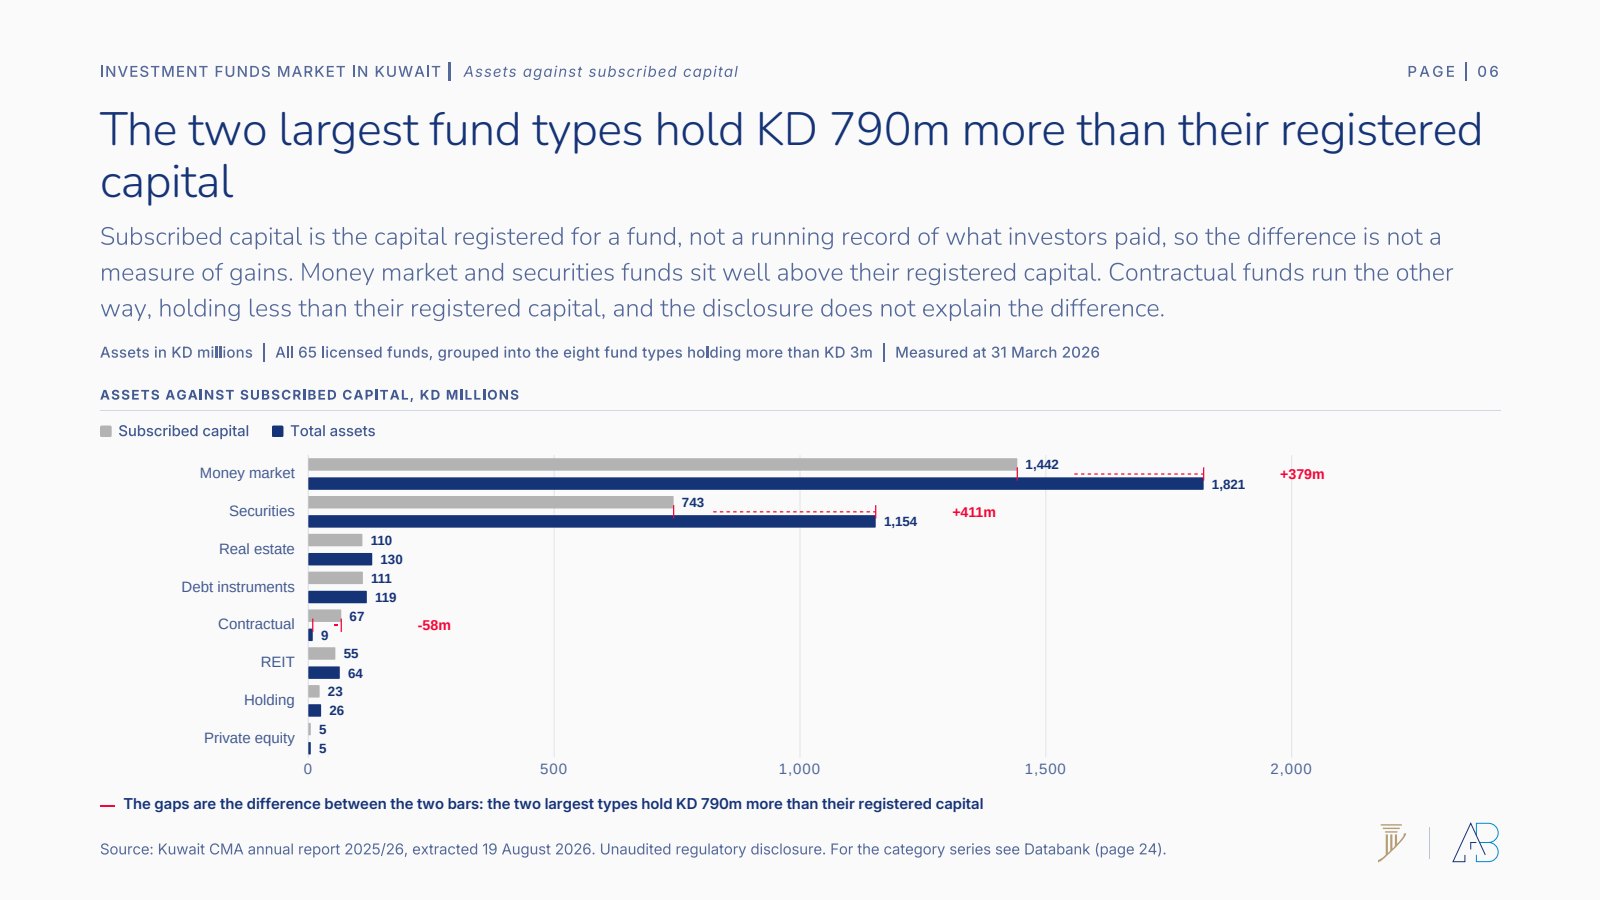
One oddity deserves its own page. Money market and securities funds hold about KD 790m more than their registered capital. Subscribed capital is the capital registered for a fund, not a running record of what investors paid, so the gap is not a measure of gains. Contractual funds run the other way, holding KD 9m against KD 67m of registered capital. The disclosure does not explain either direction.
Six years of growth, with a real drawdown inside it
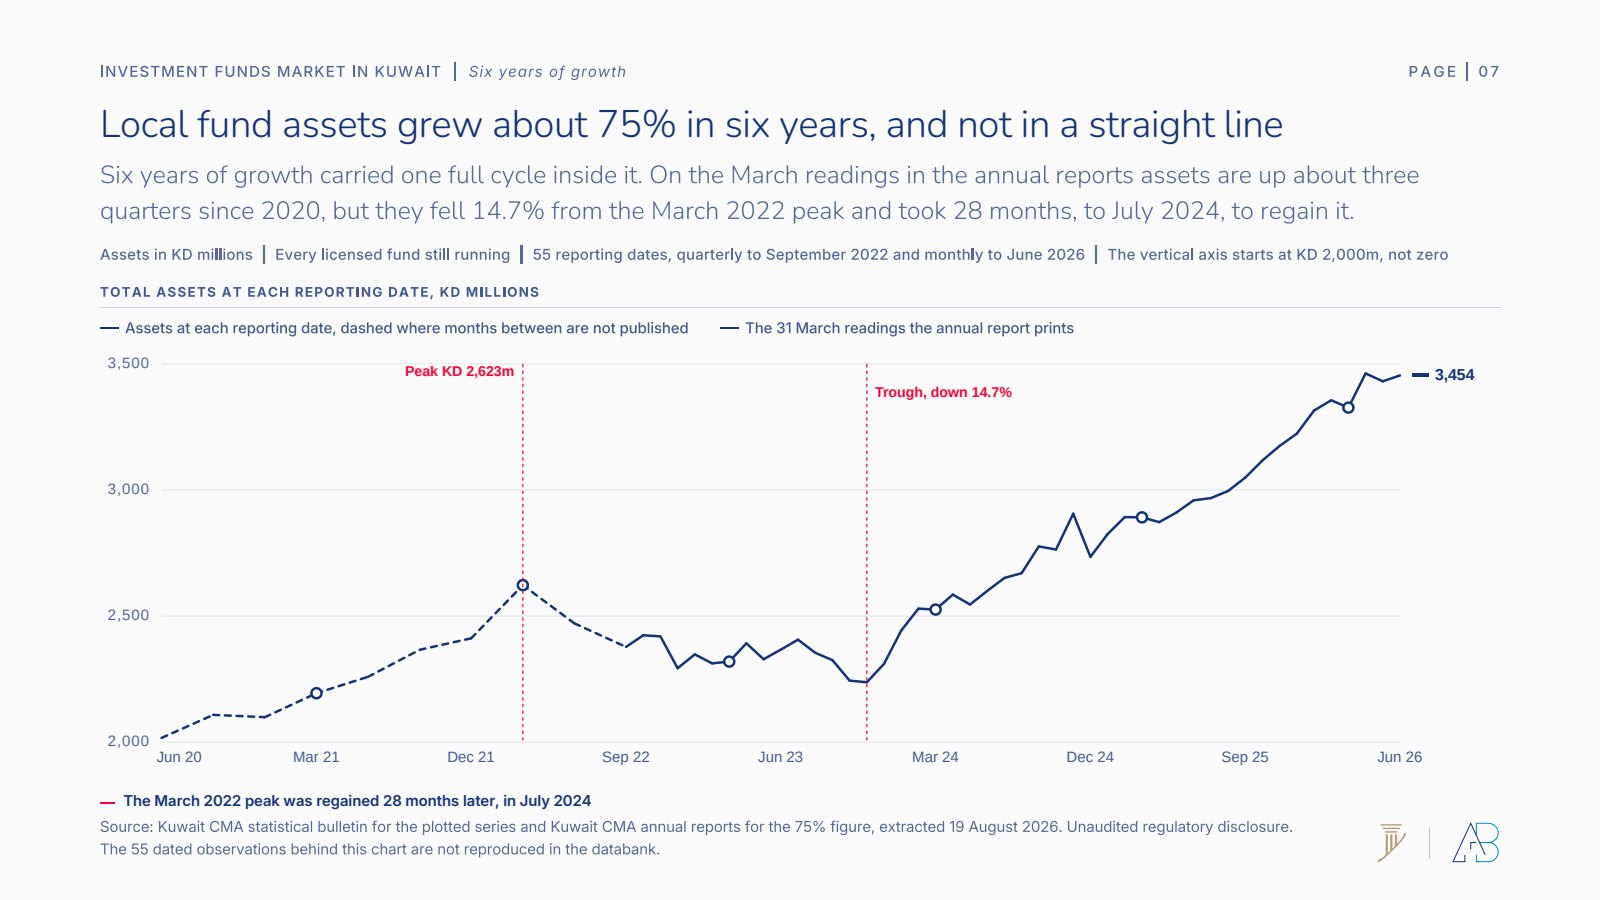
On the March readings in the annual reports, local fund assets are up about 75% since 2020. The monthly series tells you what the year-ends hide. Assets fell 14.7% from the March 2022 peak of KD 2,623m and took 28 months, to July 2024, to get back. That is a full cycle inside a growth story, and it only shows up because the regulator publishes 55 reporting dates rather than six.
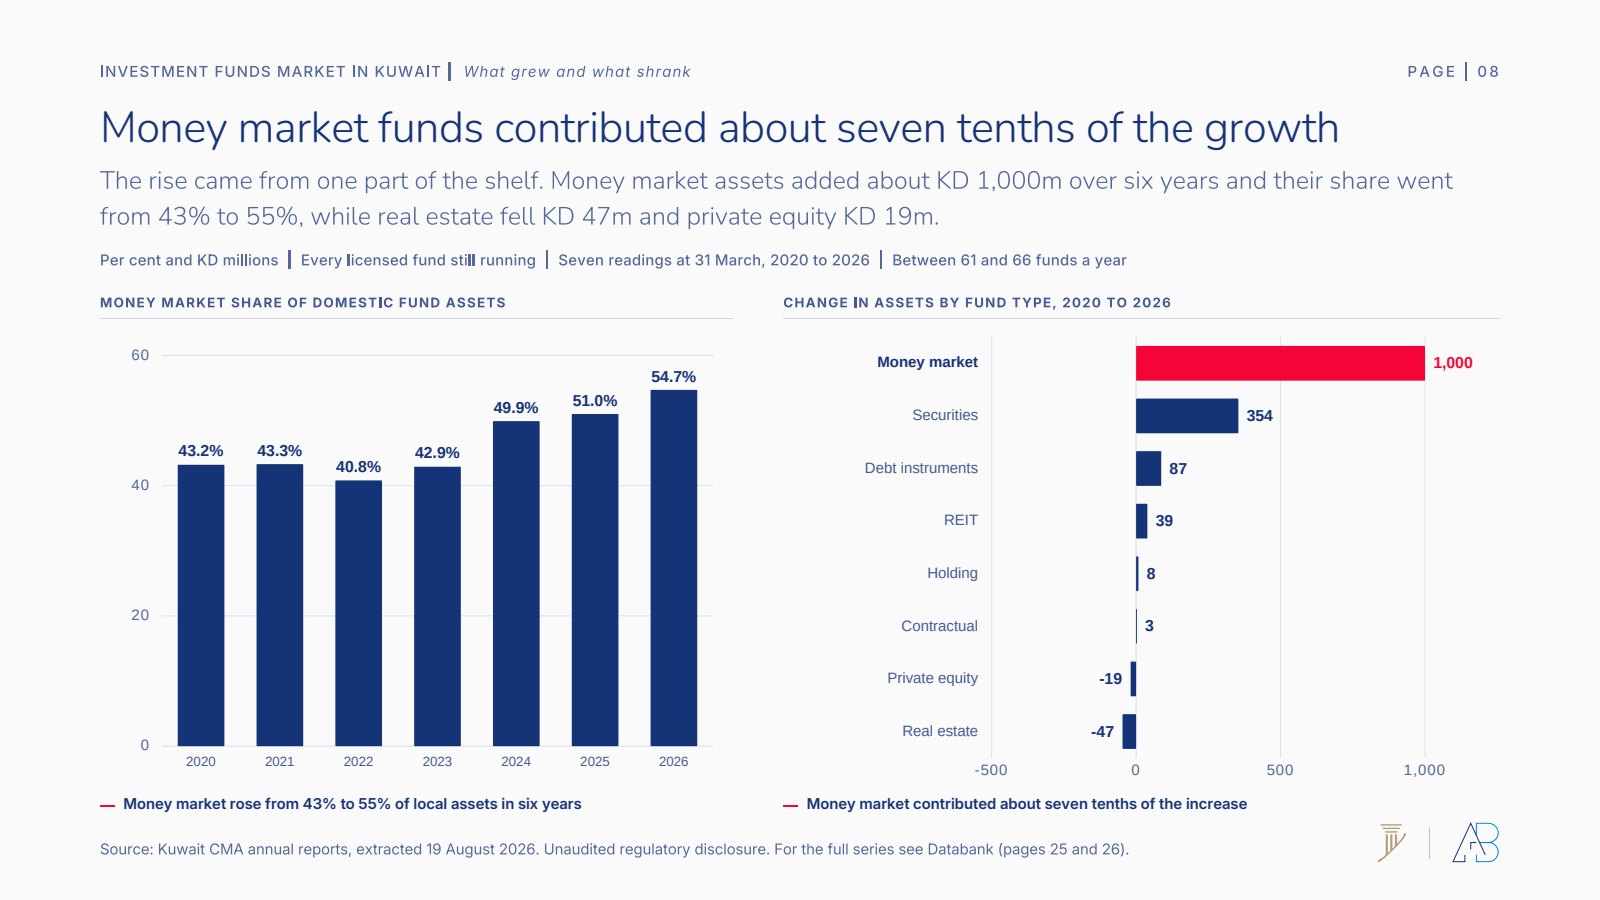
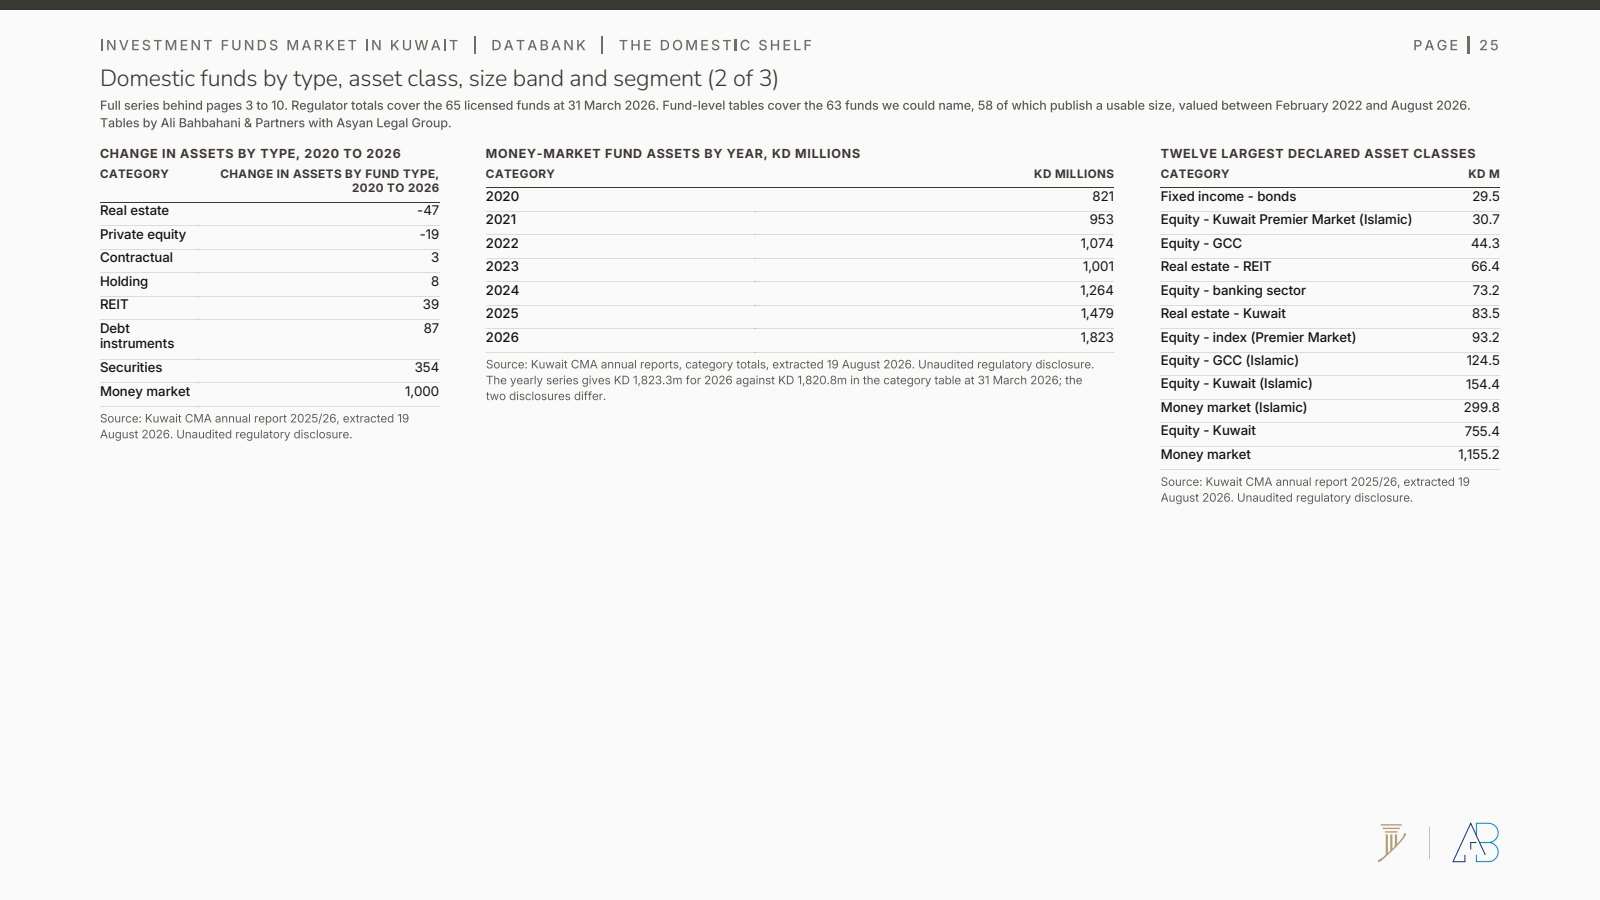
The growth came from one part of the shelf. Money market assets added about KD 1,000m over six years, roughly seven tenths of the total increase, and their share went from 43% to 55%. Securities funds added KD 354m. Real estate fell KD 47m and private equity KD 19m. If you want a one-line summary of what Kuwaitis bought between 2020 and 2026, it is cash management. For the property side of the same period, we covered it separately in Kuwait Property in 2025.
Islamic and conventional have drawn level
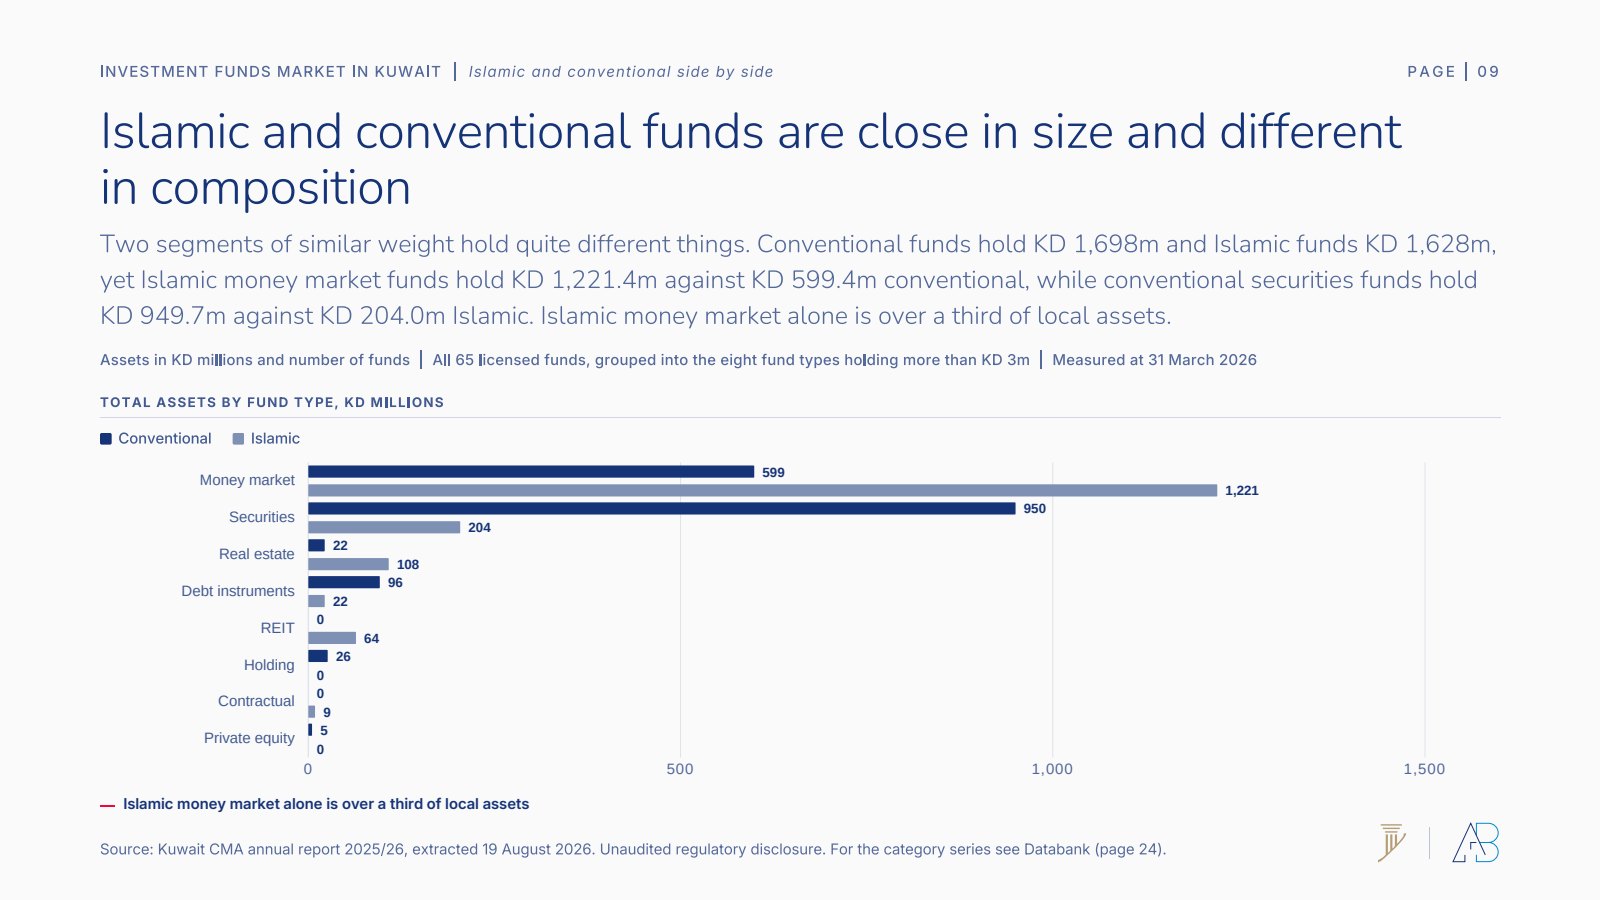
Two segments of similar weight now hold quite different things. At 31 March 2026 conventional funds held KD 1,698m and Islamic funds KD 1,628m. Underneath, Islamic money market funds hold KD 1,221.4m against KD 599.4m conventional, while conventional securities funds hold the larger book.
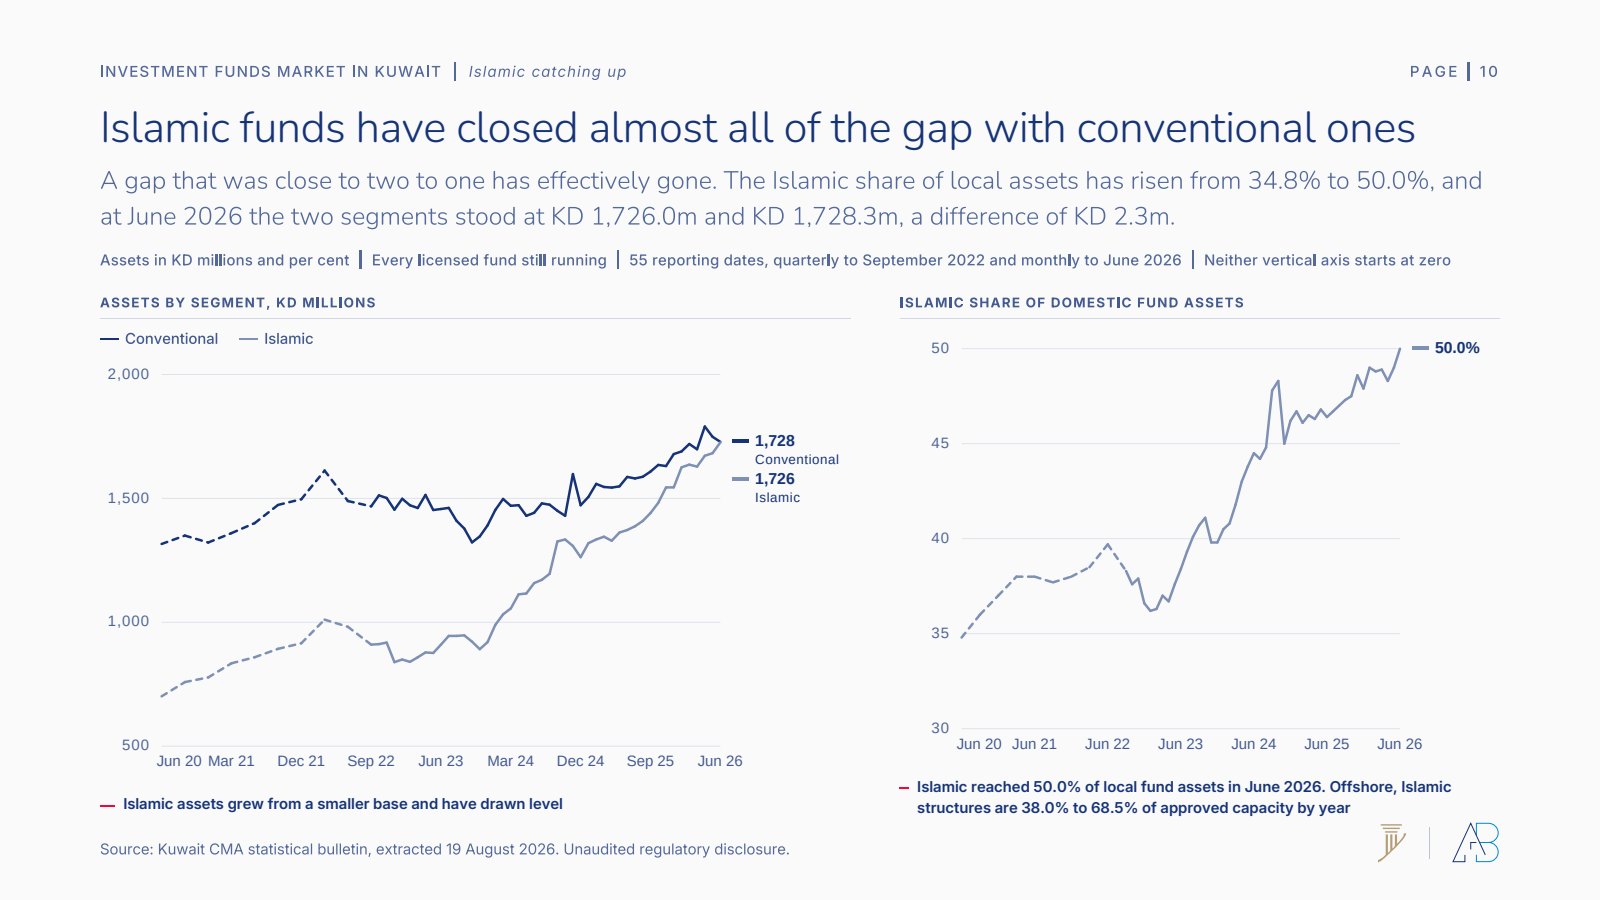
The trend line is the finding. The Islamic share of local fund assets has risen from 34.8% to 50.0% in six years. At June 2026 the two segments stood at KD 1,726.0m and KD 1,728.3m, a difference of KD 2.3m. A gap that was close to two to one has effectively gone.
The offshore shelf: 174 approvals, none of them retail
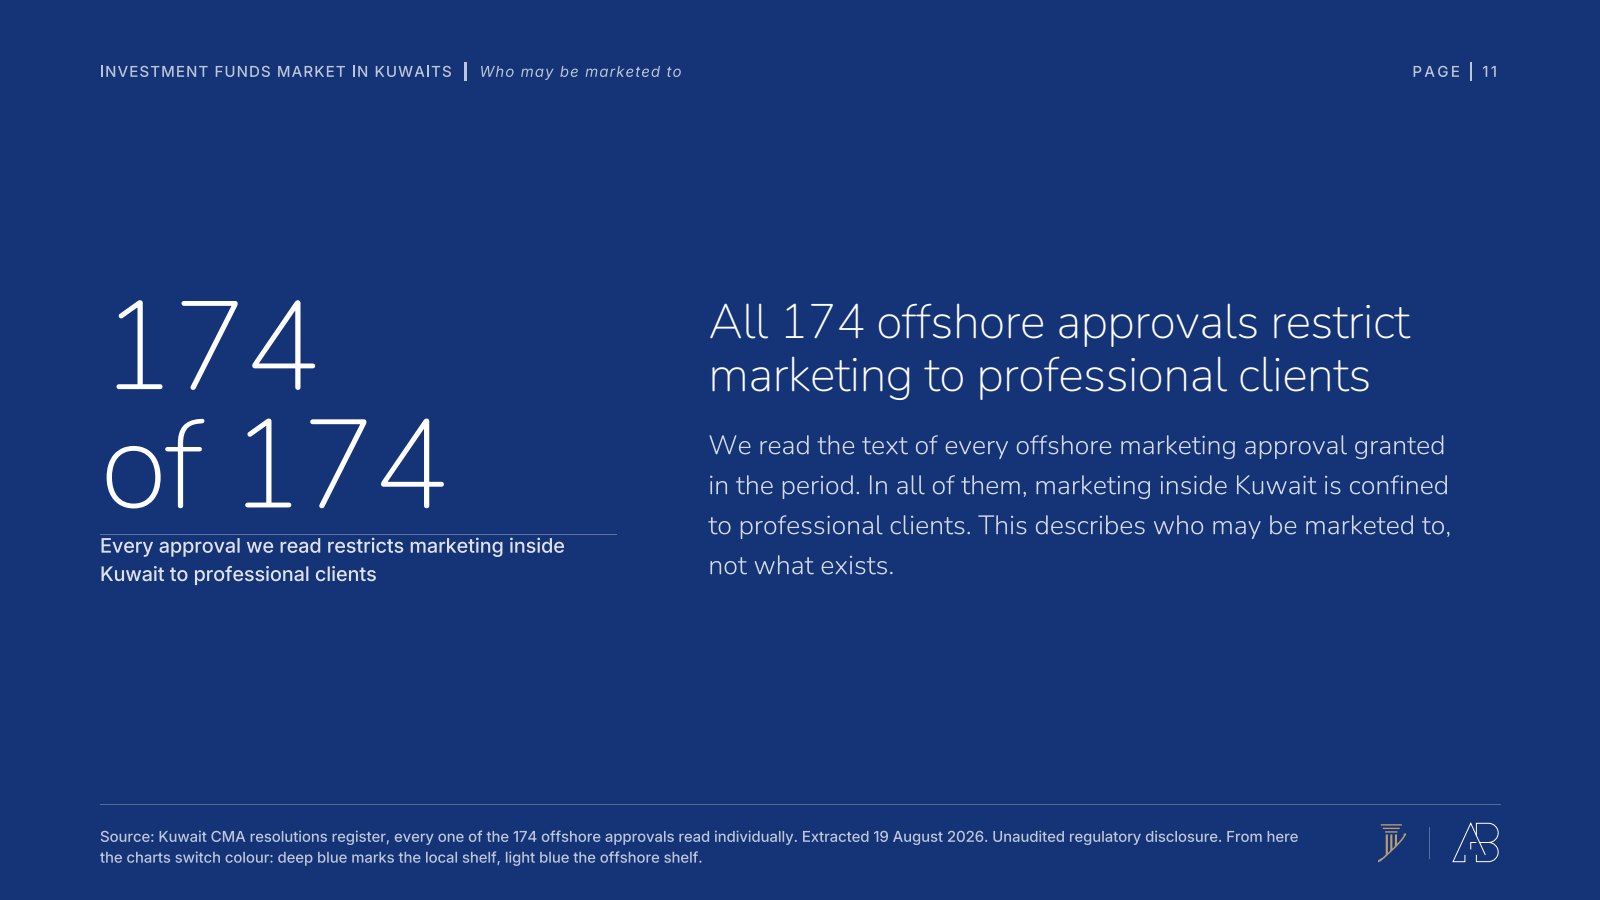
We read the text of every offshore marketing approval granted in the period. In all 174, marketing inside Kuwait is confined to professional clients. Not most of them. All of them. That describes who may be marketed to, not what exists, and it is the single cleanest line in the study.
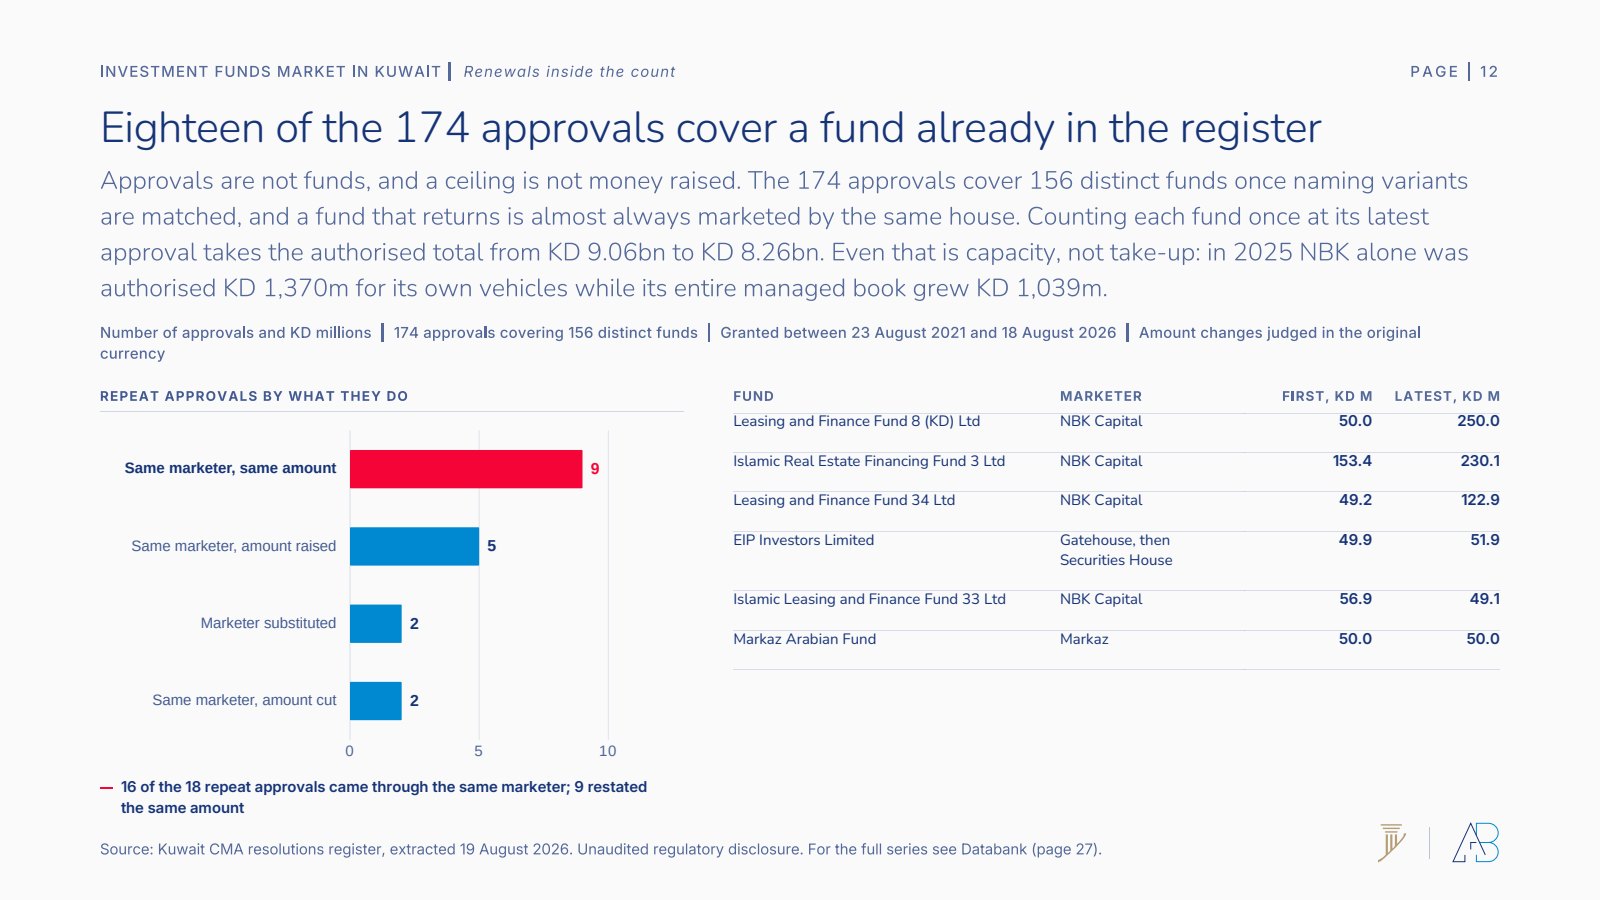
Approvals are not funds. Match naming variants and the 174 approvals cover 156 distinct funds, with 18 of them re-approving something already in the register. Sixteen of those 18 came back through the same marketer, and nine restated the same amount. Counting each fund once at its latest approval takes the authorised total from KD 9.06bn to KD 8.26bn.
Even KD 8.26bn is capacity, not take-up. In 2025 NBK alone was authorised KD 1,370m for its own vehicles while its entire managed book grew KD 1,039m, market appreciation included. A ceiling is permission to raise, not money raised, and nothing in the public record closes that gap.
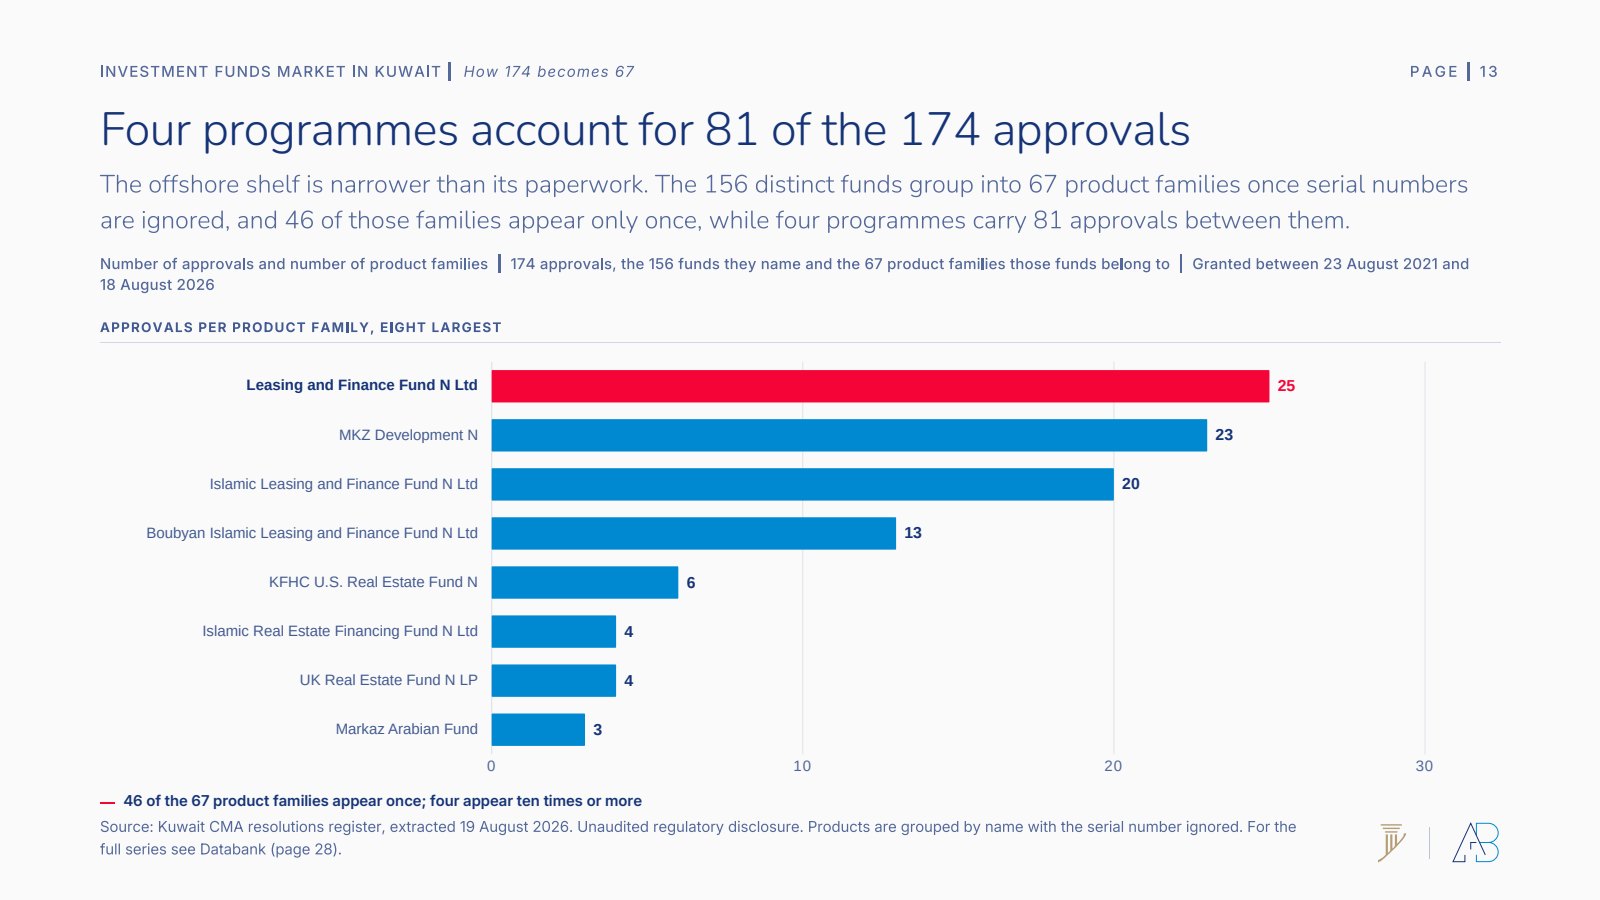
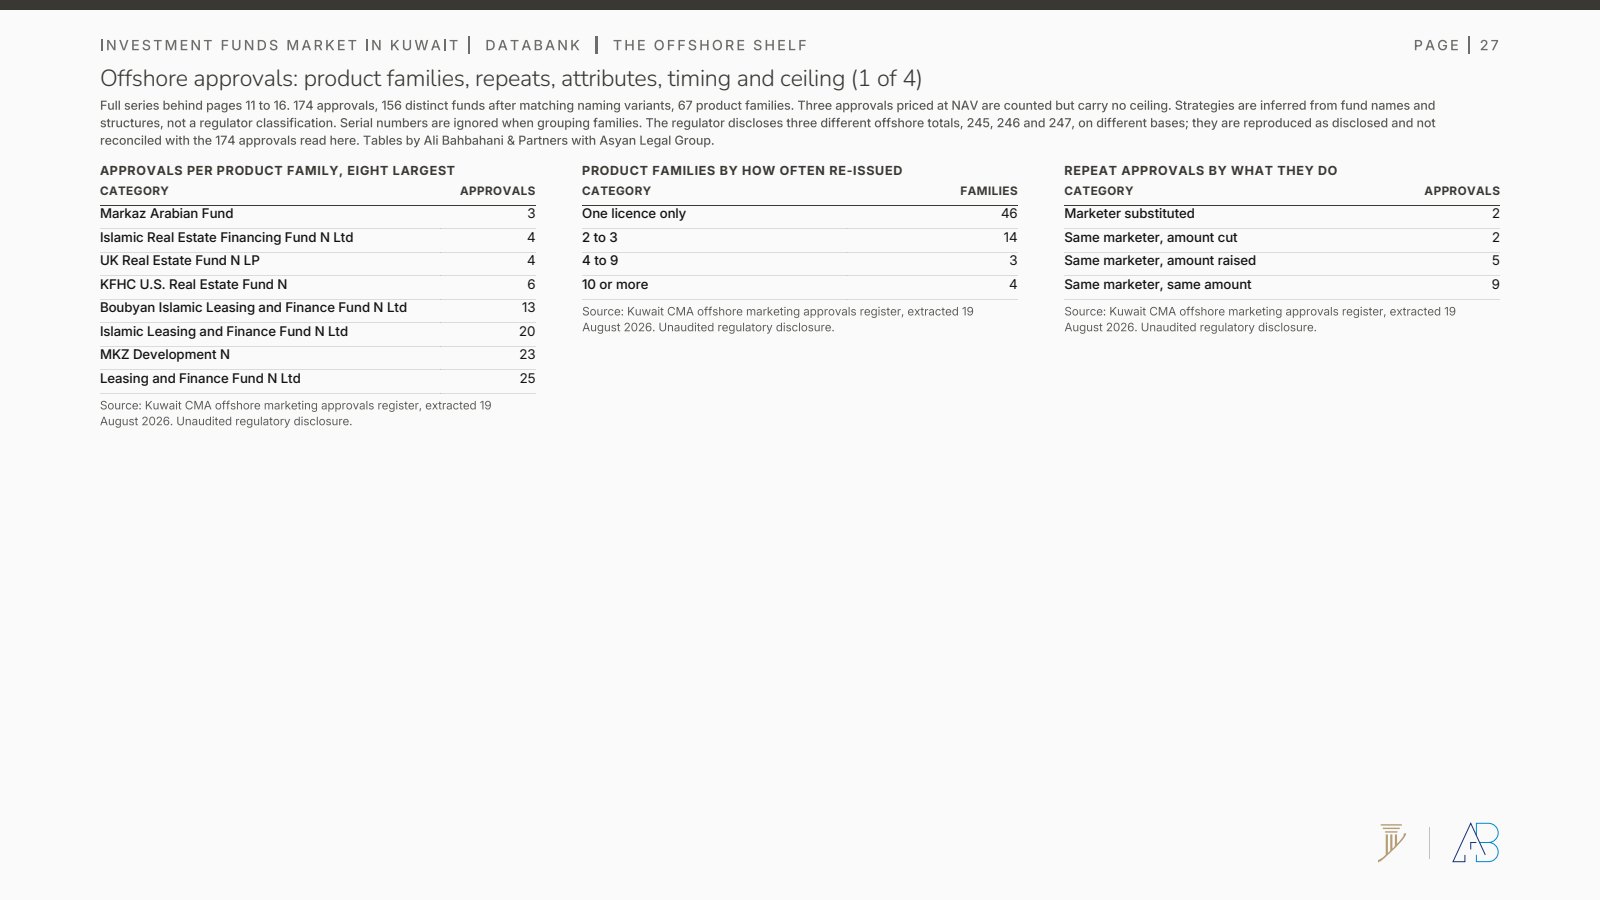
Group by product family and the shelf narrows again. The 156 funds fall into 67 families once serial numbers are ignored, and 46 of those appear only once. Four programmes carry 81 approvals between them: Leasing and Finance Fund with 25, MKZ Development with 23, Islamic Leasing and Finance with 20, and Boubyan Islamic Leasing and Finance with 13. The paperwork is wider than the shelf.
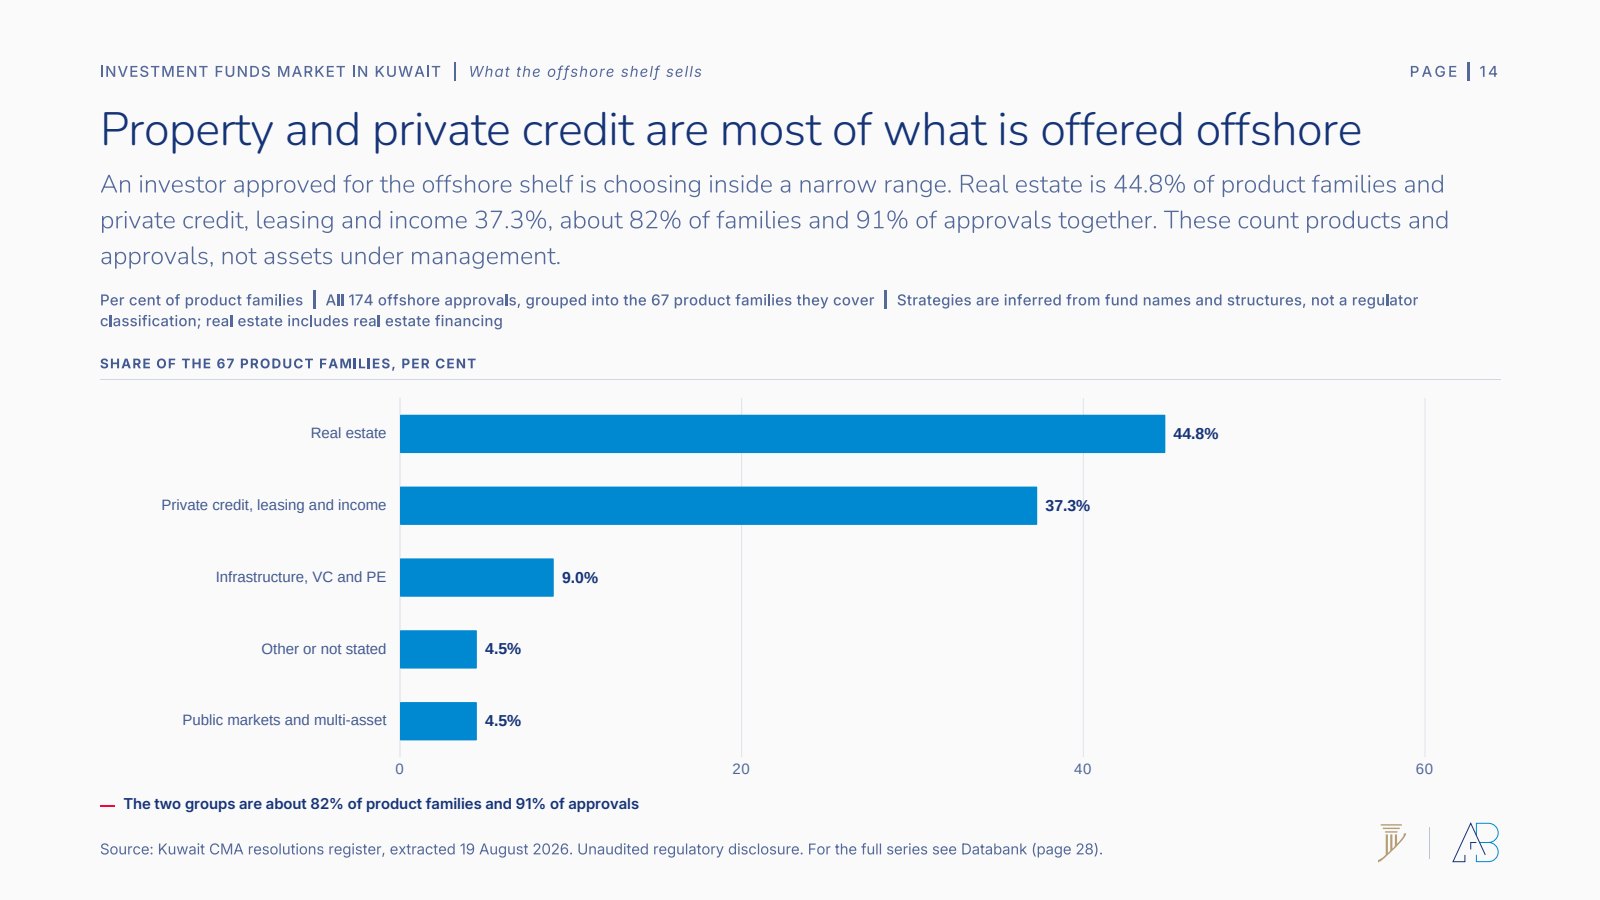
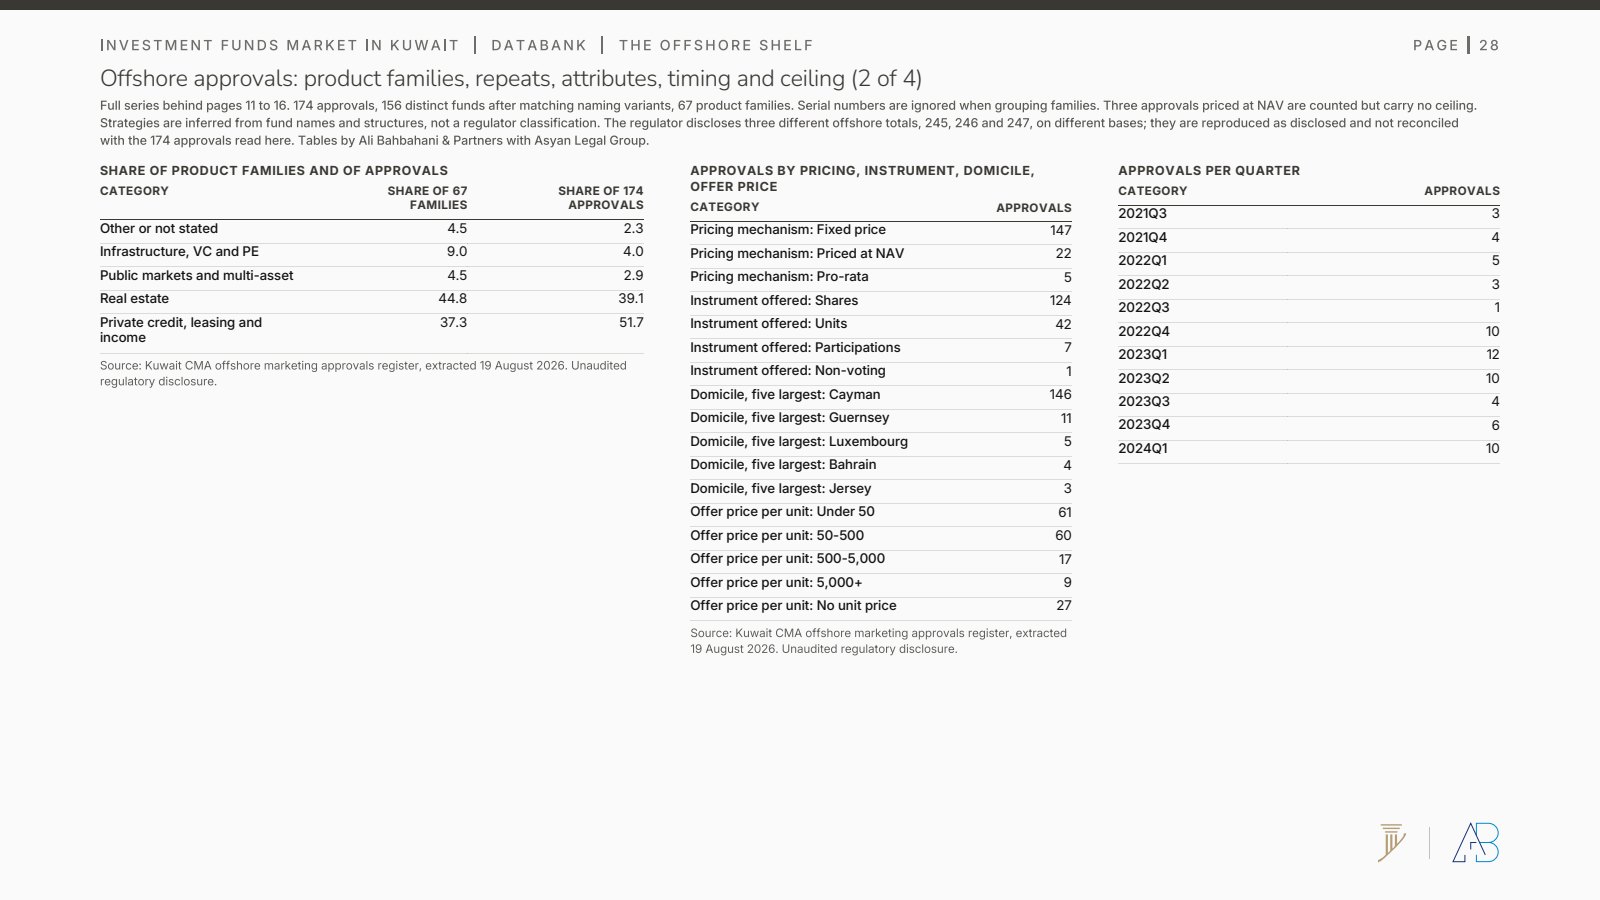
What is on offer is narrow. Real estate is 44.8% of product families and private credit, leasing and income 37.3%. Together about 82% of families and 91% of approvals. An investor cleared for the offshore shelf is choosing inside a small range, and these count products and approvals, not assets under management.
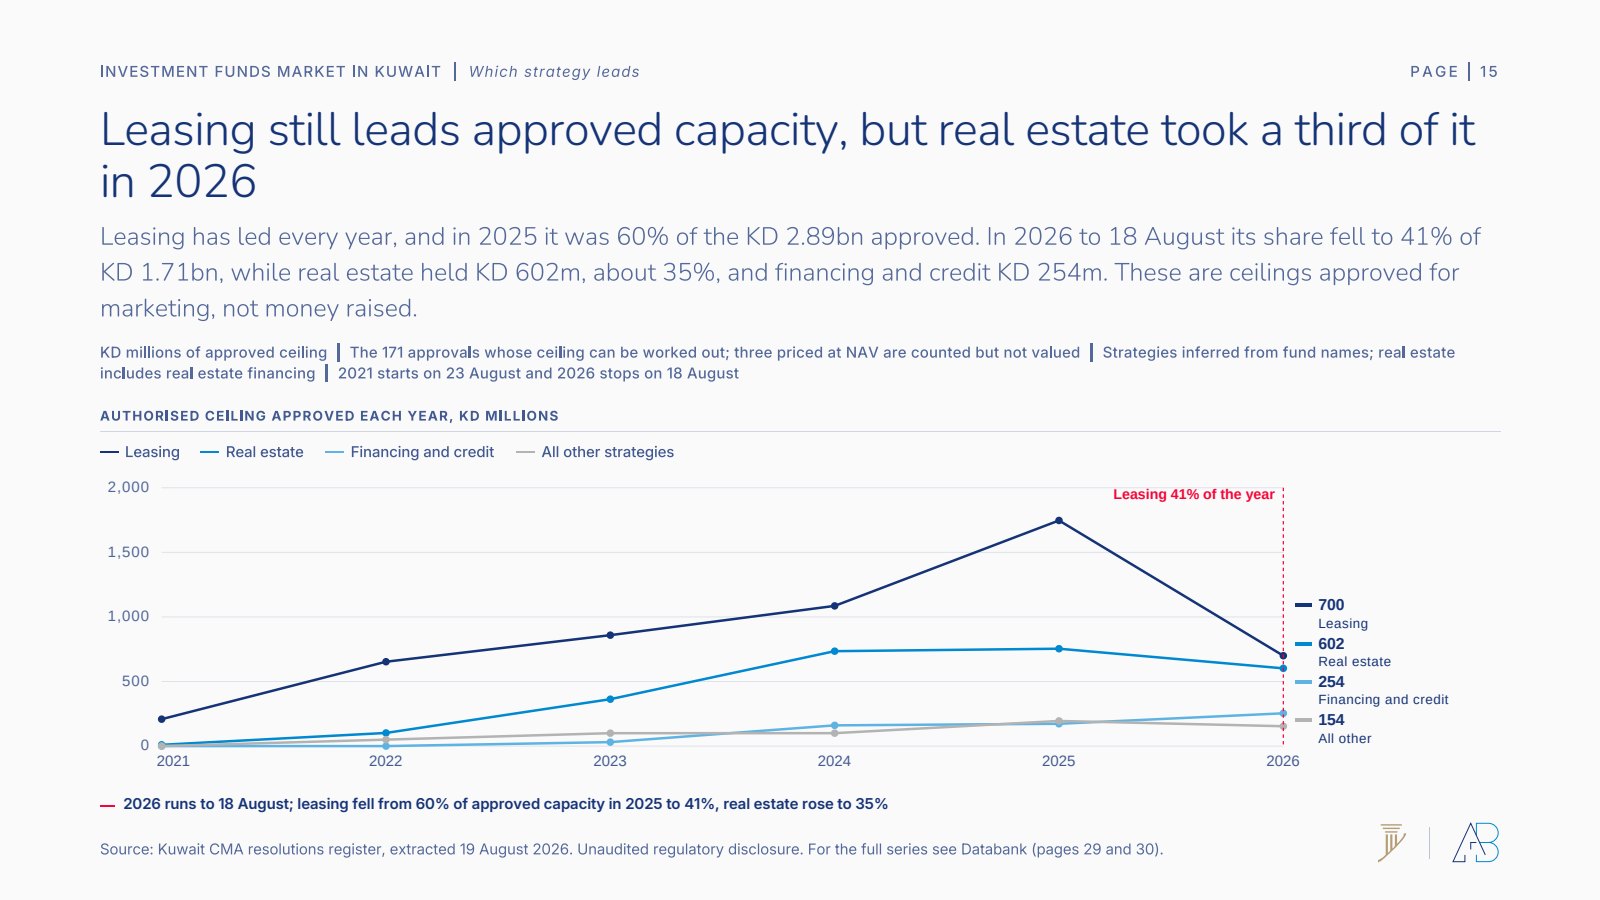
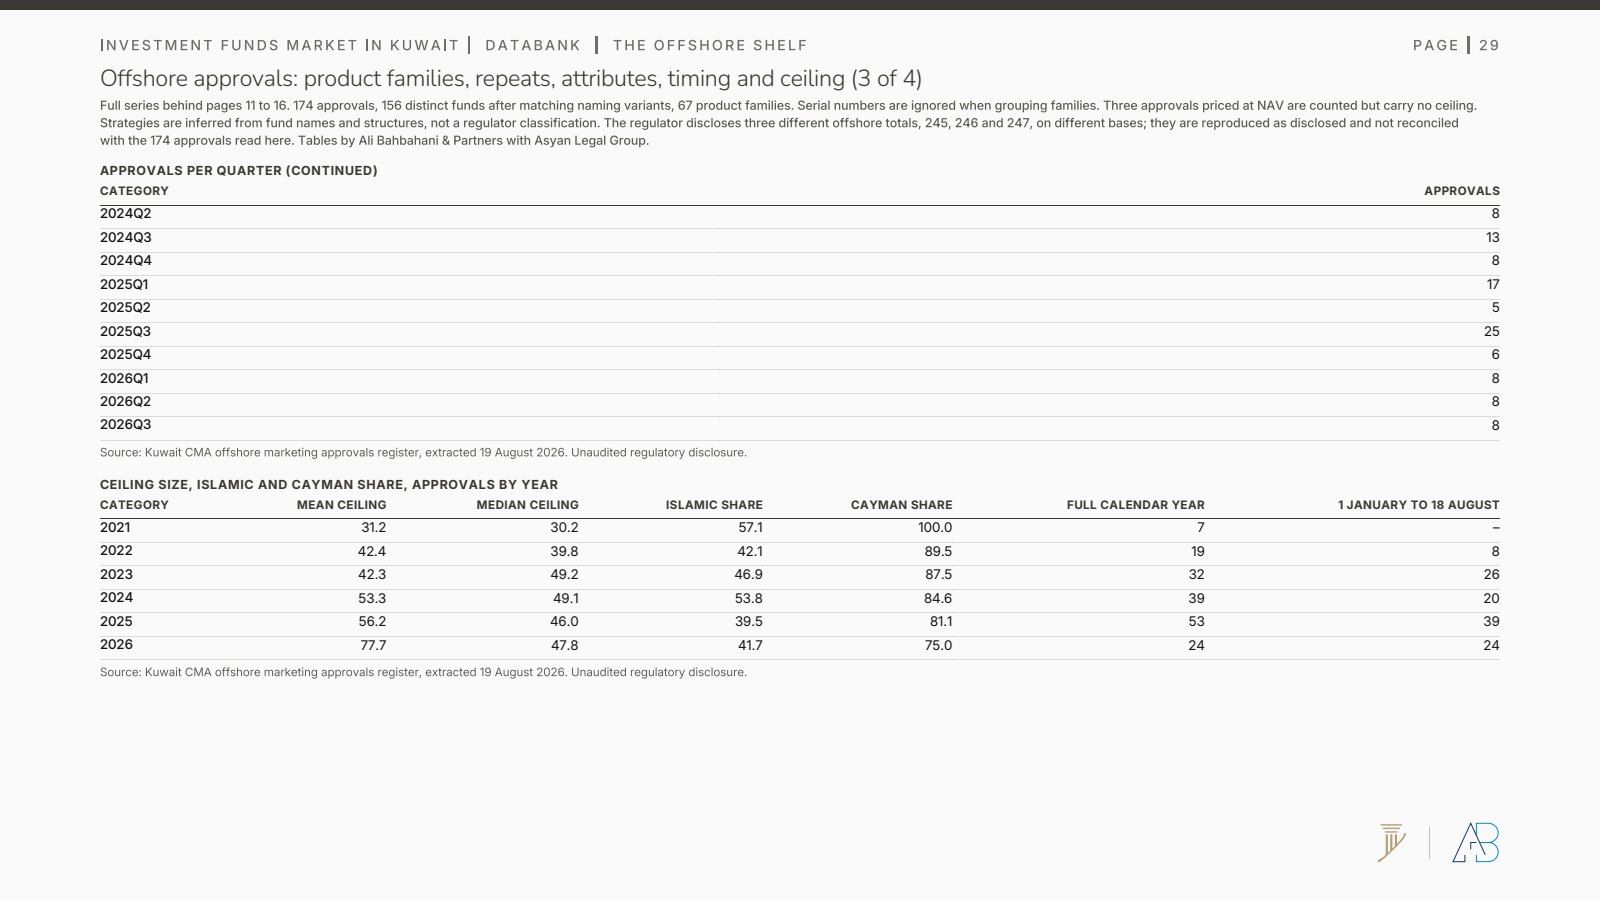
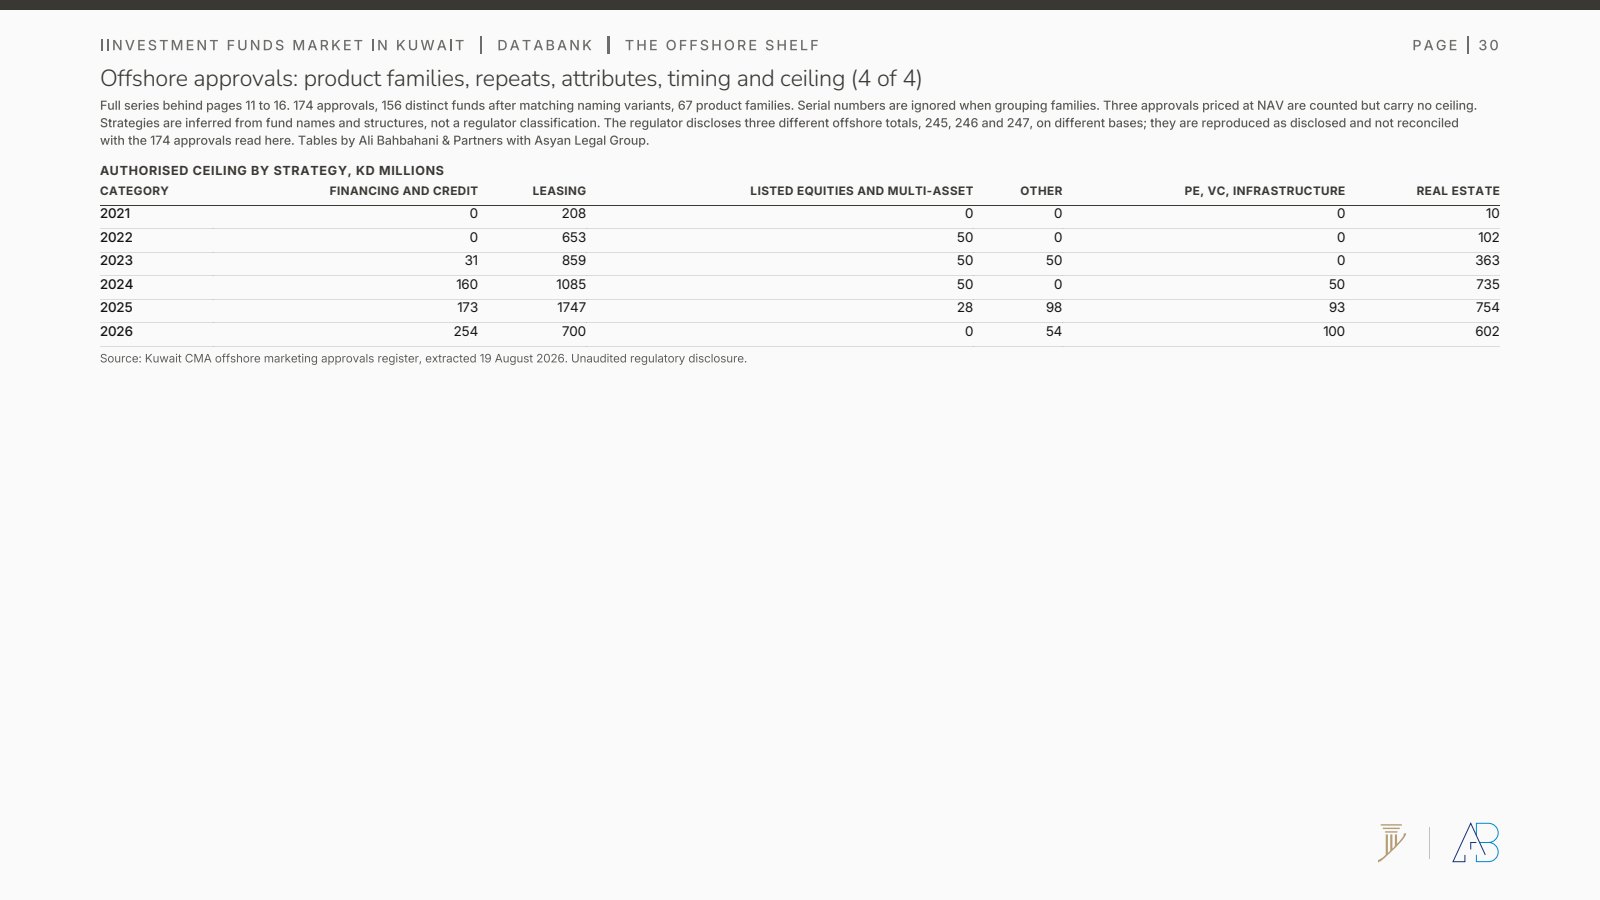
By approved capacity, leasing has led every year. In 2025 it was 60% of the KD 2.89bn approved. In 2026 to 18 August its share fell to 41% of KD 1.71bn, while real estate took KD 602m, about 35%, and financing and credit KD 254m. Of the 174 approvals, 171 carry a ceiling that can be worked out; three are priced at NAV and are counted but not valued.
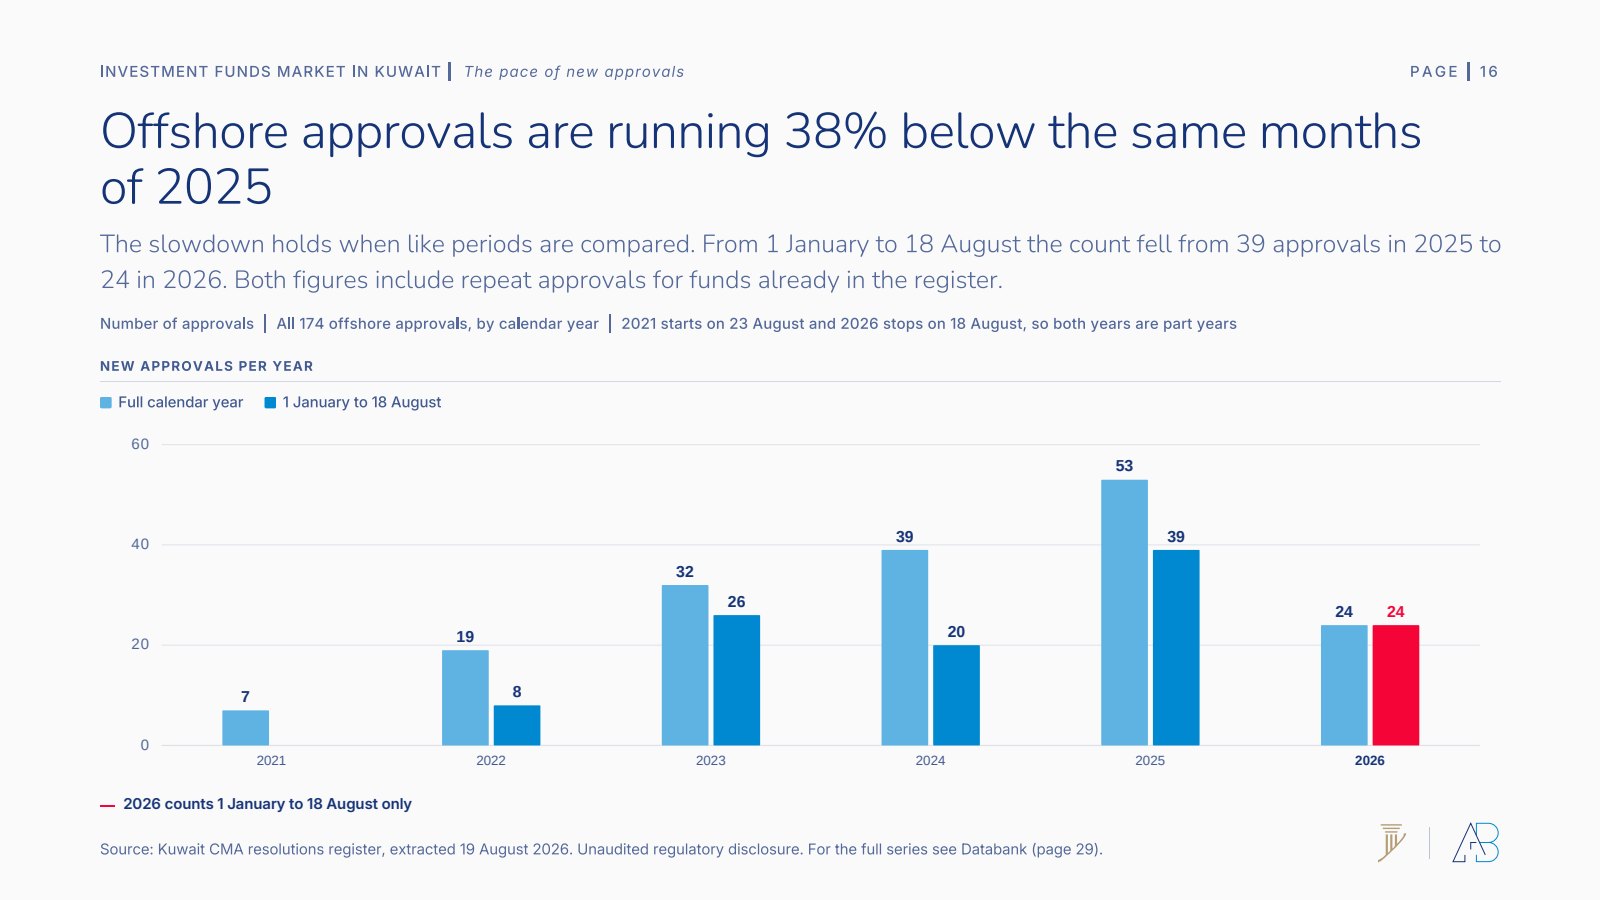
The pace has dropped. Comparing like periods, 1 January to 18 August, the count fell from 39 approvals in 2025 to 24 in 2026, about 38% fewer. Both figures include repeats. The full-year bars are misleading on their own because 2021 starts on 23 August and 2026 stops on 18 August.
The two shelves barely overlap
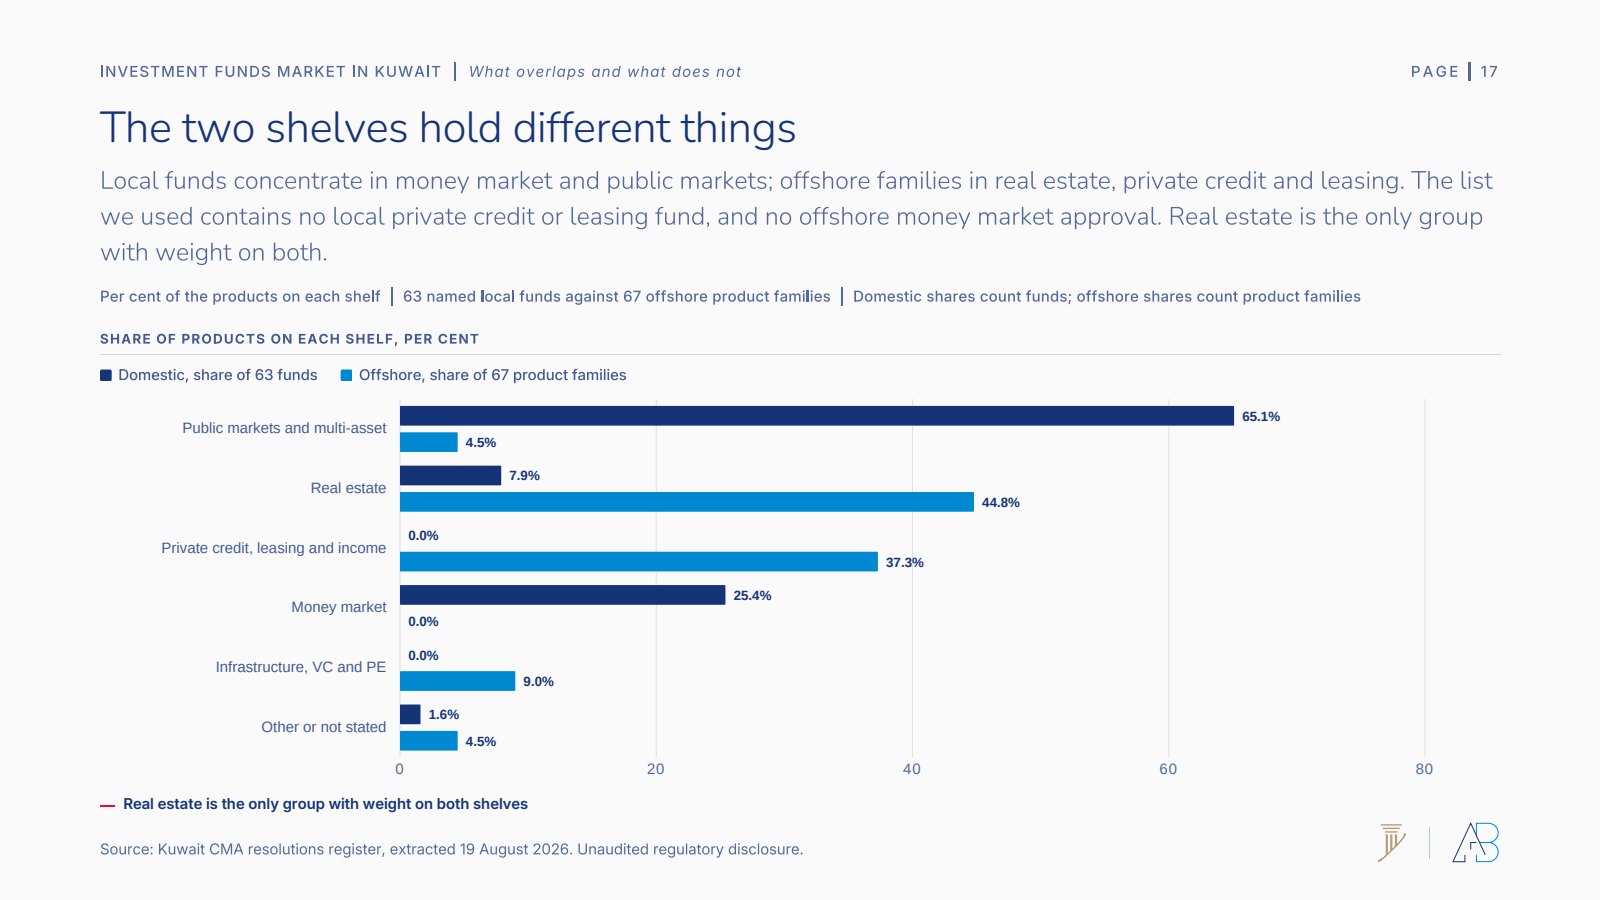
Put the shelves side by side and they are close to disjoint. Local funds concentrate in public markets (65.1% of the 63 named funds) and money market (25.4%). Offshore families concentrate in real estate (44.8%) and private credit, leasing and income (37.3%). The list we used contains no local private credit or leasing fund, and no offshore money market approval. Real estate is the only group with weight on both, at 7.9% against 44.8%.
Who actually sells this
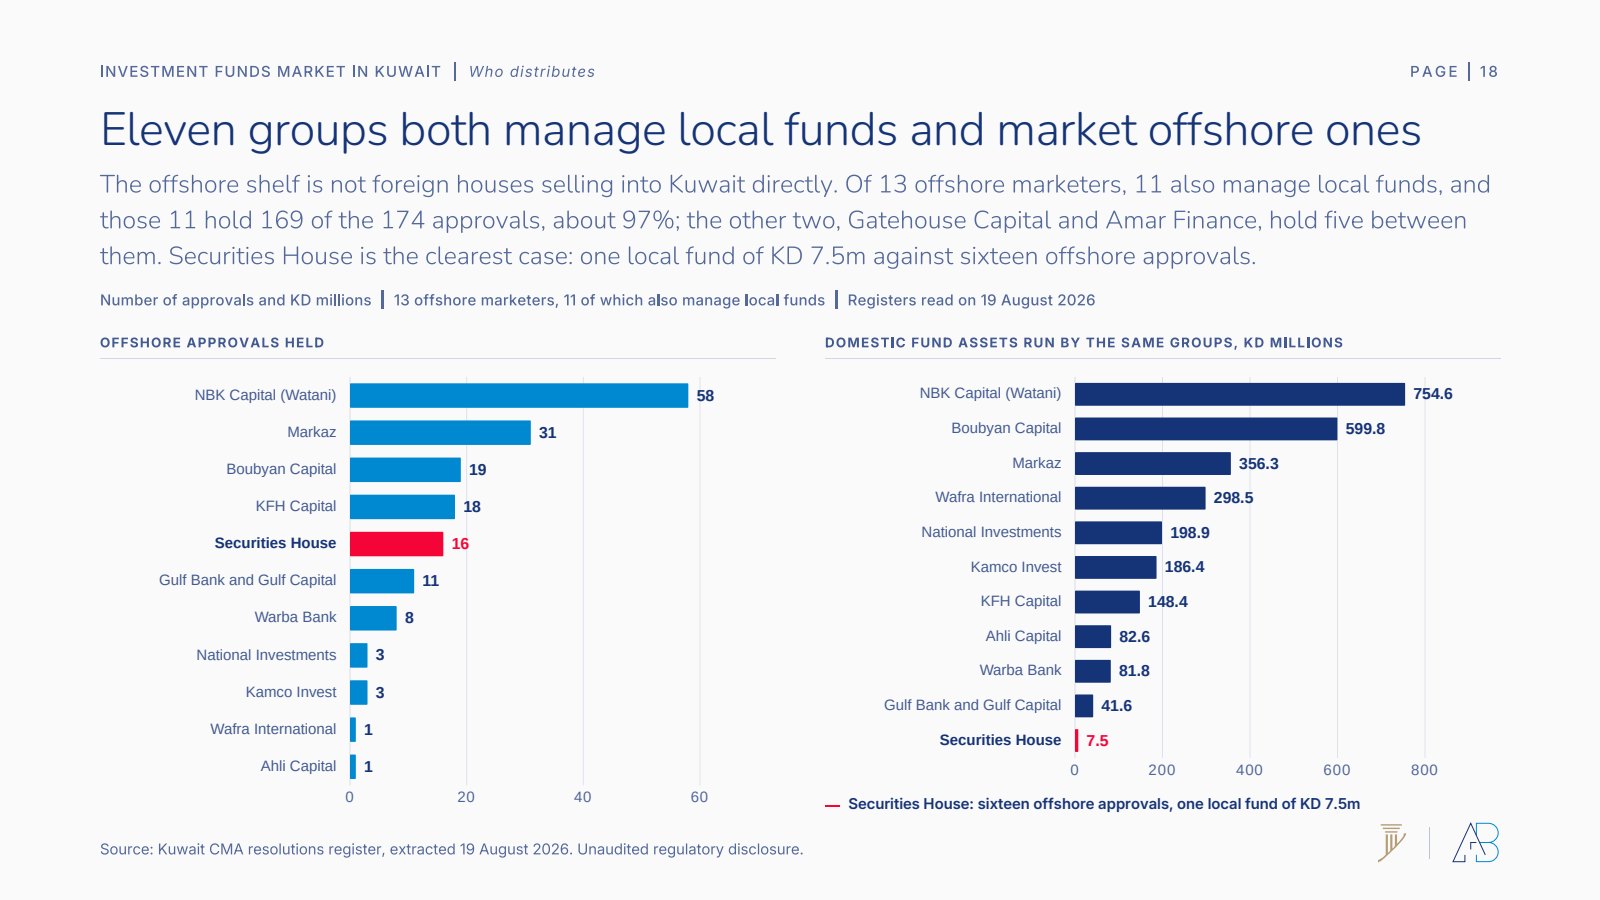
The offshore shelf is not foreign houses selling into Kuwait directly. Of 13 offshore marketers, 11 also manage local funds, and those 11 hold 169 of the 174 approvals, about 97%. The other two, Gatehouse Capital and Amar Finance, hold five between them. Securities House is the clearest case: one local fund of KD 7.5m against sixteen offshore approvals. The same groups work both routes, with very different products on each.
What it costs, and what nobody publishes
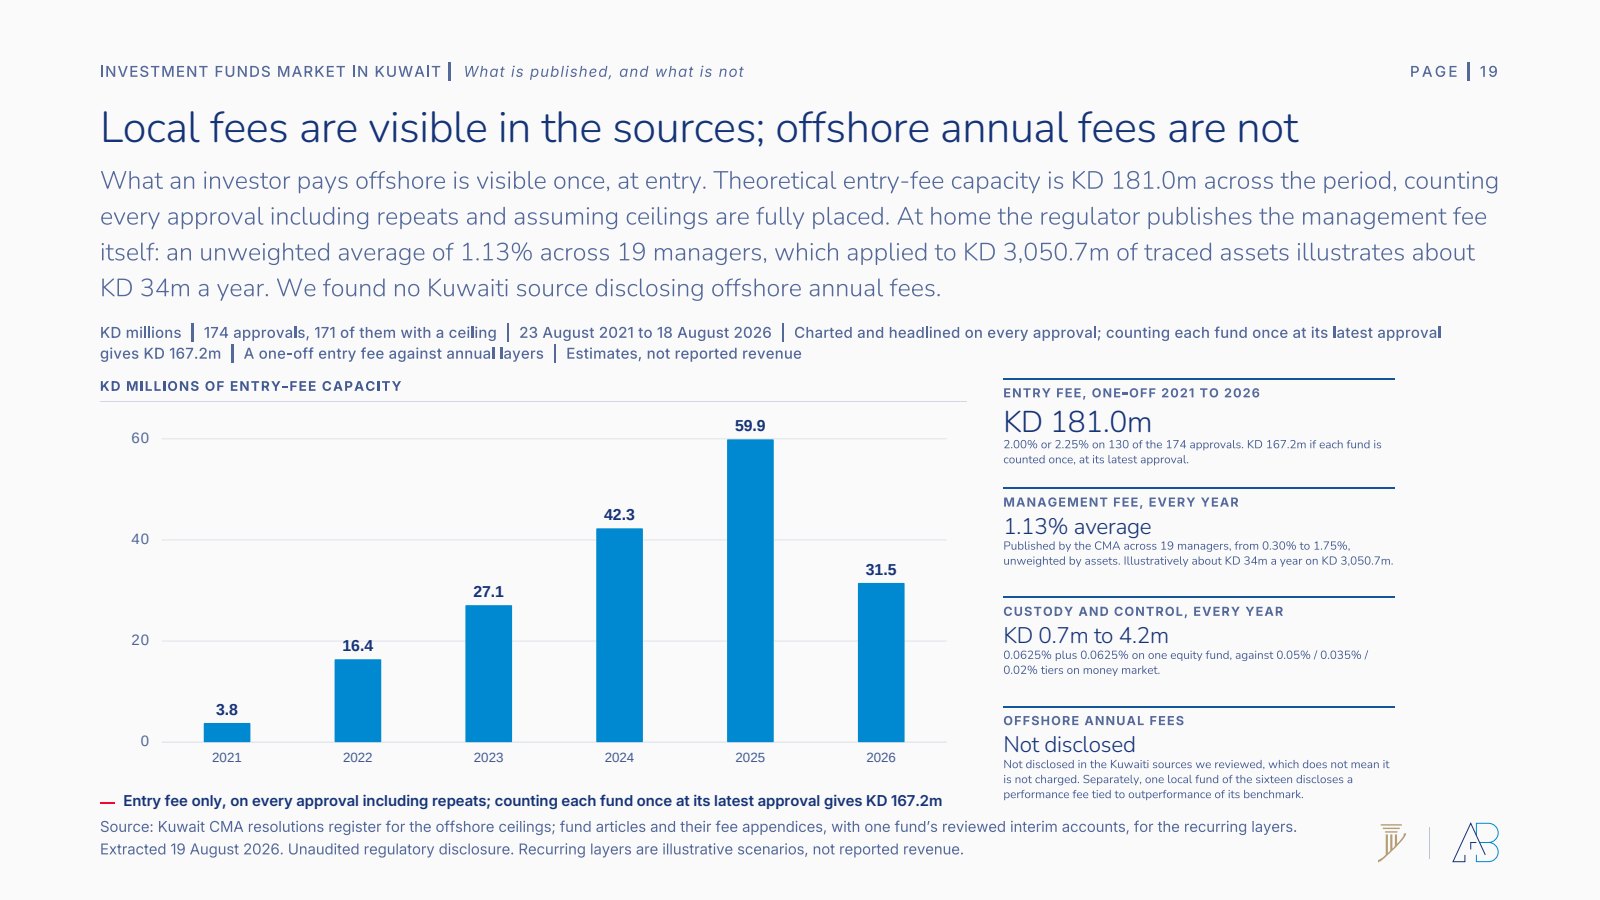
Offshore, what an investor pays is visible once, at entry. Theoretical entry-fee capacity is KD 181.0m across the whole period, counting every approval including repeats and assuming ceilings are fully placed. Count each fund once at its latest approval and it is KD 167.2m. The rate clusters hard: 2.00% or 2.25% on 130 of the 174 approvals.
At home the regulator publishes the management fee itself, an unweighted average of 1.13% across 19 managers, ranging from 0.30% to 1.75%. Applied to KD 3,050.7m of traced assets that illustrates about KD 34m a year. Custody and control adds KD 0.7m to 4.2m. On offshore annual fees we found no Kuwaiti source at all, which does not mean none is charged. This is the same disclosure problem we wrote about in Clarity Is the Product.
Most managed money is not in a fund
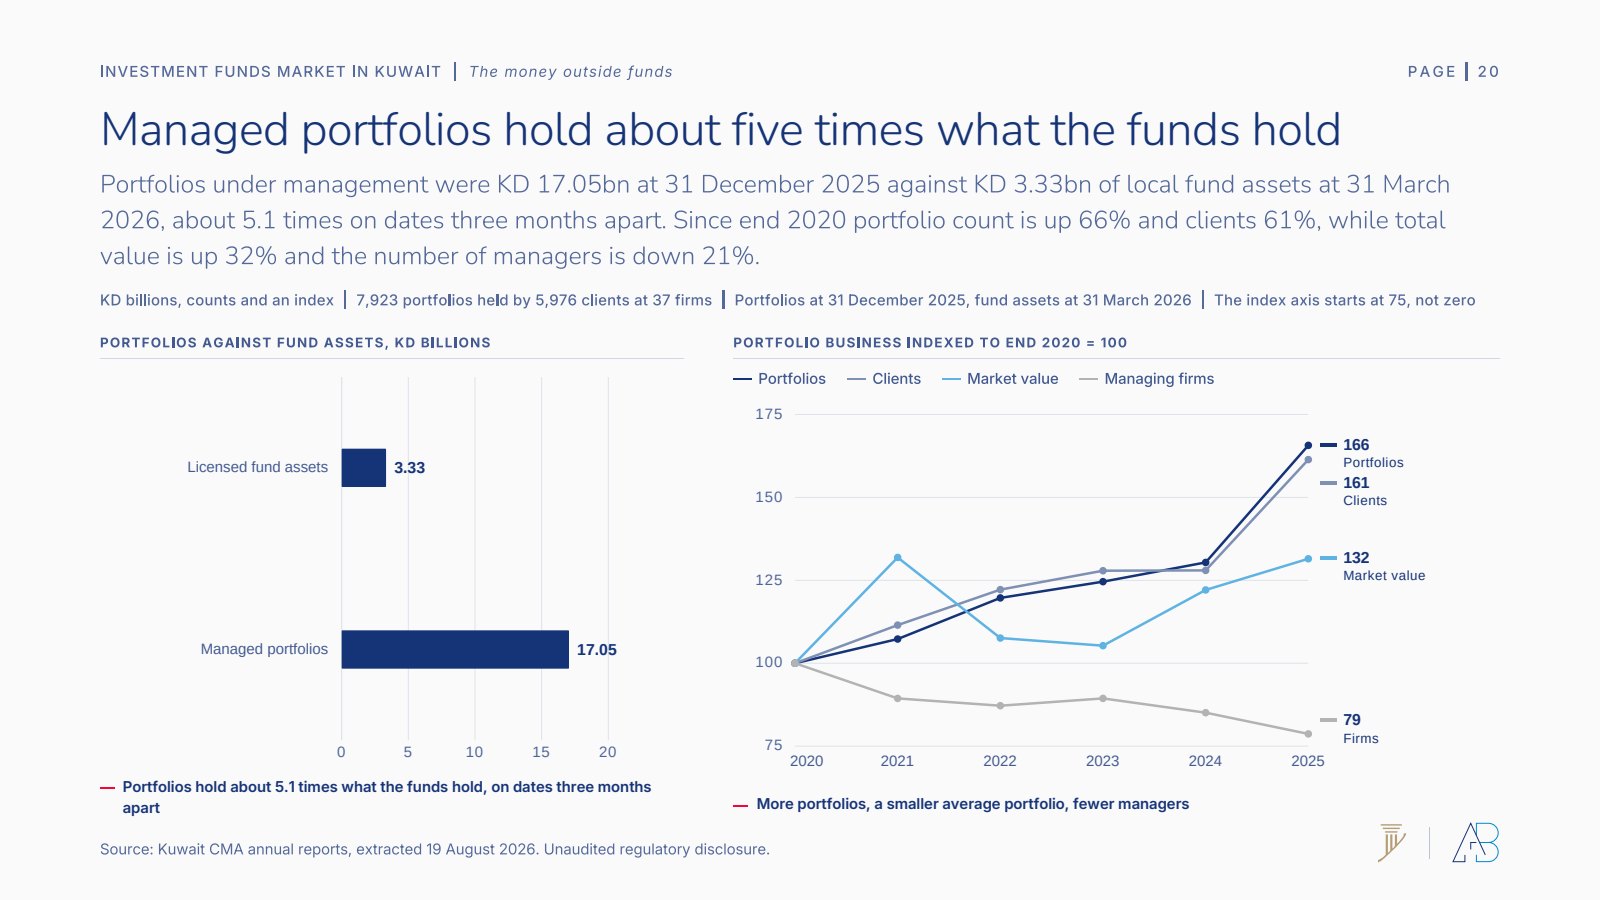
Portfolios under management were KD 17.05bn at 31 December 2025 against KD 3.33bn of local fund assets at 31 March 2026, about 5.1 times, on dates three months apart. Since end 2020 the portfolio count is up 66% and clients 61%, while total value is up only 32% and the number of managing firms is down 21%. More accounts, smaller average ticket, fewer firms. The CMA publishes no portfolio-level holdings, fee or performance data.
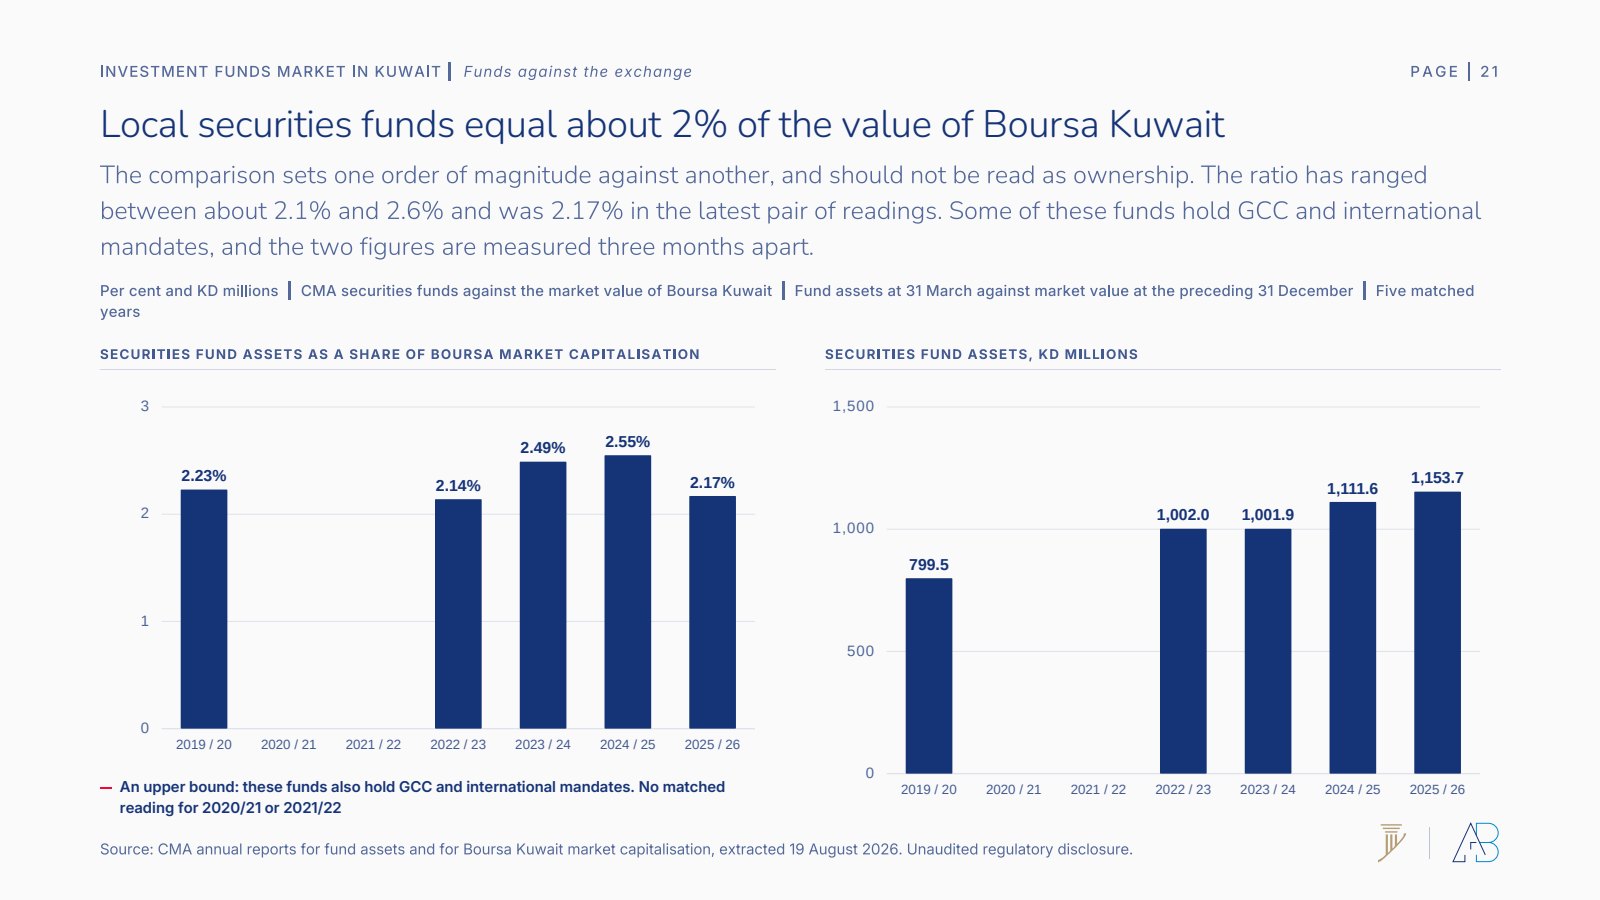
For scale against the exchange, local securities funds equal about 2% of the market value of Boursa Kuwait. The ratio has ranged between roughly 2.1% and 2.6% and was 2.17% in the latest matched pair. Read it as an order of magnitude, not as ownership: some of these funds hold GCC and international mandates, and the two figures are measured three months apart. We looked at the listing side of that market in IPOs and Boursa Kuwait.
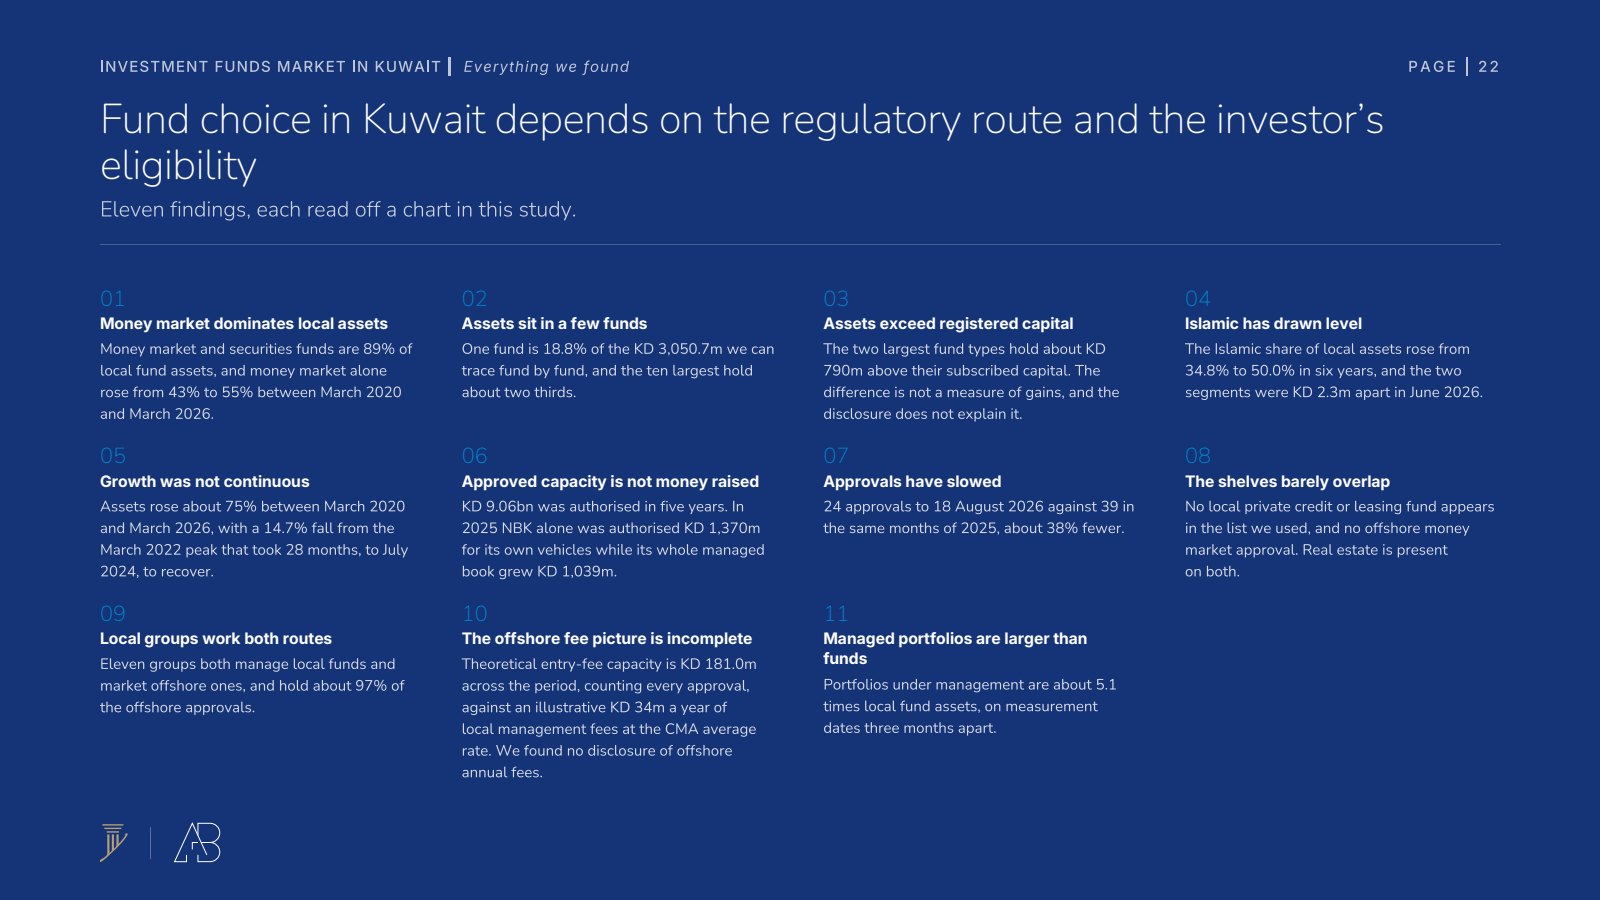
Eleven findings
Every finding in the study is read off a chart in it. Fund choice in Kuwait depends on the regulatory route and on the investor’s eligibility, and those two things explain more than any product comparison does.
The databank
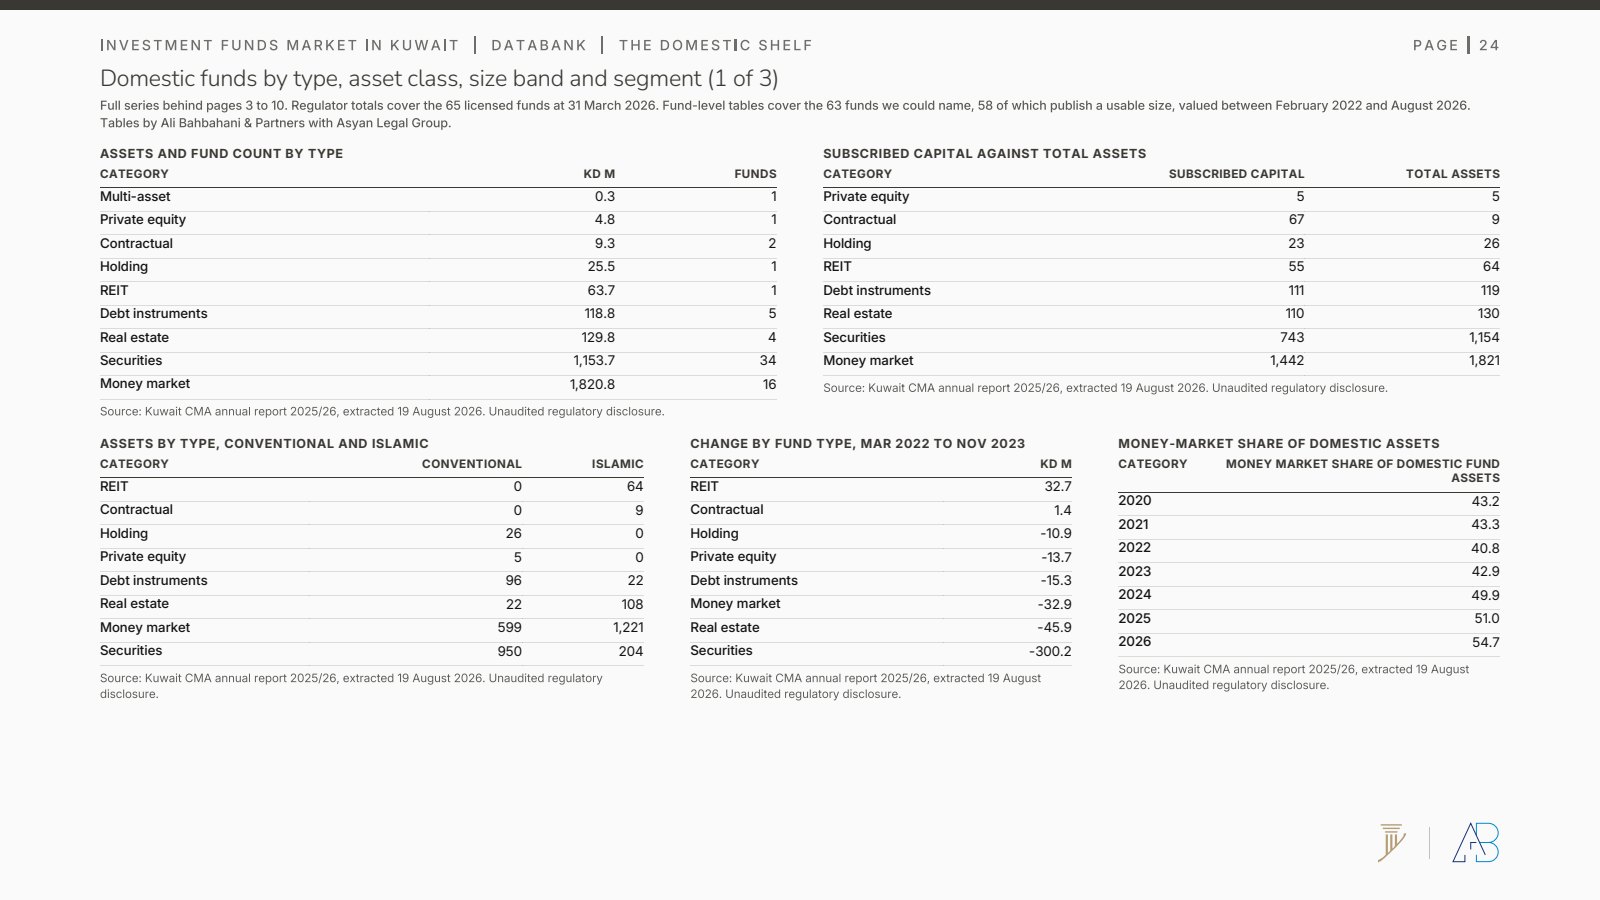
Seven pages of tables sit behind the charts so anyone can check the work. Three cover the local shelf: assets and fund count by type, subscribed capital against total assets, the conventional and Islamic split, the money-market series by year, the twelve largest declared asset classes, size bands, and the ten largest funds. One caveat is printed rather than smoothed over: the yearly series gives KD 1,823.3m of money market assets for 2026 against KD 1,820.8m in the category table at the same date. The two disclosures differ, so both are shown.
Four cover the offshore shelf: approvals per family, how often each family is re-issued, what the repeat approvals actually do, the strategy shares, and the attributes nobody usually aggregates. Cayman takes 146 of the 174 approvals, with Guernsey at 11 and Luxembourg at 5. Pricing is fixed for 147 and at NAV for 22. The mean ceiling in 2026 is KD 77.7m against a median of KD 47.8m, which is what two large transactions do to an average. And the regulator itself discloses three different offshore totals, 245, 246 and 247, on different bases. They are reproduced as disclosed rather than reconciled to the 174 approvals read here.
How to read any of this
Three habits survive the whole study. Ask who is eligible to buy a product before you ask whether it is any good, because in Kuwait eligibility decides the menu. Ask for the full annual cost, not the entry fee, because the entry fee is the layer that gets published. And treat an authorised ceiling as permission to raise money rather than money raised, because on the one case we can bound, capacity ran ahead of the growth of an entire managed book.
Every figure here is sourced and every conflict between sources is logged rather than averaged away. The same method sits behind our other data work, including what a car actually costs in Kuwait, the Kuwait watch market, sixteen years of Kuwait airport data and the lifetime cost of a Kuwaiti household. Where the record is silent, we say so rather than filling the gap.
Sources: Kuwait Capital Markets Authority resolutions register, annual reports and statistical bulletin, extracted 19 August 2026; fund articles and fee appendices published by managers and Boursa Kuwait; thirteen sets of audited group accounts. Unaudited regulatory disclosure. Regulated in Kuwait as collective investment schemes under Law No. 7 of 2010 and Book Thirteen of its Executive Bylaws. Published by Ali Bahbahani & Partners with Asyan Legal Group, September 2026.