Gold vs Wheat: The Great Commodity Paradox
.webp)
A simple question
Gold crossed $4,000 an ounce in October 2025 and I kept asking myself one thing. Why gold?
I don't mean why the price was rising. Fear of inflation and a nervous world explain that well enough. I mean why central banks store their wealth in a metal that sits in a vault. Oil is traded every hour and every economy needs it. Wheat keeps people alive. Neither one is a reserve asset.
So I pulled 126 years of prices for five commodities and compared them. The answer says less about gold than about what happened to money in 1971, and it says something reassuring about food.
The numbers since 1970
Taking the 1970 annual average as the starting point and the 12 months to August 2026 as the end:
- Gold went from $36 to $4,398 an ounce. It is 122 times its 1970 price.
- US crude oil went from $3.18 to $74.93 a barrel, 23.6 times.
- Copper went from $0.64 to $5.66 a pound, 8.8 times.
- Arabica coffee went from $0.52 to $3.58 a pound, 6.8 times.
- US hard red winter wheat went from $1.49 to $7.37 a bushel, 4.9 times.
The metal nobody eats rose 25 times more than the grain that feeds billions.
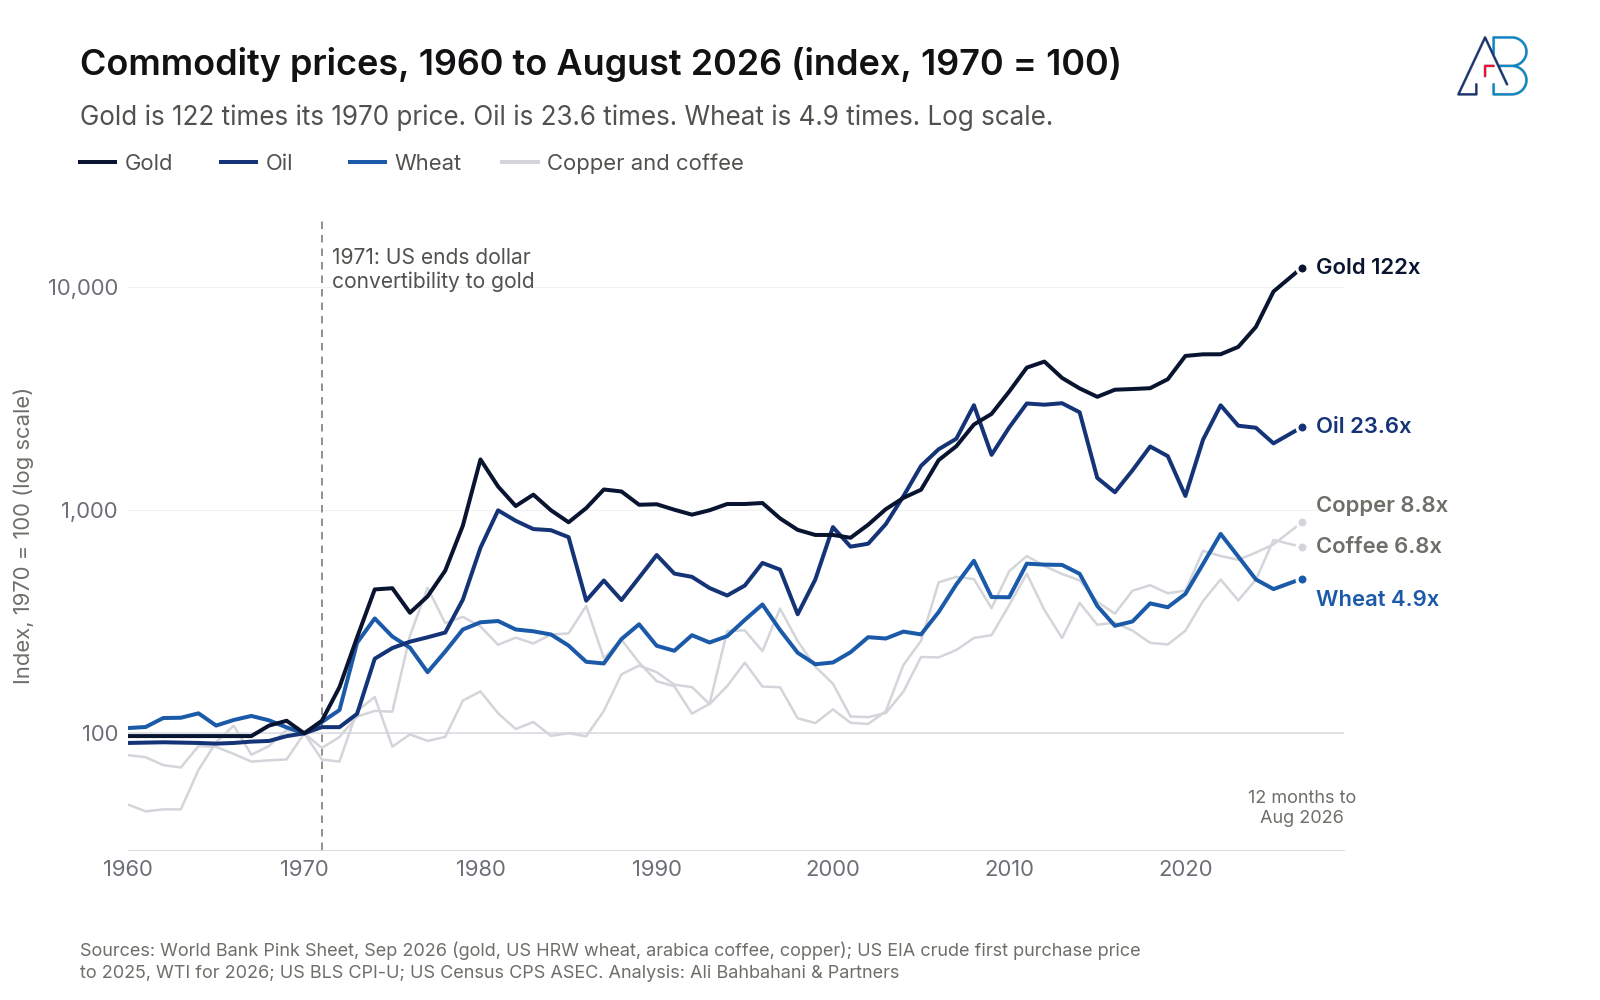
Through the 1960s gold barely moves in Figure 1, because it couldn't: the US government fixed it. After 1971 every line climbs, and gold climbs fastest.
What inflation hides
Those are nominal prices, and that framing flatters every commodity. US consumer prices rose 8.49 times over the same period, according to the Bureau of Labor Statistics. A dollar in 1970 bought what $8.49 buys today.
Take inflation out and the picture changes.
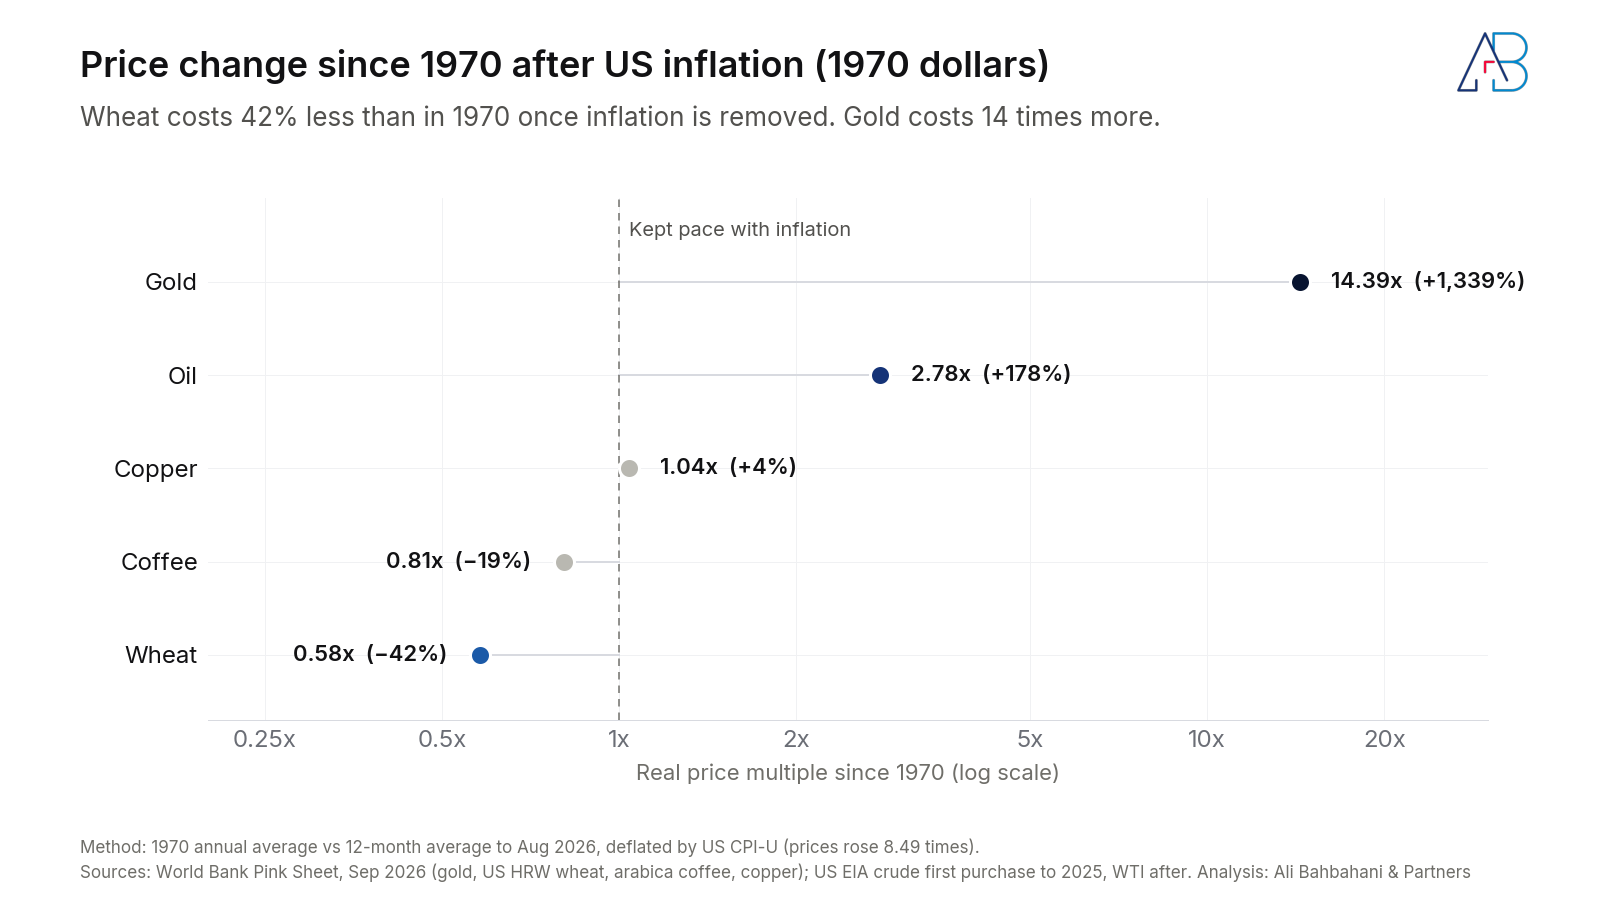
Wheat is 42% cheaper in real terms than it was in 1970. Coffee is 19% cheaper, even after the record prices of 2025. Copper has almost exactly matched inflation. Oil costs close to three times as much.
Gold costs 14 times as much.
So my original question was slightly wrong. Wheat didn't lag. It fell, while gold rose faster than anything else in the set.
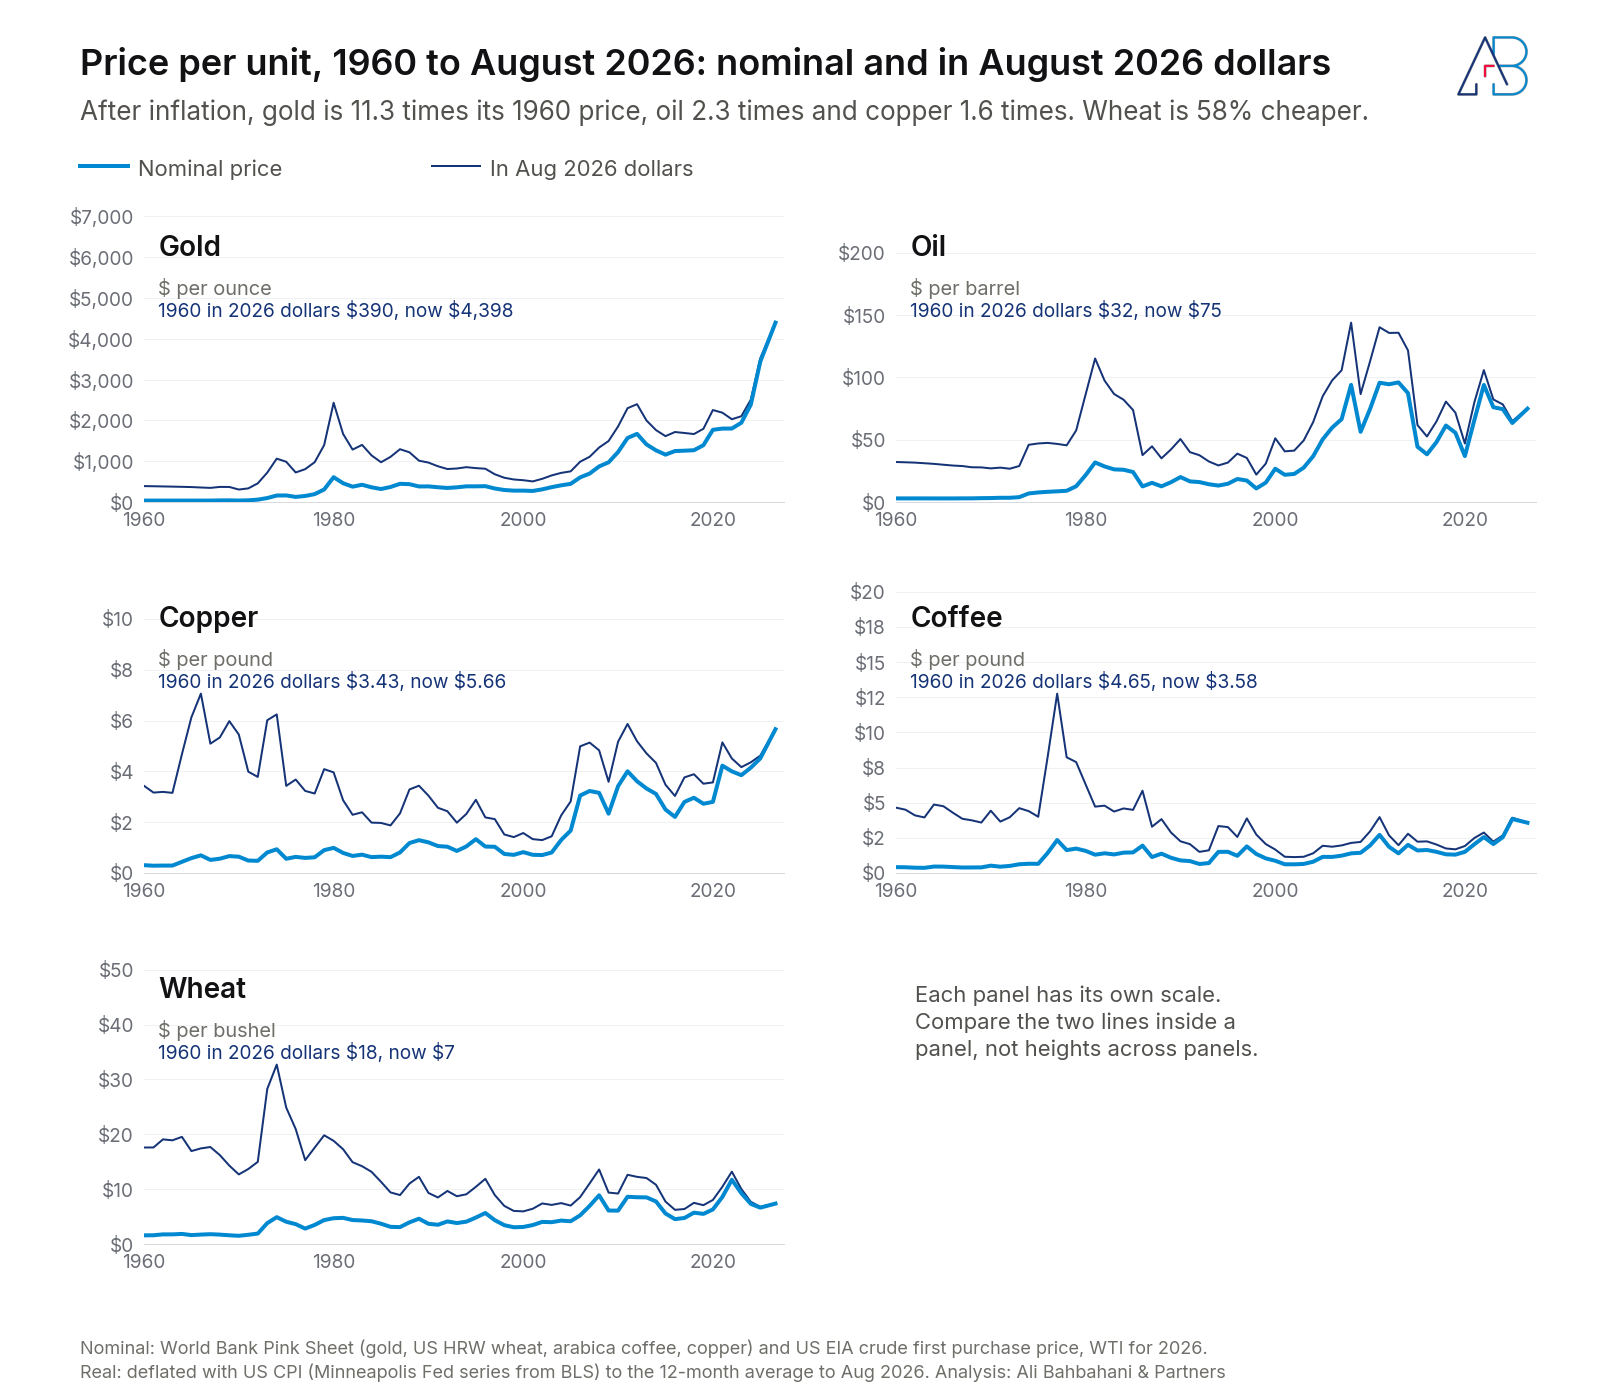
Figure 3 shows the same comparison year by year from 1960. Each panel has two lines: the price people paid at the time, and that price converted into today's dollars. In gold's panel the two lines meet at the right edge far above where either started. In wheat's panel the real line falls for most of six decades. A bushel that cost $17.58 in today's money in 1960 now costs $7.37.
The longer view: 1900 to 2026
Fifty-six years is a short window for commodities, and 1970 was an unusual starting point for gold, because its price had been frozen for 36 years. So I went back further.
The economist David Jacks has built real price series for more than 40 commodities back to 1850, adjusted for US inflation. I used his data from 1900 to 2020 and extended it to August 2026 with the World Bank, EIA and BLS figures used elsewhere in this article.
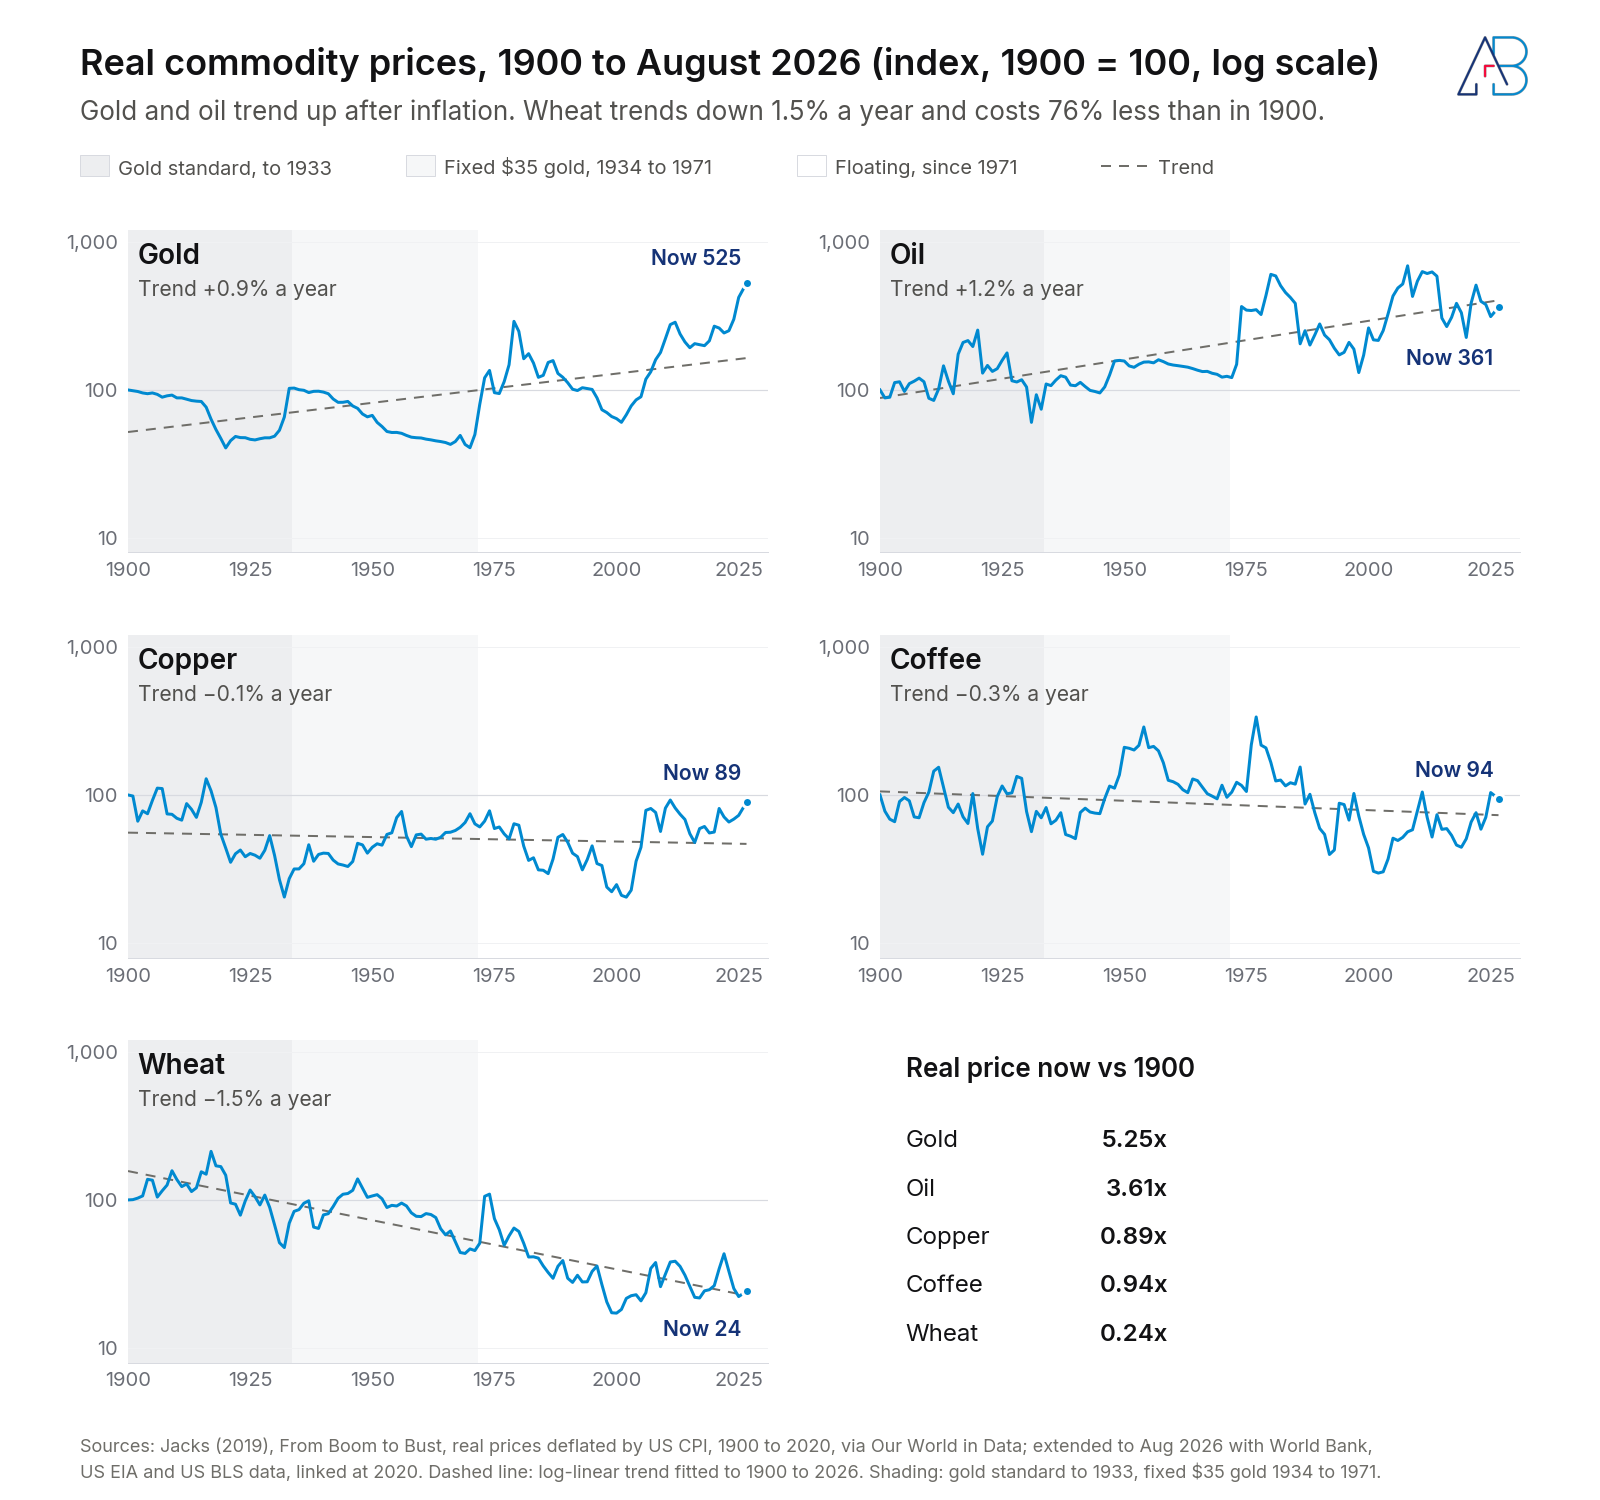
Measured from 1900, in real terms:
- Gold costs 5.25 times as much.
- Oil costs 3.61 times as much.
- Coffee and copper cost slightly less, at 0.94 and 0.89 times.
- Wheat costs 0.24 times as much. That is 76% cheaper.
The dashed lines in Figure 4 are long-run trends. Wheat's real price has fallen by an average of 1.5% a year for 126 years. Oil's has risen 1.2% a year and gold's 0.9%. Coffee and copper have been close to flat, with long swings above and below the line.
Figure 4 also changes the gold story. Between 1934 and 1970 the price was fixed at $35 while US prices nearly tripled, so gold's real value fell by 60% to 65%, depending on the price index. Some of the jump after 1971 was the market catching up with decades of inflation. By 1974 gold's real price had passed its 1934 level.
That explains the 1970s. It doesn't explain today. Gold's real price is now more than double its 1980 peak and nearly double its 2011 peak.
Before 1960
Was 1900 to 1970 really stable?
The original article said commodity prices were "remarkably stable" under the gold standard and Bretton Woods. The data only supports that for gold, whose price was set by law.
Wheat's real price rose 76% between 1914 and 1917 as the First World War cut European supply, then fell by more than two thirds by 1932. Coffee and copper swung just as hard. I measured the average size of a year's real price move in each period.
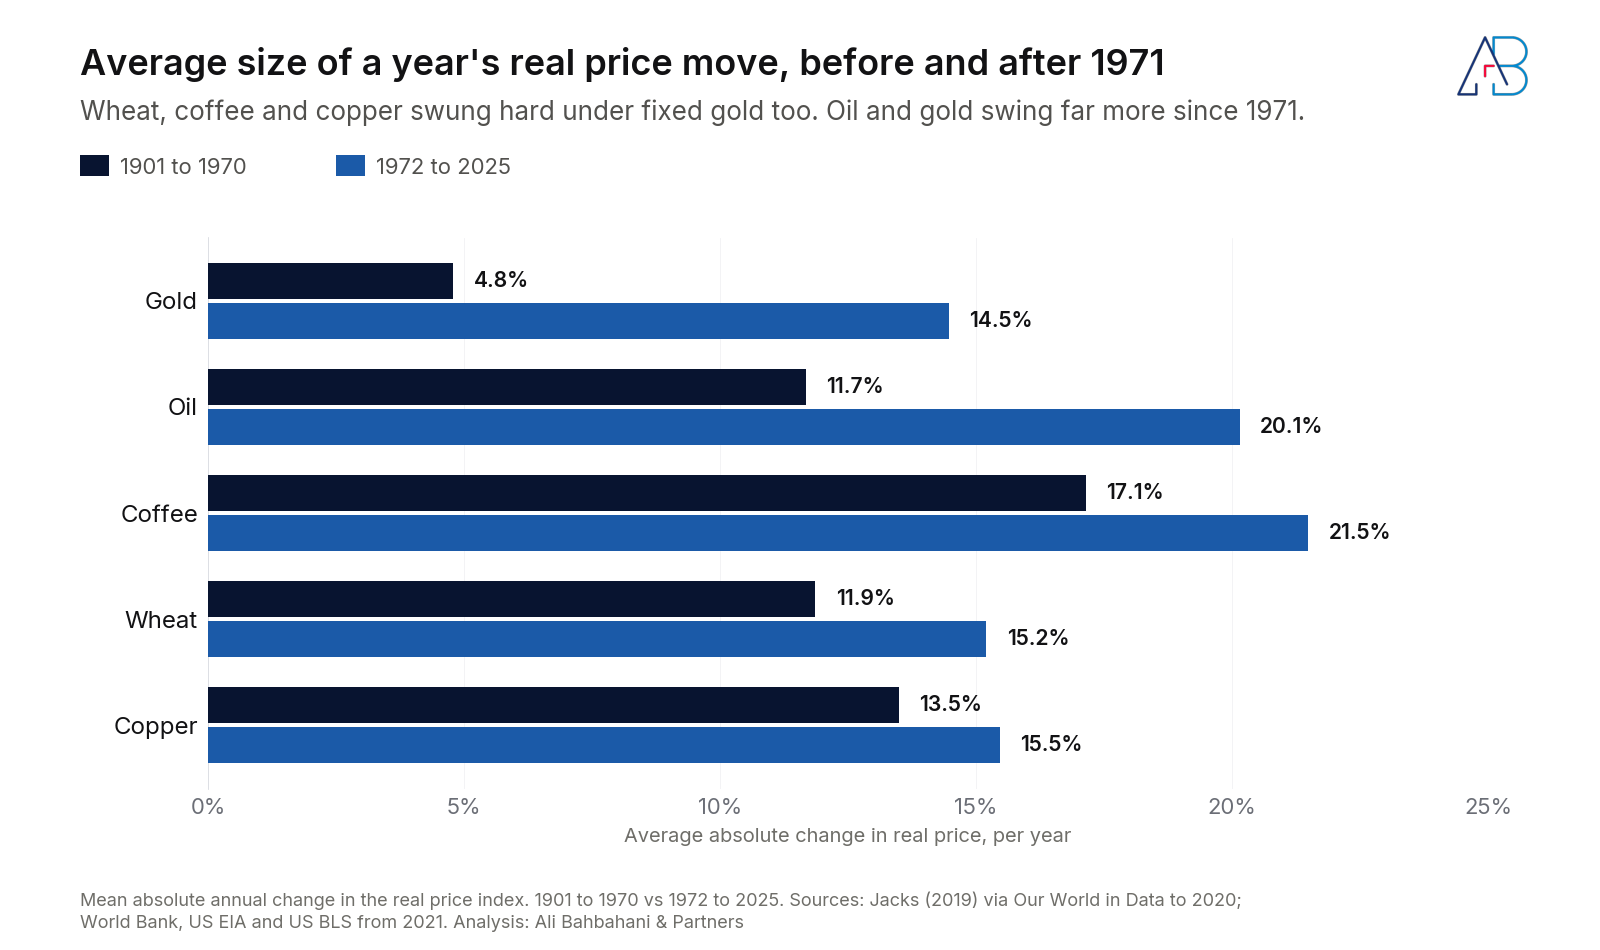
Before 1971, wheat's real price moved by an average of 11.9% a year. After 1971 the figure is 15.2%. That is a real increase, but a modest one. Oil went from 11.7% to 20.1%, and gold from 4.8% to 14.5%.
After 1971, the two commodities tied most closely to money and geopolitics became far more volatile. The rest changed less than the original article claimed.
1934, 1971 and the price of an ounce
The US fixed gold at $20.67 an ounce from 1834. The Gold Reserve Act of 1934 raised it to $35, and under the Bretton Woods system after 1944 other currencies were pegged to the dollar, which was pegged to gold.
The peg started to crack in the 1960s. The London Gold Pool, which central banks used to hold the market price near $35, collapsed in March 1968. Private buyers pushed the free-market price to $41 by 1969 (World Bank data).
On August 15, 1971, President Nixon suspended the conversion of dollars into gold. From then on nothing tied the dollar to a physical asset. The US could issue currency without holding gold against it, and the dollar kept its place as the world's reserve currency on the strength of the US economy and its financial markets.
What happened next is the circular part. Gold became valuable as insurance against the currencies it used to back. When confidence in money falls, people buy gold, and its price rises.
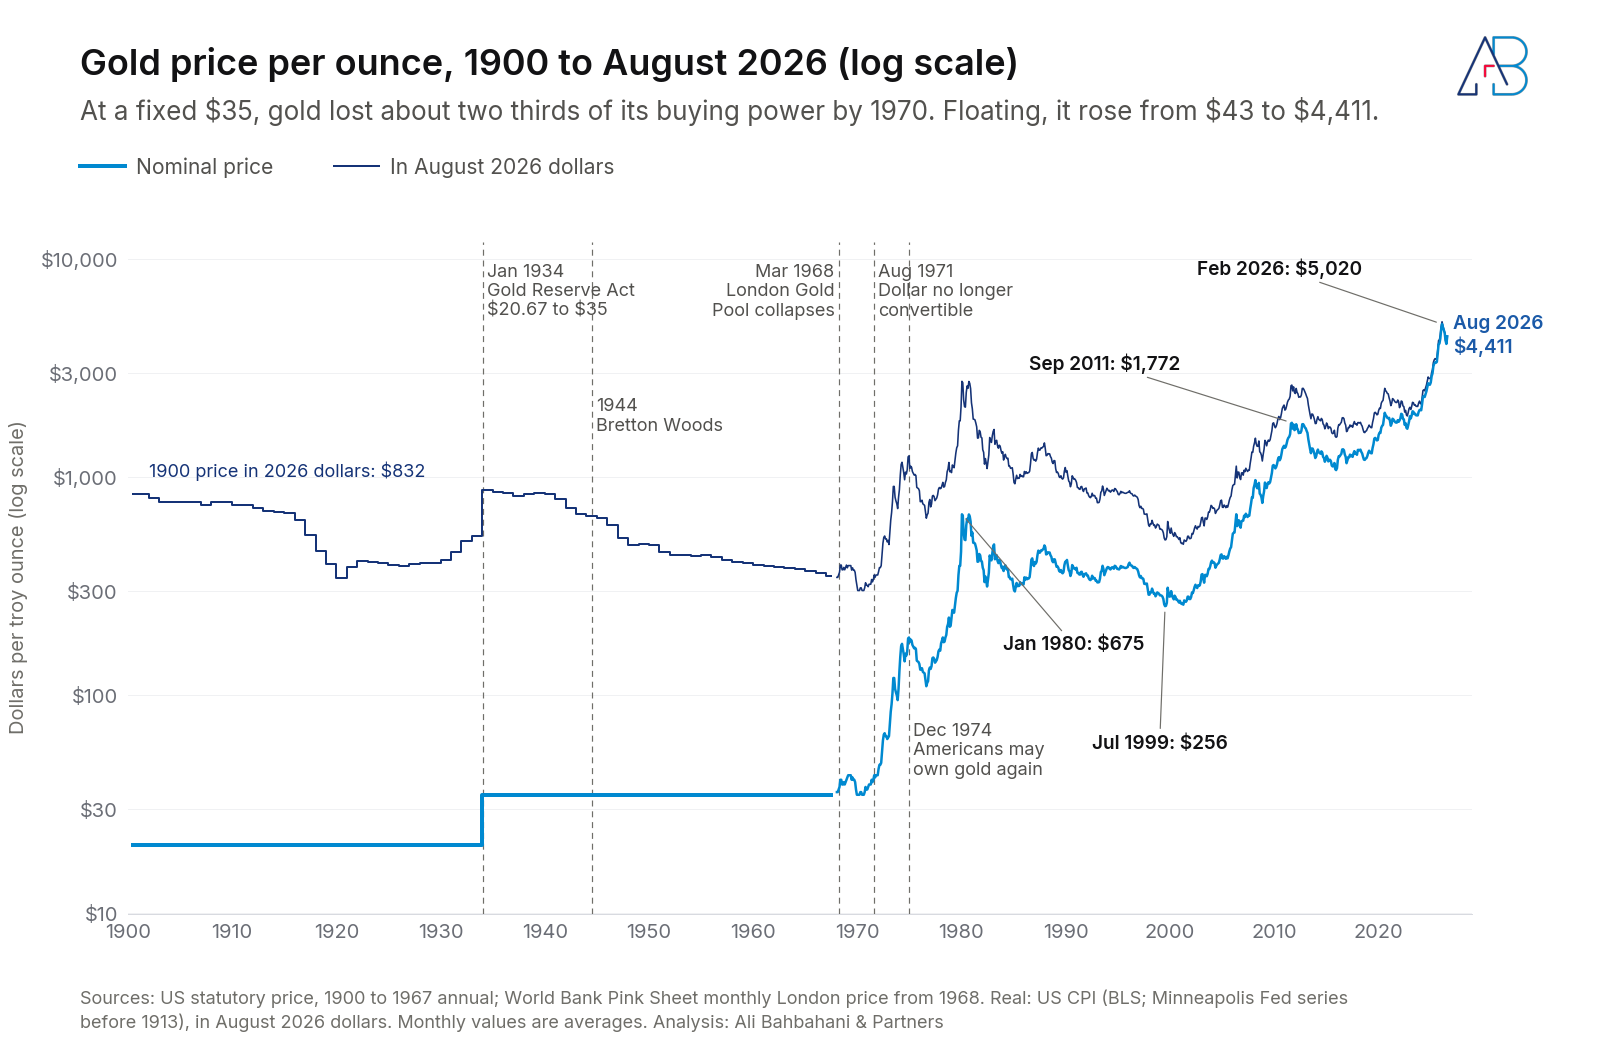
Figure 7 puts the whole story on one line. The 1934 revaluation raised the price by 69% overnight. Then nothing moved for 34 years while inflation ate away at what $35 could buy. In 1971 the monthly average was $43. Americans were allowed to own gold bullion again from December 31, 1974, and by January 1980 the price averaged $675.
Floating gold has not climbed in a straight line. It lost 62% between January 1980 and July 1999. It rose to $1,772 in September 2011, fell back, and reached a monthly average of $5,020 in February 2026. In August it was $4,411.
Fifteen years that reset prices
Monthly data shows how fast it happened.
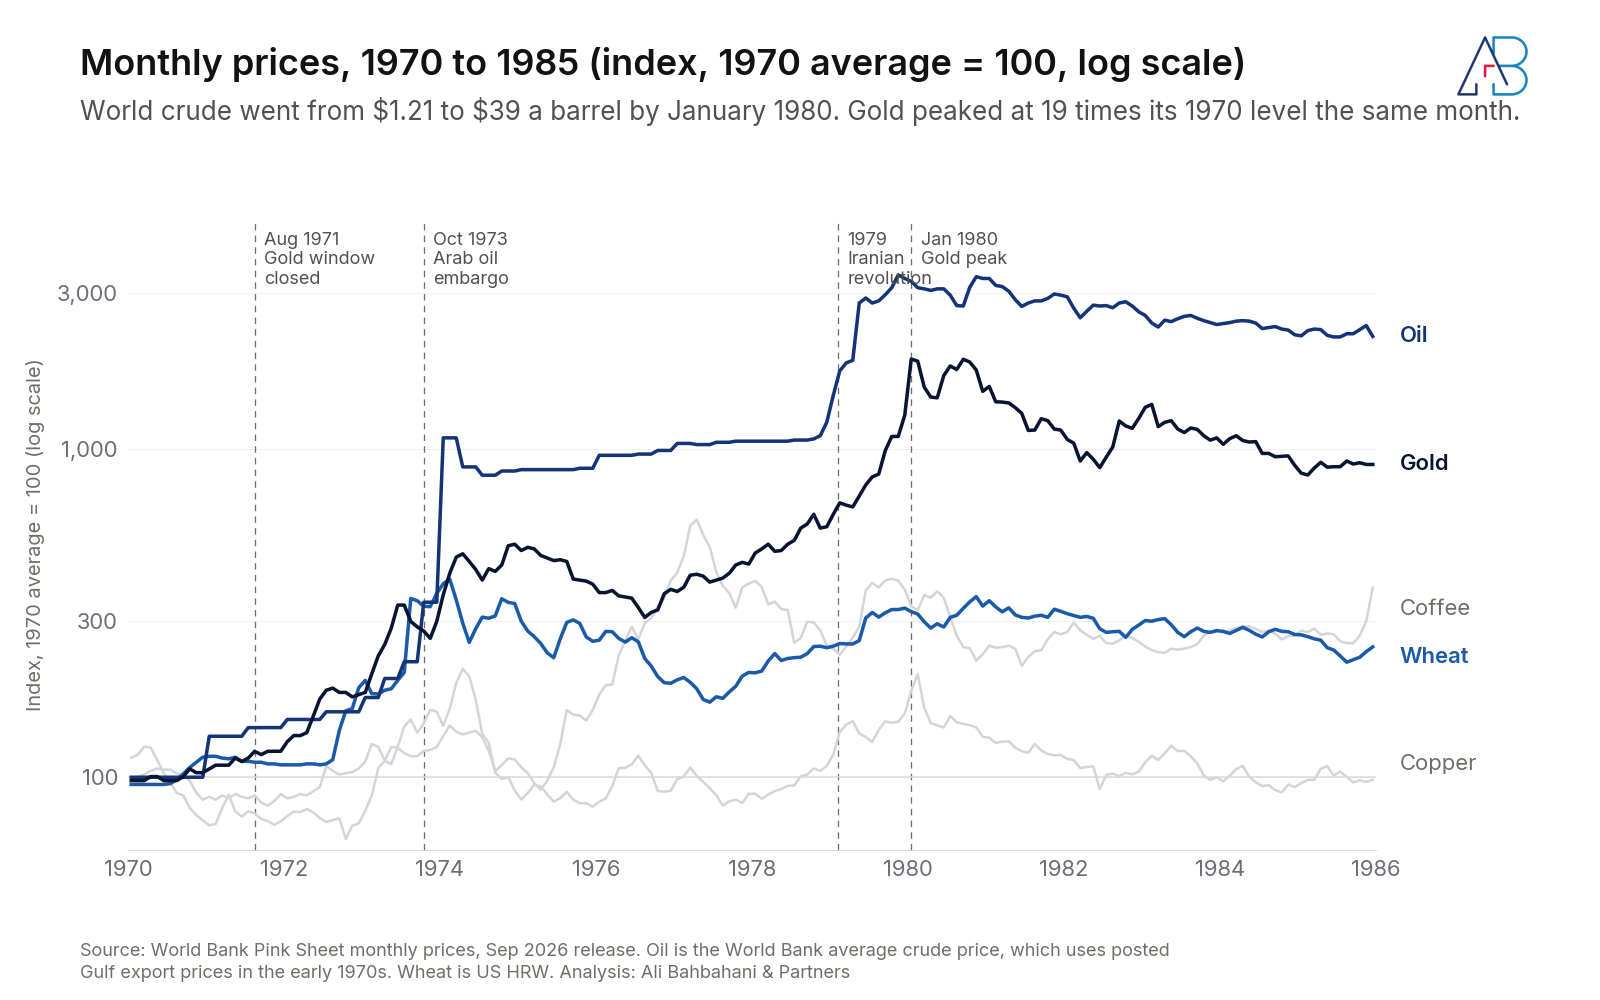
In January 1970 gold averaged $35 an ounce. In January 1980 it averaged $675. By June 1982 it was back at $315, and it ended 1985 at $322.
The World Bank's average world crude price was $1.20 a barrel in January 1970 and peaked at $40.80 in November 1979. US wheat peaked earlier, in February 1974, at about $6.00 a bushel, four times its January 1970 level, then settled back.
Gold and oil were reset to a new level in that decade and never went back. Wheat spiked and returned toward its old path, as it had after 1917.
What one salary buys
Prices are abstract. A household budget isn't. I divided the US median household income for each year by that year's average price.
In 1970 the median household earned $8,734 (US Census Bureau). That bought 5,846 bushels of wheat, 2,747 barrels of US crude, or 243 ounces of gold. In 2025 the median household earned $87,460. That bought 13,207 bushels of wheat, 1,379 barrels of oil, or 25 ounces of gold.
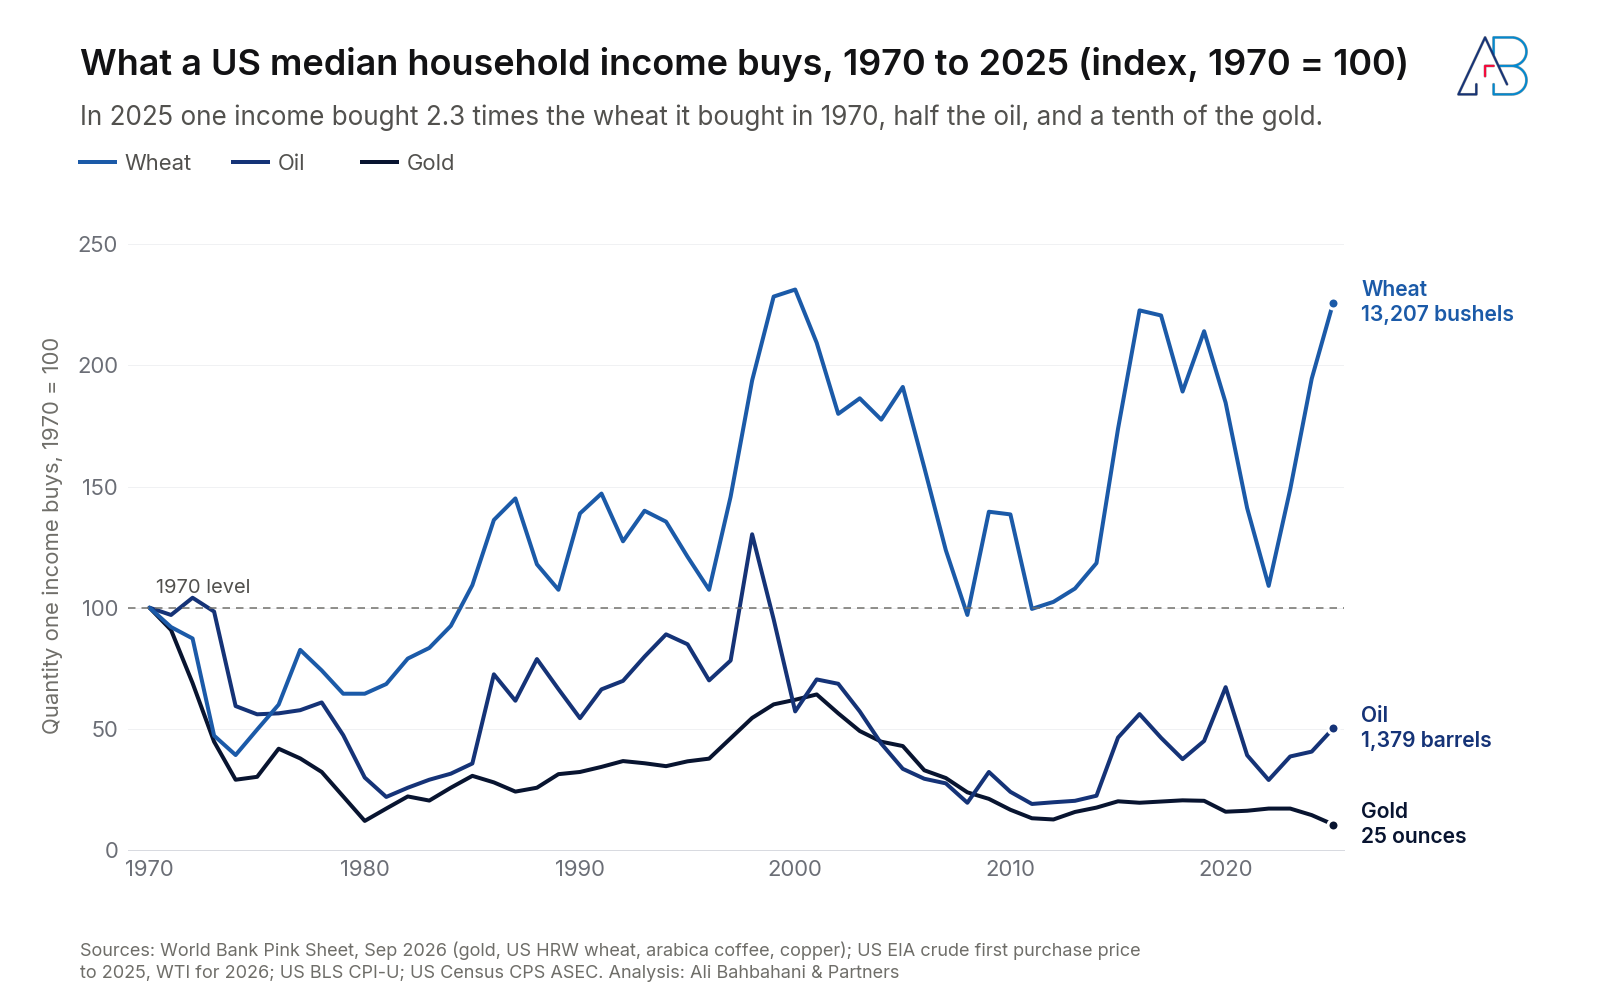
One income now buys 2.3 times the wheat it bought in 1970, half the oil and a tenth of the gold.
The path was uneven. Wheat affordability dropped by half between 2020 and 2022, when war in Ukraine pushed US wheat to an average of $11.70 a bushel. And 2025 was a cheap year for wheat, which makes the latest point look better than the trend. Wheat has been rising again in 2026 and averaged $8.98 a bushel in August.
Why gold, and not oil or wheat
If a country wants to store value, why not store the thing everyone needs?
Because being needed is a weakness in a store of value. Wheat rots and gets eaten. Oil degrades in storage and gets burned, so its price swings with every harvest, recession or shipping disruption. A reserve asset has to hold its value for decades while nobody touches it.
Gold does that. It doesn't corrode. An ounce in Kuwait is identical to an ounce in Zurich. A lot of value fits in a small space, and new mine supply adds only a small share each year to the stock that already exists above ground. It also has thousands of years of people in almost every culture agreeing that it is worth something.
Nobody's survival depends on gold, so its price isn't tied to weather, crops or refinery output. It moves on fear and on trust in paper money. That makes it volatile in its own way, as the fall from $608 in 1980 to $279 in 2000 shows. But its value doesn't get consumed.
Central banks behave as if they agree. According to the World Gold Council, they bought more than 1,000 tonnes a year in 2022, 2023 and 2024.
Why food stayed cheap
Wheat's 126-year decline is one of the best things humans did in the 20th century.
Machinery and new farmland raised output in the first half of the century. Then plant breeders led by Norman Borlaug developed short-stemmed, high-yield wheat that responded well to fertiliser and irrigation, and Borlaug received the Nobel Peace Prize in 1970. World wheat yields per hectare have roughly tripled since the early 1960s, according to FAO data, while the world's population more than doubled.
Supply kept up with demand, and thousands of farmers in dozens of countries competed to sell it. No single seller can hold the price of wheat.
Cheap wheat has a cost, though. Farmers work on thin margins. In the US and Europe many depend on subsidies, which make it harder for growers in poorer countries to compete.
Oil moves when supply routes break
Oil sits between the two. Everyone needs it, like wheat. Its price chart looks more like gold's.
The big jumps in oil prices line up with wars and blocked supply. Figure 10 marks them on 56 years of monthly prices.
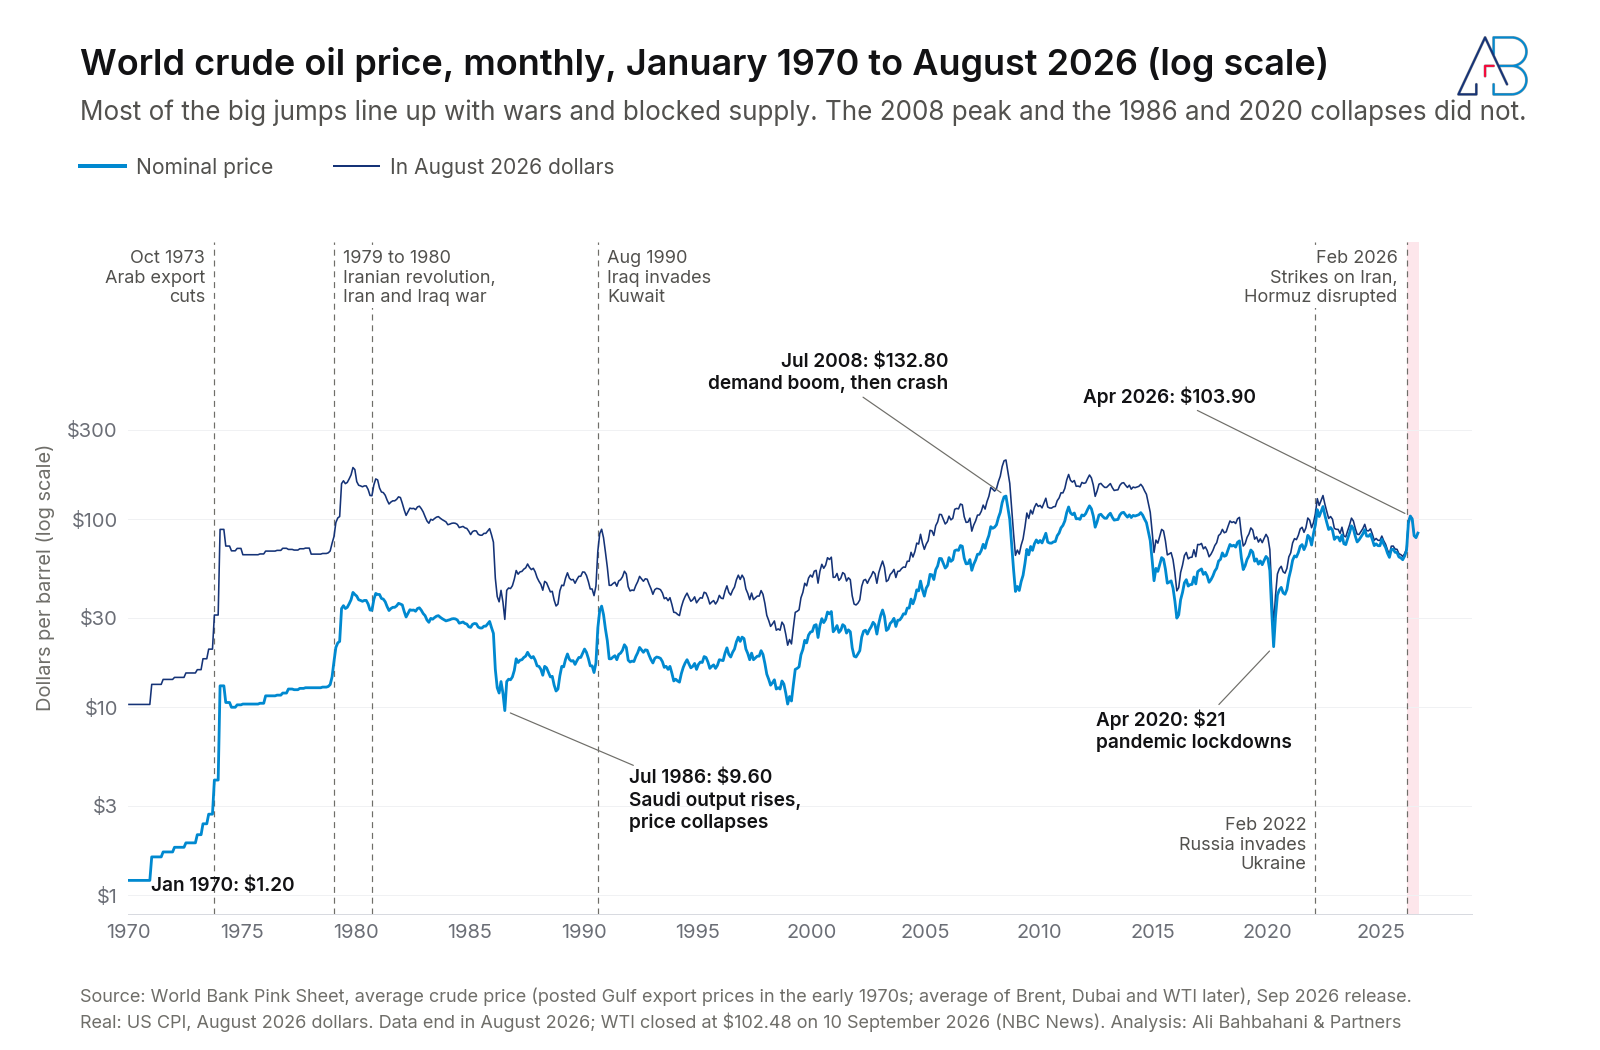
Arab producers cut exports after the October 1973 war, and the World Bank's average world crude price went from $2.70 a barrel in September 1973 to $13.00 in January 1974. The Iranian revolution and the start of the Iran and Iraq war took it to $40.80 in November 1979. Iraq's invasion of Kuwait on August 2, 1990, doubled it within three months, from $17.20 in July to $34.50 in October. Russia's invasion of Ukraine pushed it to $116.80 by June 2022.
Not every move fits that pattern, and the chart shows those too. The 1986 collapse to $9.60 came when Saudi Arabia raised output. The July 2008 peak of $132.80 came from a demand boom, and the crash that followed from the financial crisis. April 2020's $21 came from pandemic lockdowns.
2026 has added another supply shock. The war that began with US and Israeli strikes on Iran on February 28 stopped most tanker traffic through the Strait of Hormuz. Producers across the Gulf, including Kuwait, cut output because they couldn't ship it. The EIA reports that Brent crossed $100 on March 12, and the World Bank average reached $103.90 in April. On September 10 US crude closed at $102.48 a barrel, after the last month in this data.
For someone writing from Kuwait, this pattern needs no explanation. Oil wealth depends on getting barrels out through narrow waters. When those routes close, the price rises everywhere and the producers lose the volumes to sell into it. No country holds its reserves in something that depends on a shipping lane staying open.
One note on US figures. From 1971 to 1981 the US government controlled domestic crude prices, so US crude cost less than world crude through the 1970s. That is why US oil shows a smaller 1970s spike in Figure 1 than the world price in Figure 10.
What this means
I work on friction, mostly in customer experience, hospitality and real estate. This data shows friction at the scale of the world economy.
Where many producers compete and technology keeps raising output, prices fall in real terms for a very long time. Wheat is the proof, at 1.5% a year since 1900. Where supply passes through a few narrow routes, prices jump every time something breaks. Oil has done that five times in 56 years, though not every spike was a supply shock.
Gold follows a different logic. Its price tracks confidence in money.
Two consequences matter most to me.
Cheap food is not guaranteed. The abundance that made wheat 76% cheaper than in 1900 depends on stable weather, open trade and affordable fertiliser. 1917, 1974 and 2022 all showed how quickly that can reverse, and 2026 prices are rising again. For a country like Kuwait that imports most of its food, food security is a supply chain question before it is a price question. Energy shocks spread the same way; the 1970s stagflation and the 2022 inflation surge both had one behind them, and the GCC feels both sides of that trade.
Gold's rise widens the wealth gap. A household spending its whole income on essentials gains little from cheap wheat compared with a household that has savings to park in gold. Since 1970, the second household's hedge rose 14 times in real terms.
Nixon's decision worked for the dollar. It is still the world's reserve currency 55 years later. The side effect is that a metal which does nothing costs 122 times its 1970 price, while a bushel of wheat costs less, in real terms, than it did when he signed.
Key years
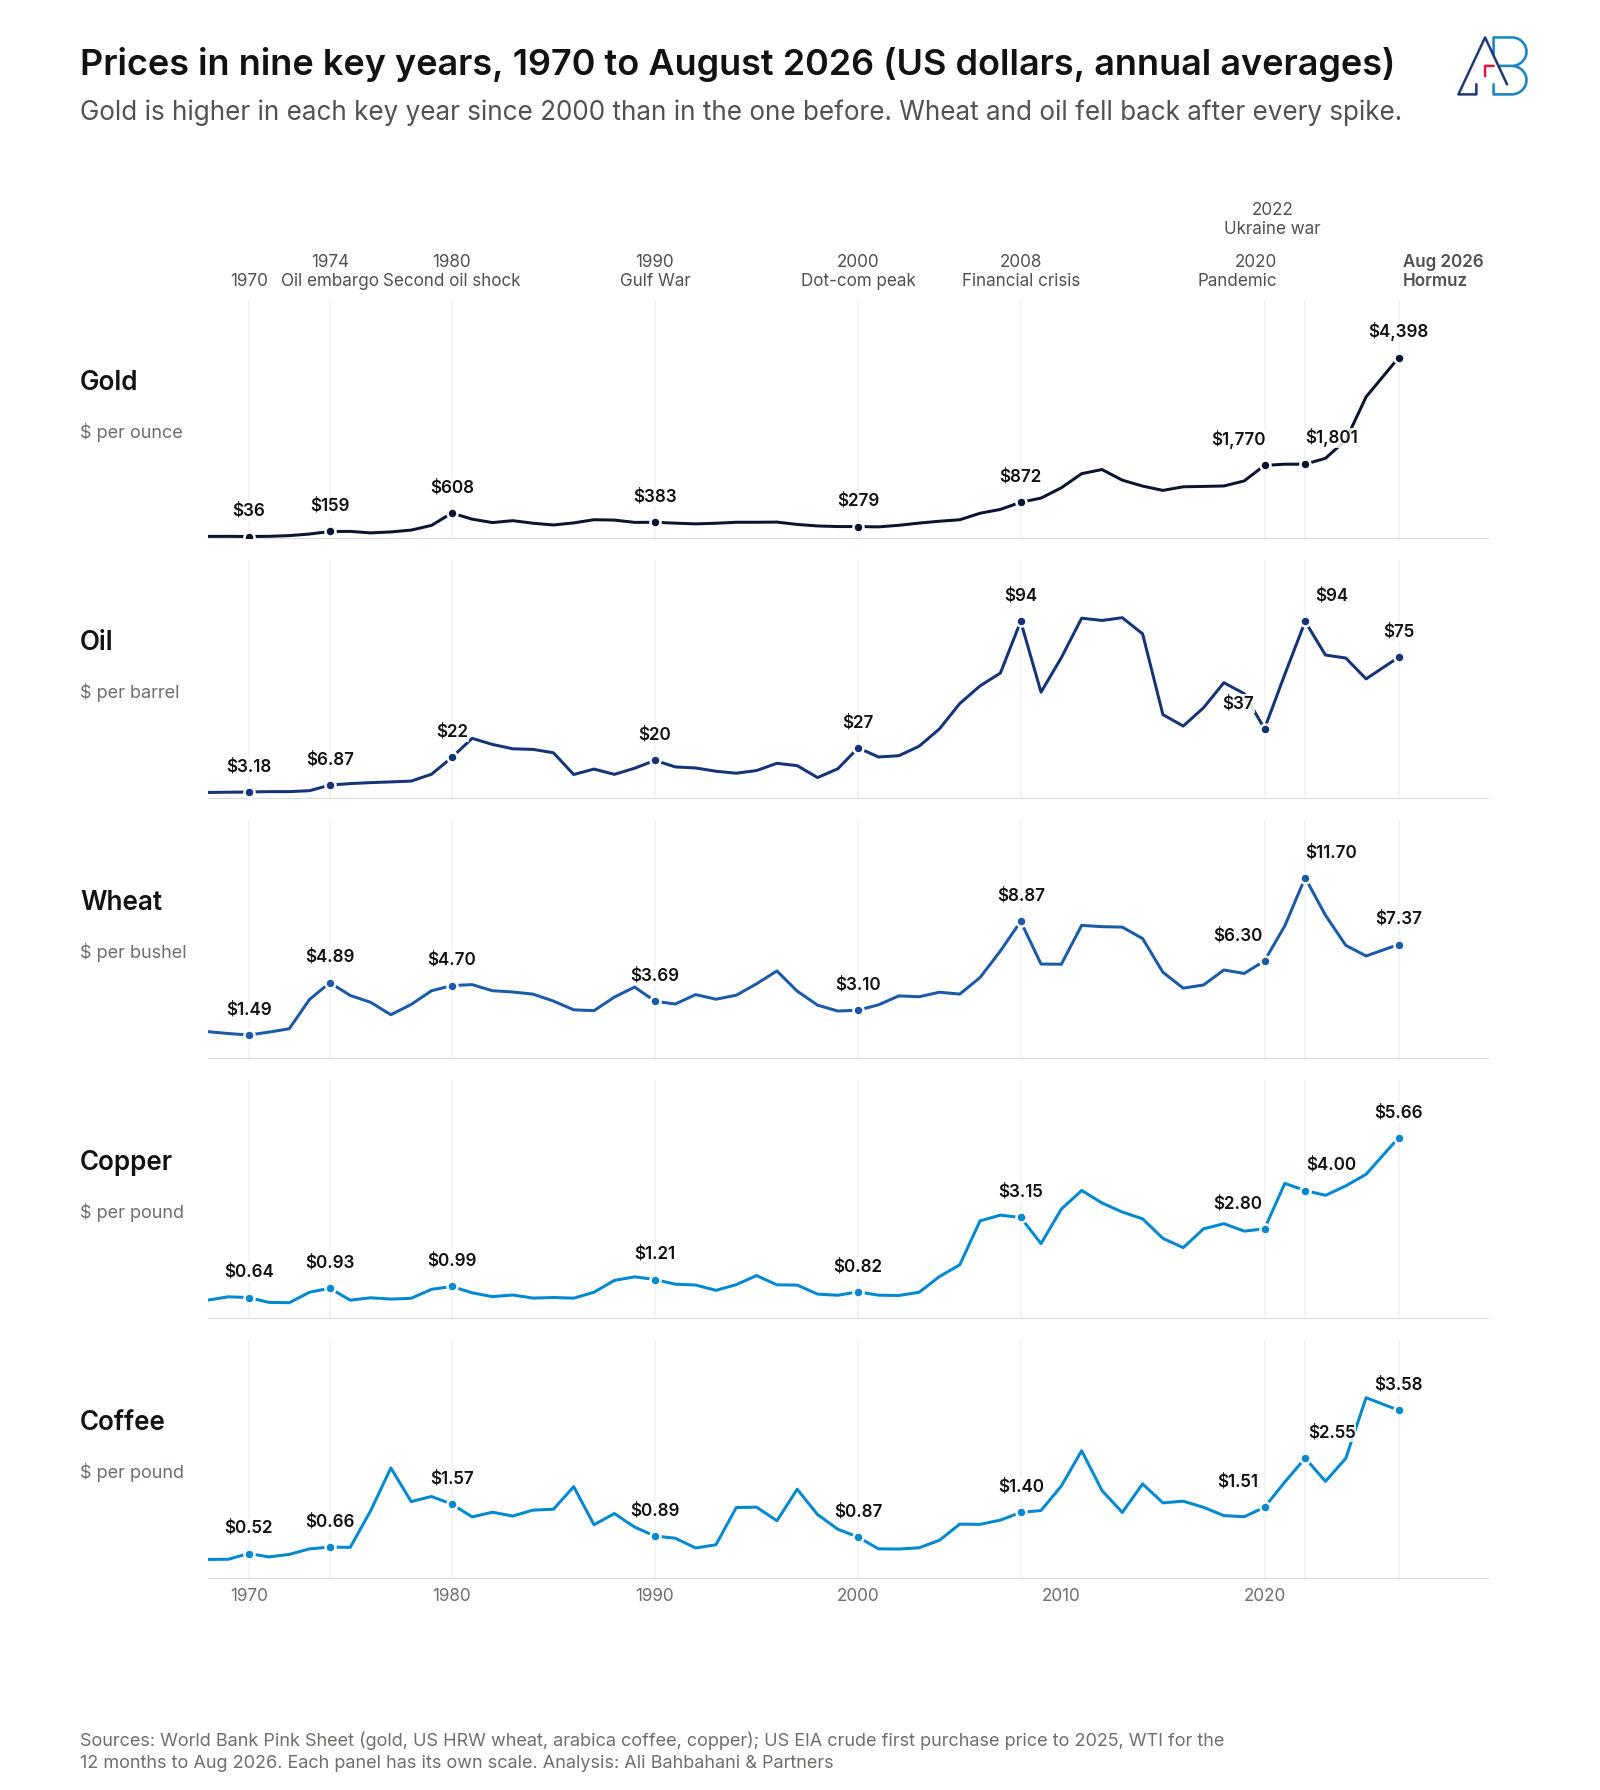
Figure 11 pulls out the prices in nine years that mark the shocks in this article. Gold's price in each of these years since 2000 is higher than in the one before. Wheat, oil, copper and coffee all fell back at least once after a spike.
Method and sources
Gold, US hard red winter wheat (Gulf export price), arabica coffee and copper, 1960 onward: World Bank Commodity Price Data (the Pink Sheet), annual and monthly series, September 2026 release. Wheat converted from dollars per tonne at 36.74 kg a bushel; coffee and copper converted to dollars per pound.
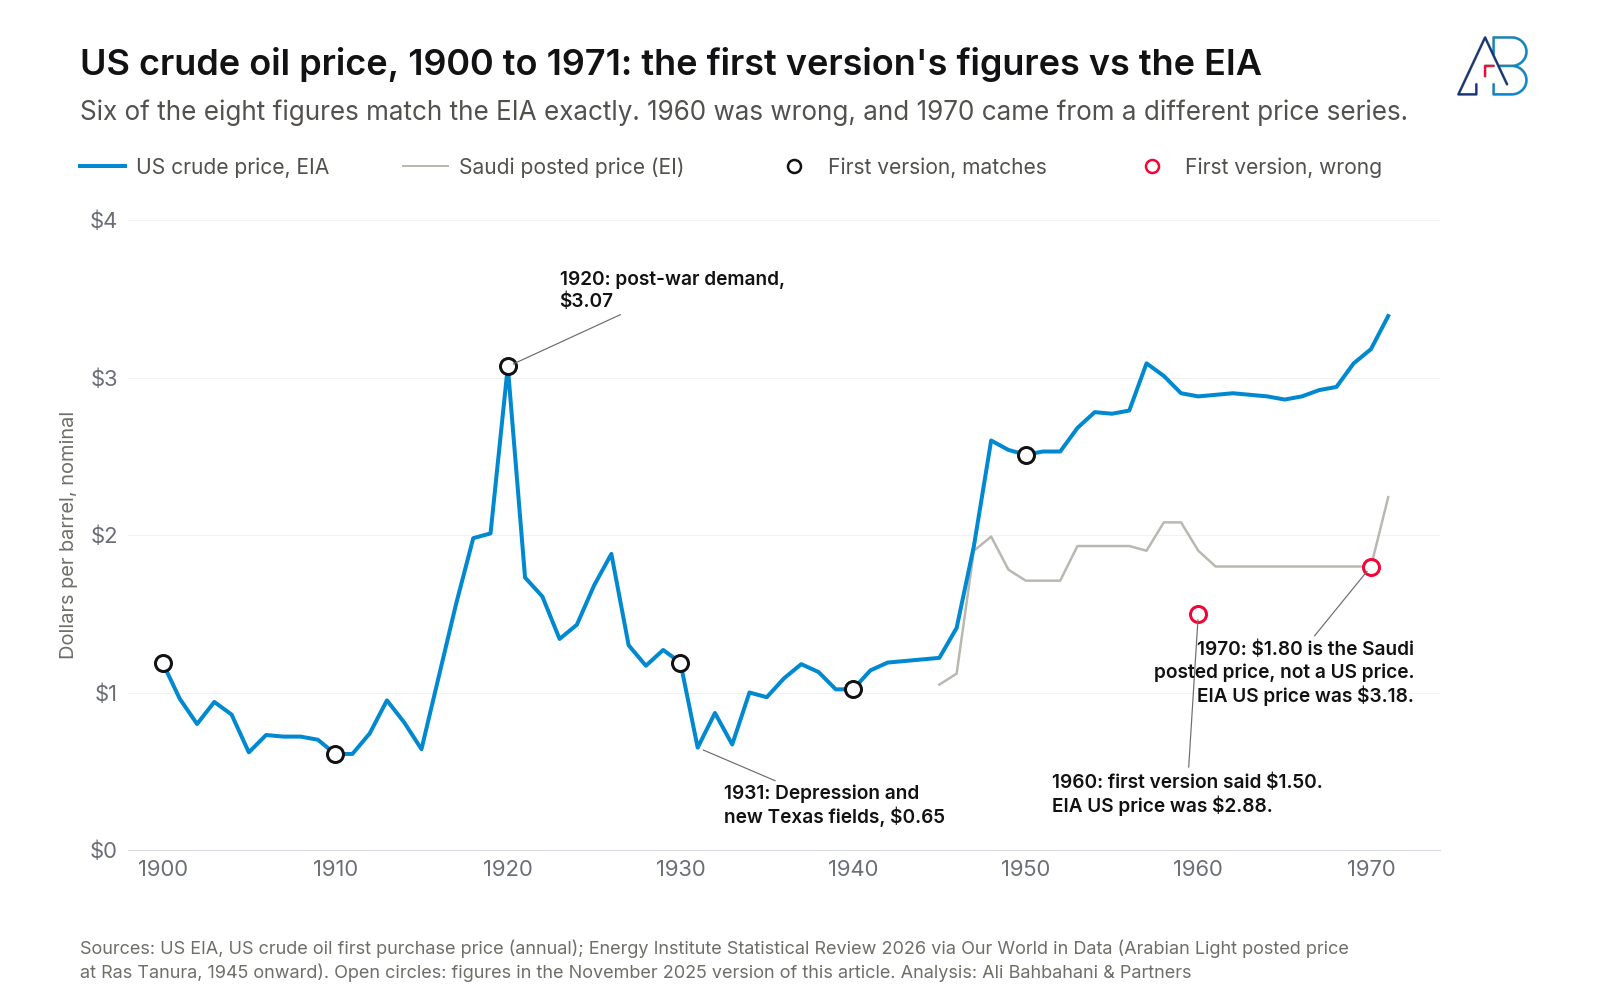
Oil: US Energy Information Administration, US crude oil first purchase price, annual, 1859 to 2025. The Saudi posted price in Figure 5 is from the Energy Institute Statistical Review 2026, via Our World in Data. The 12-month figure to August 2026 uses World Bank WTI prices. World crude figures use the World Bank average crude price.
Gold before 1968: the US statutory price ($20.67 from 1834, $35 from 1934); monthly London prices from the World Bank from 1968. Real price indices from Jacks, D.S. (2019), "From Boom to Bust: A Typology of Real Commodity Prices in the Long Run," Cliometrica 13(2), for 1900 to 2020, as published by Our World in Data. These were extended to August 2026 by applying the change in each commodity's CPI-deflated price in the series above, linked at 2020. Trends are log-linear fits to annual data from 1900 to the 12 months to August 2026. As a check, re-inflating the Jacks gold index from its 1960 value reproduces the $20.67 statutory price between 1900 and 1930 to within 2%.
Inflation: US Bureau of Labor Statistics CPI-U, and the Minneapolis Fed's historical CPI series for years before 1913. The October 2025 CPI reading was not published because of the US government shutdown, so the 12-month CPI average uses 11 months.
Income: US Census Bureau, Current Population Survey, Table H-5, median household income in current dollars.
"Today" in this article means the average of the 12 months from September 2025 to August 2026. Gold's 1970 figure is the market price ($36), not the official $35.
Ali Bahbahani is the founder of Ali Bahbahani & Partners, a Kuwait-based consultancy working across hospitality, real estate and customer experience.